
Expected Goals (xG) models allow us to quantify the chance quality of individual shots. This gives us the chance to quantify the probability of a team winning, losing or drawing the match, based on the two team’s total xG during the match. In turn, this can be translated into an expectation value for points gained in each match: we call this Expected Points (xPts or xP). In this blog post, we introduce and describe the model in detail.

The basic idea: simulating outcomes
The basic idea behind our Expected Points model is rather simple. Since xG represent the scoring probability for each individual shot, we can simulate the outcome of each shot a number of times. The fraction of times the outcome is positive, i.e. a goal is predicted, is the probability of the shot resulting in a goal. By applying this method to all shots occurring in a match, we can obtain the probability for each team to win, draw or lose. Expected Points are then simply the sum of the products between each probability and the corresponding points, i.e.:
xPts = 3 * p(win) + 1 * p(draw) + 0 * p(loss)
Refining the model: sequences and possessions
This simple model yields reasonable results, but it has one important flaw. If more than one shot occurs in the same possesion, it is possible that their combined xG value would be larger than one, which, if left unadjusted, would represent a scoring probability larger than 100% during the possession. This is obviously incorrect: if any of the shots fired in quick succession would have found the back of the net, the others wouldn’t have existed in the first place. It is therefore necessary to introduce a further step into the model, based on the structuring of match events into sequences and possessions.
We define a sequence as a series of controlled on-ball events belonging to the same team. For example, a series of passes starting with a goal kick and ending in a shot being deflected out for a corner kick, without the opposing team getting a controlled on-ball event in between, would be a sequence. A possession, in turn, is simply a series of uninterrupted sequences belonging to the same team. In the previous example, the following corner kick would start a new sequence, but continue the same possession.
This structuring of match events gives us the framework to solve the issue of multiple shots in quick succession, by computing the scoring probability not based on single xG, but from all the xG of a possession. This has to be based on possessions instead of sequences, because subsequent shots in the same possessions would not have happened if any of the previous ones would have resulted in a goal. Now, think back to the corner kick example, and assume that the corner leads to a shot on goal: this shot wouldn’t have happened if the previous shot, which originated the corner, ending the previous sequence, would have found the back of the net.
The probability of a possession with multiple shots resulting in a goal is calculated indirectly, as the inverse of the probability of not scoring:
p(goal) = 1 – p(no goal)
where, for an example with three shots in the possession with Expected Goals values xG1, xG2 and xG3,
p(no goal) = (1 – xG1) * (1 – xG2) * (1 – xG3)
This formula reflects the fact that each shot is only possible if the previous ones did not result in goals. We then use the scoring probability from the possession to perform thousands of simulations, derive win, draw and lose probabilities, and compute Expected Points as outlined above.
A new way to read league table standings
The total xPts of a team in a season can be compared to actual points, to give us an idea of whether the team collected more or less points than expected, based on the scoring chances they produced and allowed their opponents during the campaign.
For example, in the following figure we show a scatterplot of Expected Points versus actual points per game for the Serie A, at the middle point of season.
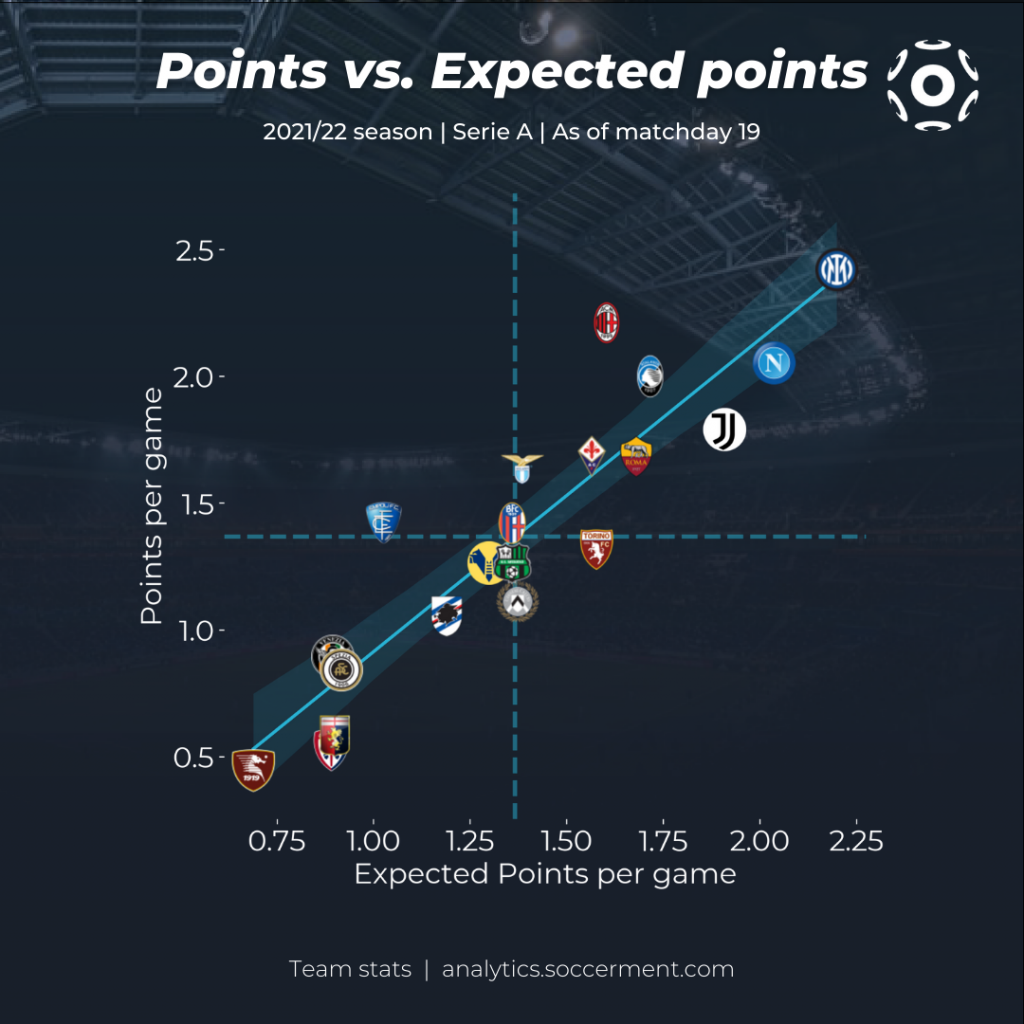
As we can see, points and xPts are very well correlated, as expected, but the significant deviations in the y-axis are a signal of a team earning significantly more or less points than expected. We can then see that AC Milan’s second place is not justified by their xPts, as is Empoli’s surprisingly high league standing. On the other hand, Juventus and especially Torino are performing significantly better than their league table standing would suggest.
This is an example of how advanced football analytics can support performance evaluation and the subsequent decision making within clubs, by going beyond the face value of standard metrics and complementing them.
For any query, suggestion or comment, you could send us an email: research@soccerment.com.
And please, follow us on Twitter: https://twitter.com/Soccerment_Blog