Soccerment
FOOTBALL ANALYTICS
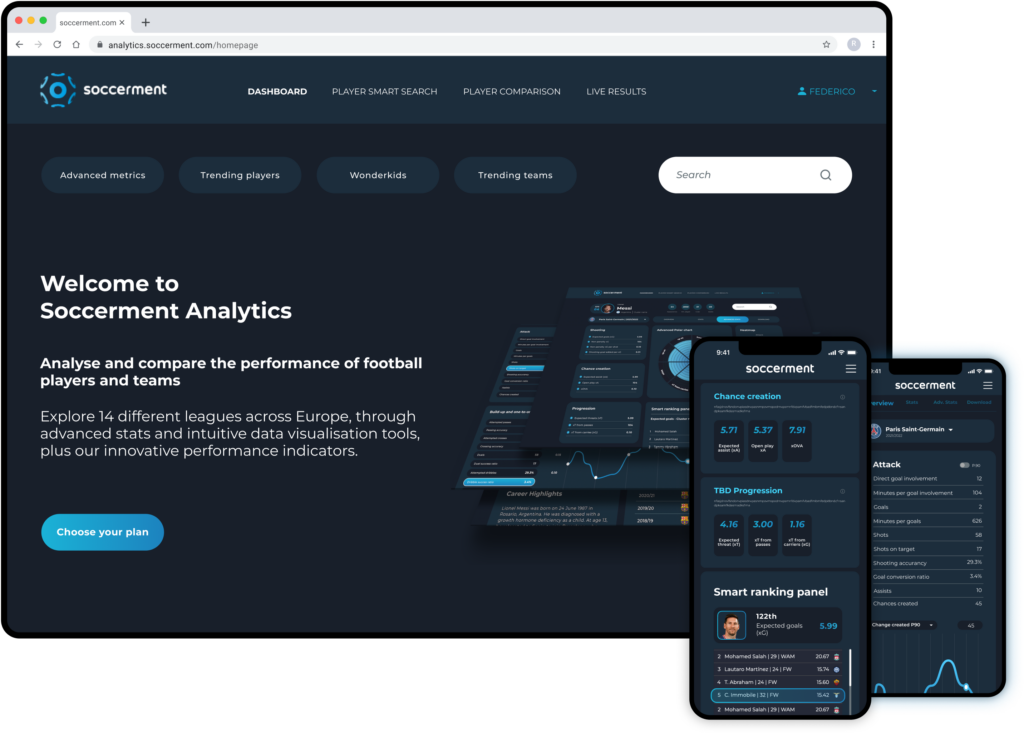
Stats, smart performance indexes
and data visualization.
All in one football analytics platform.
Designed to enrich your football knowledge.
MEMBER?
LOG IN
ROOKIE?
START HERE
DATA
SCIENCE
APPLIED TO FOOTBALL
Innovative Indexes
Explore and evaluate the performance of players and teams, through innovative indexes and intuitive data visualisation tools.
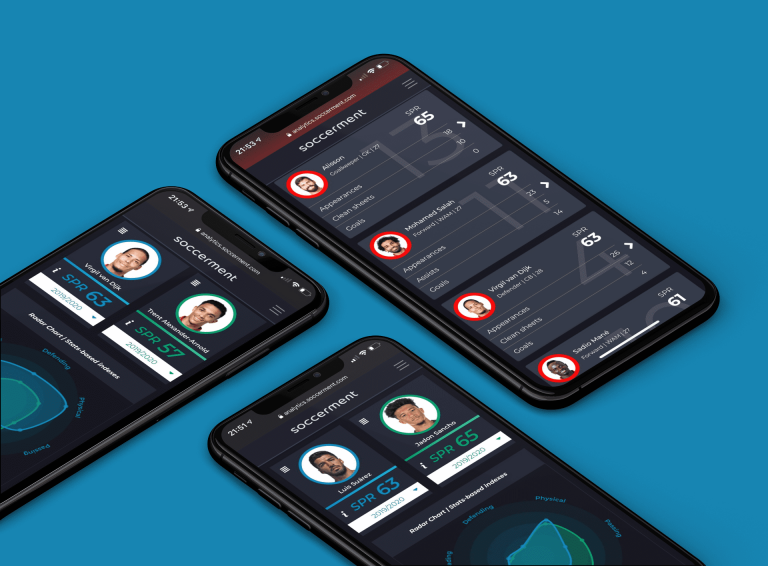
User-friendly display of data
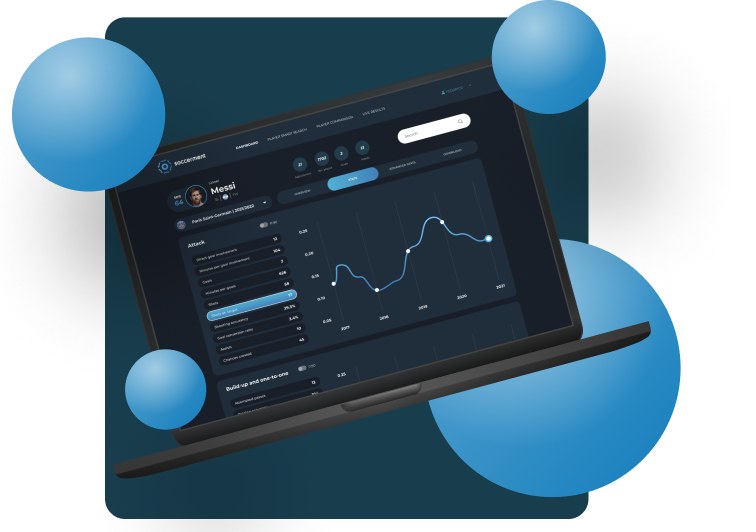
Analyze the players’s most relevant statistics and anticipate their potential development.
Optimized for mobile
Your football journey in your pocket, from the simplest to the most advanced analytics tools.

Do you want to become a football analytics expert?
FROM COMPLEX DATA TO
ACTIONABLE INSIGHTS
Start with the most common stats, such as the number of goals and assists.
Continue by discovering the usefulness of “per-90-minutes” data, which allows you to fully compare players.
Finish the journey with one of our machine learning algorithms , for example the one that automatically finds the most similar players to any footballer, based on their performance: a very useful scouting tool to discover unknown talents.
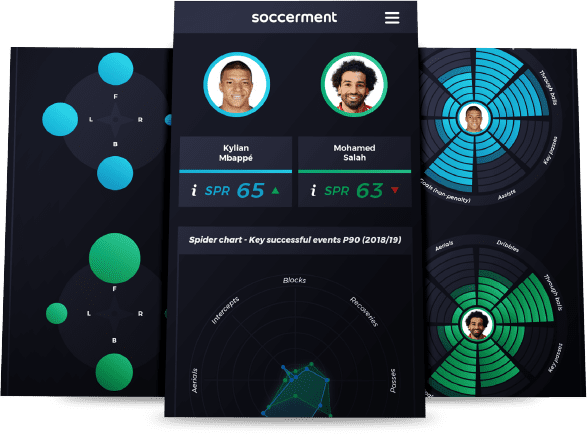
SOCCERMENT PERFORMANCE RATING
The Soccerment Performance Rating (SPR) is designed to transform complex statistics into accessible and actionable insights, to facilitate football talent discovery.
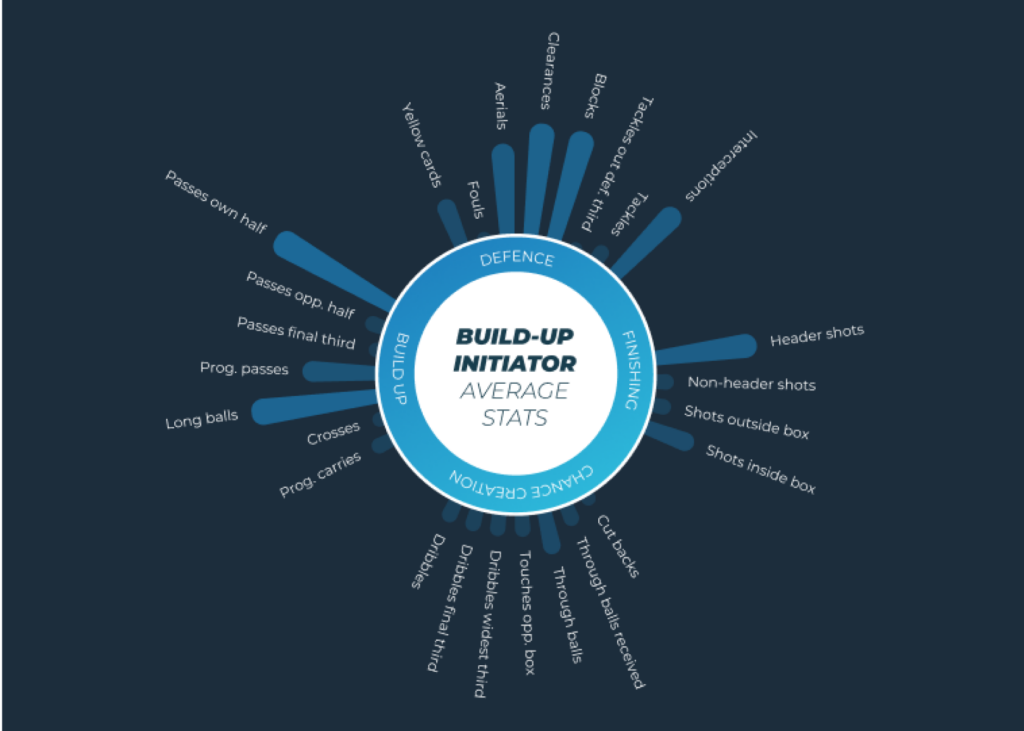
We take into consideration all the available information on the technical events:
(every icon is associated with a player… click on them!)
Shots
Yellow Cards
Passes
Headers
crosses
Dribbles
Launches
Chances created
…and many more! We turn them into “per-90-minutes” stats, weighting them for their importance to the team’s results, with different weights depending on the player’s tactical role.
SPRs are assigned to players who have played at least 270 minutes , in order to have statistical relevance. Then there are a number of adjustments that we apply, to make the ratings as fair as possible, including:
Minutes per appearance
- we adjust the ratings for the number of minutes per appearance, favoring the contributions of those players who have a higher playing time per appearance
League
- assuming that 10 goals in the English Premier League are worth more than 10 goals in the Championship, we analyzed how stats change in the transition from one league to another, developing ad hoc ratios to normalize the results
Bring out the Analyst in you!
8.000
PLAYERS AND COUNTING
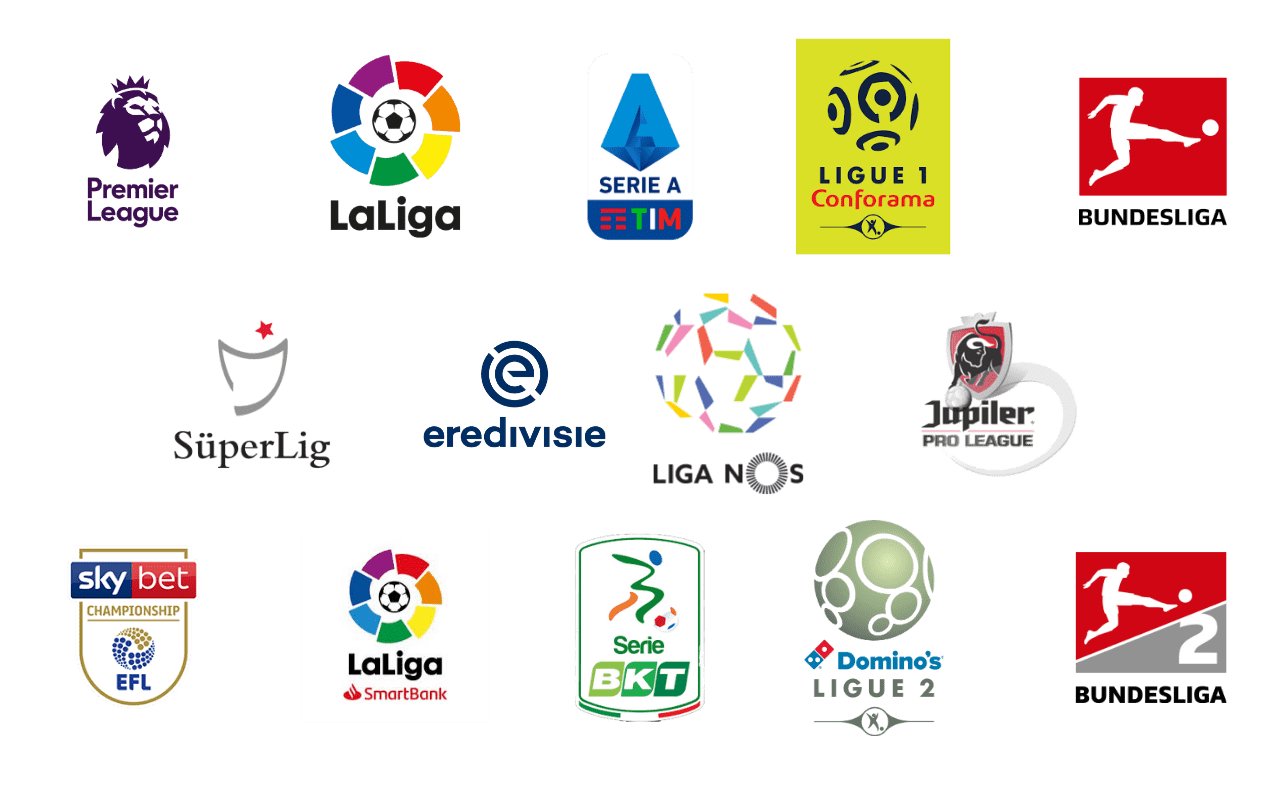
Our database keeps growing and is currently made up of more than 8.000 players, across 14 different leagues , in 9 countries.
We show the stats of all players and teams of the first and second divisions of England, Spain, Italy, Germany and France. Furthermore, we include the Eredivisie (Holland), Primeira Liga (Portugal), Süper Lig (Turkey) and the Jupiler Pro League (Belgium).
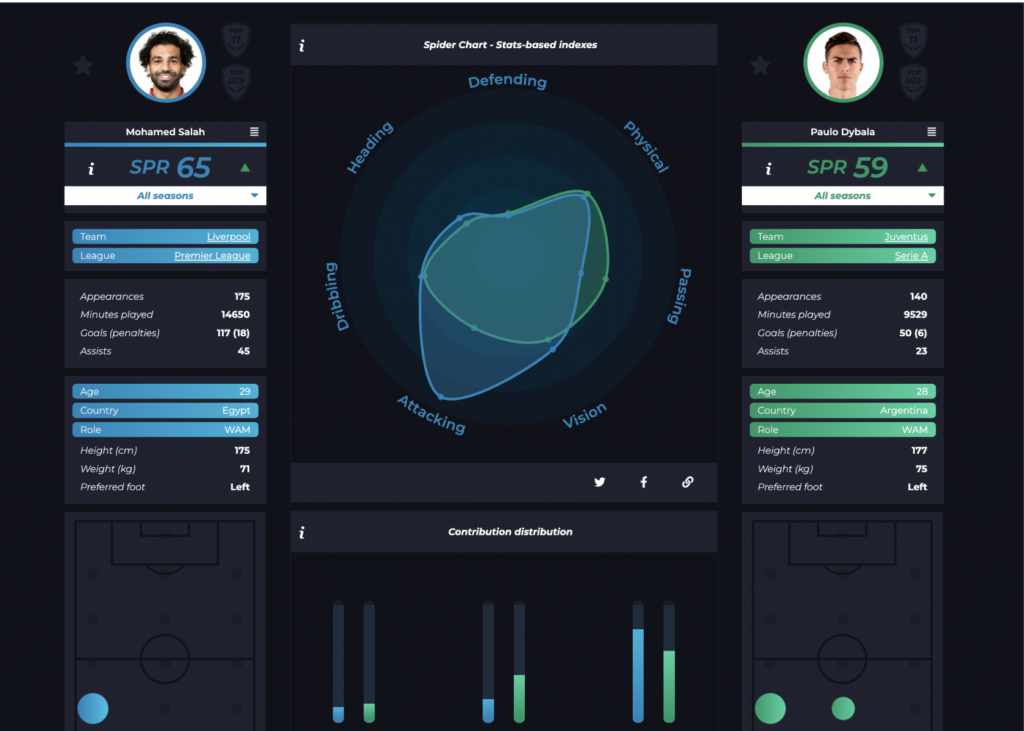
COMPARE ANY PLAYER WITH OUR SPIDER CHART
Spider Charts are – in our view – the best way to visualize performance and compare players.

To do so we use seven indexes , derived by a series of proprietary algorithms developed by our Research Team, that – as for the Soccerment Performance Rating – we adjust considering the league, playing time and other factors.
DEFENDING
For this index, the algorithm developed by our Research Team takes in consideration all the main defensive actions (such as tackles, clearances, ball recoveries, etc), along with their end results (clean sheets, goals conceded). For the goalkeepers, it obviously takes in consideration also all the saves and the shots on target against. If a goalkeeper and/or a defender have higher-than-average success ratios on defensive actions and they are part of a team which is able to concede a few goals, then it is highly probable that they perform well on this index.
PHYSICAL
The physical characteristics of the players (including height, weight and the body mass index) are blended using the internally-developed age curves. Goalkeepers and physically-strong strikers generally do well on this index.
PASSING
Attempting 120 passes per match is not enough to do well on our Passing Index, as this favours the most audacious passes (for example, the forward passes and the long passes). The index also distinguishes for the location of the passes, obviously applying higher coefficients to the ones made in the last third of the pitch. Playmakers, like Frankie de Jong, Sergio Busquets, Marco Verratti and Jorginho generally do well on the Passing Index.
VISION
If you are looking for a creative attacking midfielder or winger, keep an eye on the Vision Index. Our Research Team developed it by putting a lot of emphasis on through balls, chances created and second assists, apart from – of course – assists. Kevin de Bruyne and Dimitri Payet are often among the main contenders for the top spot on this index.
ATTACKING
The Attacking Index, unsurprisingly, favours the strikers who are able to: often touch the ball in the opposition box, take many shots from favourable positions, have a high shooting accuracy and – ultimately – score a lot of goals. Robert Lewandowski, Cristiano Ronaldo, Kylian Mbappé and Sergio Agüero are often top-ranked here. Not a surprise, right?
DRIBBLING
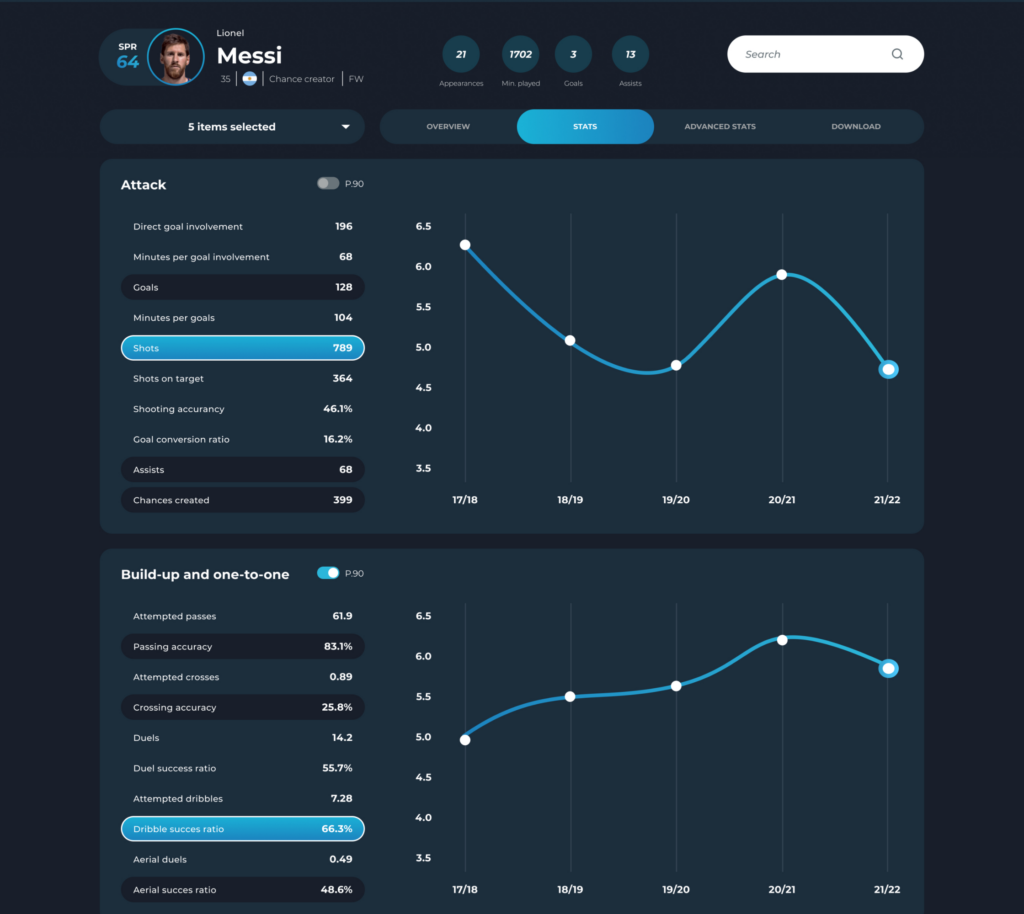
It is not only the number of dribbles that a player attempts, but the percentage of the successful dribbles, to make a player King of the Dribbling Index. At the time of writing, Lionel Messi is King, with 7.9 attempts per 90 minutes and a 74% success rate.
HEADING
If a player is much taller than average, wins more aerial duels than average and – from time to time – also scores with magnificent headers, then it is highly probable to see the player topping the Heading Index. Definitely an Index for the Chris Wood’s and Leonardo Pavoletti’s of the world. For a full list, see our research here.
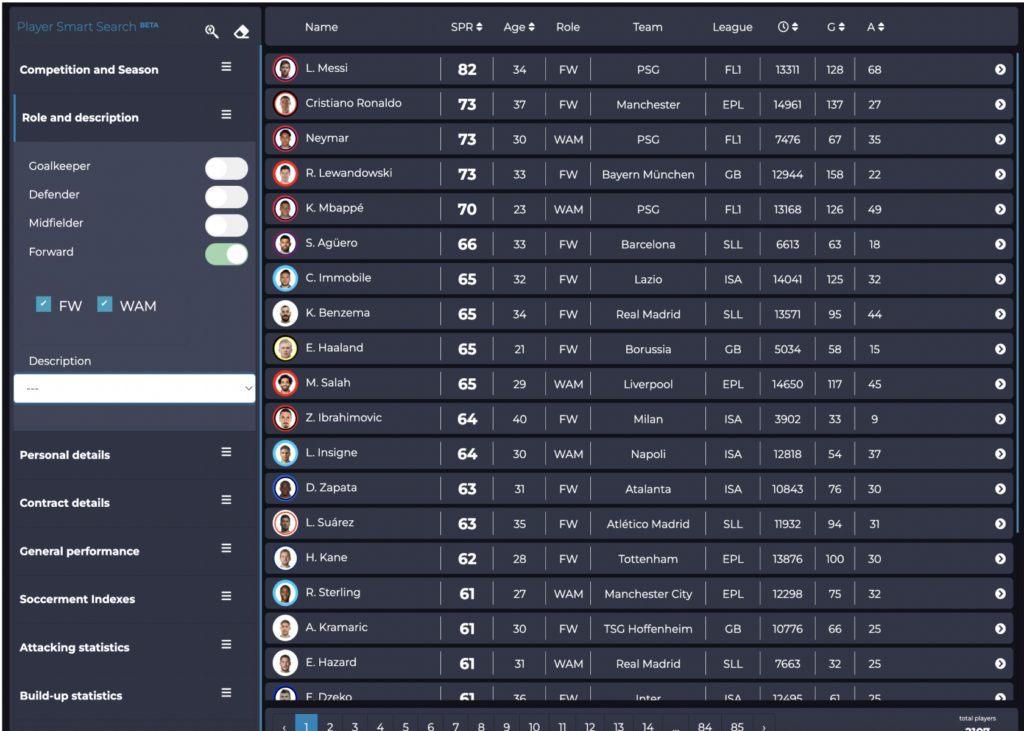
Find the most similar players – based on their performance – to any player: a scouting tool very useful for discovering unknown talents.
Compare and find talents, it’s free!
COMPARE ANY TEAM WITH OUR RADAR CHART
While for the players we use the Spider Charts, for the comparison of the teams we make use of Radar Charts. Yes, they look similar.
There is one big difference though: whilst the former display our Performance Indexes, the latter show the teams’ six key stats per 90 minutes.
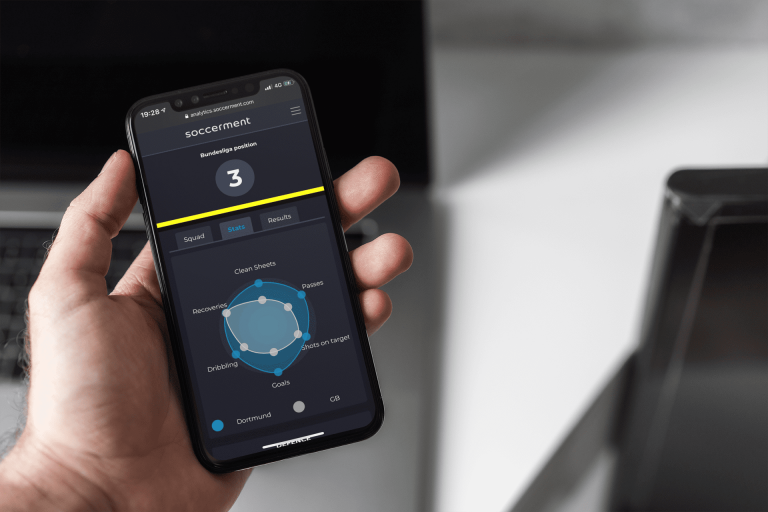
Let’s compare the key stats of the team in question (in blue) with the average of the statistics of all the other teams (in bianco) of the same league.
When the statistics are better than the average they are highlighted in green, in red if worse.
In the example below, the much larger area of the Dortmund Radar Chart is clearly related to the good position of the team in the Bundesliga (third at the time of writing). Out of 12 KPIs, Borussia performs for 9 times much better than the average Bundesliga Team, underperforming only in the percentage of saves which is 54.3% against the average 67%.
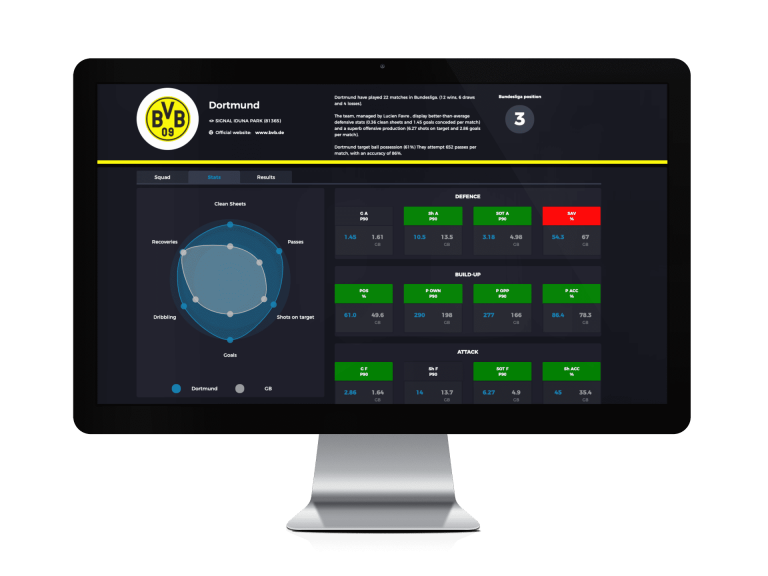
On the right of the Radar Chart, some more key stats – expressed in per-match data – deepen the provided analysis.
In order to assess the defensive skills of the teams, we put:
Goals conceded
Shots against
Shots on target against
Saves ratio
The build-up ability is represented by:
Ball possession percentage
Successful passes in the own half
Successful passes in the opposition half
Passing accuracy
Finally, the offensive production is synthesised using:
Total shots
Shots on target
Shooting accuracy
Goals scored
Find out the key statistics of your favorite team, evaluate its skills and compare them with the other teams.
TOP 11
SELECTIONS
Our mathematical models automatically select the top seasonal performers for every team and every league in our database.
We use a 4-3-3 formation and select the players displaying the highest SPRs, using the following scheme:
One goalkeeper, the best right back (or right wing-back), the two best centre-backs, the best left back (or left wing-back). In midfield, we take the top three midfielders (defensive mid and/or attacking mid and/or central mid) and the best three forwards (strikers and/or central forwards and/or wide forwards).
Take for example the Top 11 selection for the Premier League, as of 20 February 2020.
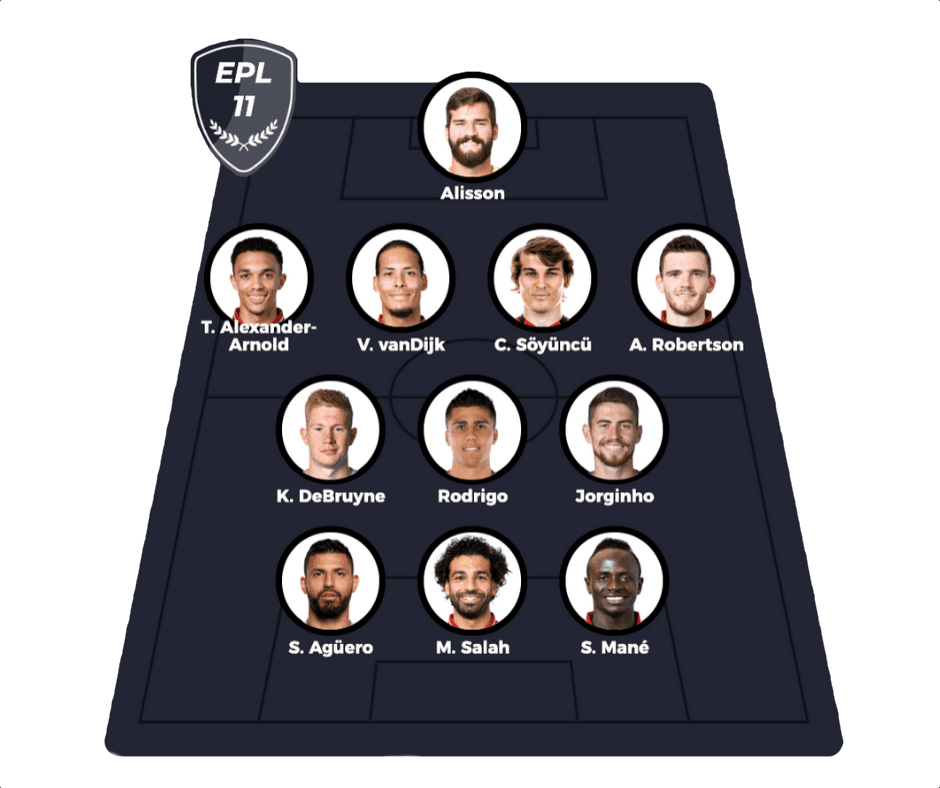
The top goalkeeper, according to our rating system, is Liverpool’s Alisson.
Reds displays other three defensive players: Trent-Alexander Arnold (top SPR among right-backs), Virgil Van Dijk (top SPR among centre-backs) and Andrew Robertson (top SPR among left-backs). Leicester’s Çaglar Söyüncü (second-highest SPR among centre-backs) completes the defence.
In midfield, we take the top three SPRs among the macro-group “Midfielders”, which includes the defensive midfielders (DMC), central midfielders (CM) and central attacking midfielders (CAM). Manchester City’s De Bruyne and Rodrigo display the two highest SPRs among Midfielders, followed by Chelsea’s Jorginho.
In Attack, Manchester City and Liverpool again dominate the scene, with Sergio Agüero, Mohammed Salah and Sadio Mané displaying the top 3 SPRs of the macro-group “Forwards” (strikers, central forwards and wide forwards).
TALKING ABOUT SOCCERMENT
Our research, articles and studies have been shown on:

Previous
Next
OUR MISSION IS TO ACCELERATE THE ADOPTION OF DATA ANALYTICS IN FOOTBALL
![]()
It’s your turn to become a football analytics expert
Do you need additional details? Please have a look at our F.A.Q.

“>”>ANALYTICS PLATFORMS
“>Complexity made simple
“>Smart data visualisation, stats and advanced metrics for an in-depth but fast player and team performance analysis.”>
MENTIONED ON

Previous
Next
“>”>A SCIENTIFIC APPROACH FOR ACTIONABLE INSIGHTS.”>
“>”>Our platform is designed to transform cold and obscure statistics into actionable insights. Get the most out of your football analysis through our proprietary advanced metrics and performance indicators, extracting unprecedented intelligence and optimise performance analysis and smart scouting.”>
FOR ALL FOOTBALL LOVERS“>

“>”>Clubs & Football
Professionals
Discover, fully analyse and compare players and teams more objectively through advanced metrics and data visualisation.

“>”>Talent
scouting
Embrace a data-driven decision making culture using our smart scouting tools, the faster solution for better scouting.

“>”>Journalists
& Bloggers
Save time with our intuitive tools and write more in-depth analysis using data to create innovative and meaningful insights.

“>”>Fantasy Football
Champions
Get ready for the transfer window and increase your chances of victory by picking the best performers at the lowest price.
“>”>”>Join Soccerment today
Join Soccerment now and get the best out of football data stats.
Custom analytics, innovative indexes, and regular updates all for a premium.
Free Membership
Free access to the Top 5 Leagues: Premier League, Serie A, La Liga, Bundesliga and Ligue 1
€
0.00
- Top 5 Leagues
- Advanced metrics
- Player Smart Search
- Charts & Data download
-
Quarterly call with our team -
Access to our exclusive Discord -
Access to our eBooks
Europa Membership
Yearly access to the Top 9 Leagues: Top 5 + Eredivisie, Primeira Liga, Belgian Pro and Turkish Süper Lig
€
199
- Top 9 Leagues
- Advanced metrics
- Player Smart Search
- Charts & Data download
-
Quarterly call with our team -
Access to our exclusive Discord -
Access to our eBooks
PRO Membership
Yearly access to 17 leagues, including MLS, Brasileirão, Argentina’s Tier I, Tier II leagues in Eng, Ita, Spa, Ger and Fra.
€
499
- 17 Leagues
- Advanced metrics
- Player Smart Search
- Charts & Data download
- Quarterly call with our Team
- Access to our exclusive Discord
- Access to our eBooks
TOP 5 LEAGUES FOR FREE
ENJOY THE FULL ACCESS
“>14 DAYS FREE TRIAL. IT’S ON US!”>
“>”>NO CARD REGISTRATION NEEDED, JUST SIGN UP AND ENJOY.”>
“>”>SOCCERMENT ANALYTICS PLATFORM – FEATURES AND STRENGTHS
“>”>”>MAIN FEATURES
“>”>Athlete and team stats
“>”>”>Deep dive into a detailed analysis of Athletes and Teams playing in the 5 top European leagues. Search, compare, analyse, download. All in one place.
“>”>Advanced metrics & proprietary algorithms“>
“>”>Advance metrics are playing a fundamental role when talking about Players predictive analysis. We offer a selection of advanced metrics and proprietary metrics that will easily translate complex data into actionable insights.”>
“>”>Player Smart Search – scouting tool”>
“>”>Looking for a midfielder that best fits your club’s playing style, or for the next wonderkid? Our ‘Player Smart Search’ will make it easy and fast.”>
“>”>Smart data visualisation”>
“>”>The complexity of advanced analytics made clear and intuitive. Enjoy frictionless navigation in our platform and our mobile optimized smart data visualisation.”>
“>DISCOVER OUR ADVANCED METRICS
“>& PROPRIETARY ALGORITHMS”>
“>”>SPR”>
“>”>Soccerment-Performance-Rating is a omni-comprehensive player performance indicator. We take in account all the available information on the technical events: shots, passes, crosses, launches, yellow cards, headers, dribbles, chance created, minutes per appearance and league.”>
“>”>xOVA”>
“>”>Expected Offensive Value Added: a proprietary algorithm that measures the player’s ability to “positively transform” the possession, i.e. to increase the team’s chances of scoring a goal.”>
“>”>BDP”>
“>”>Buildup Disruption Percentage: a proprietary algorithm that measures the team’s ability to disrupt the opposition’s buildup.”>
“>”>FIELD TILT”>
“>”>Describes the percentage of all final third passes belonging to a team in all of their matches, giving a measure of territorial dominance.”>
“>+12K pLAYERS | ACROSS 17 DIFFERENT LEAGUES | IN 12 COUNTRIES”>


Previous
Next
“>”>”>Try our advanced Analytics Platform
and join Soccerment today.
Our soccer statistics database keeps growing and is currently made up of more than 12,000 players, across 17 different leagues, in 12 countries. We show the stats of all players and teams of the first and second divisions in England, Spain, Italy, Germany and France. Furthermore, we include the Eredivisie, Primeira Liga, Süper Lig, Jupiler Pro League, MLS, Brasilerao and Argentina’s Primera Division.
PLAYER ANALYSIS”>
[elementor-template id=”23200″]
[elementor-template id=”23210″]
[elementor-template id=”23213″]
Previous
Next
“>TEAM & LEAGUE ANALYSIS”>
“>TEAM STATS, CHARTS & INSIGHTS”>
“>”>Find a complete overview on the team’s performance in the Attacking, Build-up and defensive phase. Radar charts allow to visualise and compare team performances.
Summaries with the team’s top performers are also available.”>
“>”>ADVANCED METRICS”>
“>”>xPoints, xG, xGA, BDP, Field Tilt and many more metrics are available to fully understand team performances without being influenced by results. “>
“>”>TEAM RANKINGS & LEAGUE TABLES
“>”>Browse through numerous rankings and discover the leading teams for each of our metrics. Visualise league tables with numerous insights into team performances such as xPoints and compare results with previous campaigns.”>
SERIA A xPOINTS
Premier League
Serie A
Ligue 1
Süper Lig
Jupiler Pro League
Championship
2.Bundesliga
La Liga
Bundesliga
Eredivisie
Primeira Liga
Segunda division
Serie B
Ligue 2
TALENT SCOUTING
IN MODERN FOOTBALL
“>Player Comparison Tools”>
Soccerment’s Player Comparison tool is developed to compare in detail the performance of one player to the average or to a specific one within our pool of athletes.
START
“>”>Player Smart Search
Soccerment’s “Player Smart Search” is a data-driven scouting tool which allows the user to find the targeted footballers, based on their statistics and/or their performance indices.
START
“>Player Clustering NEW! “>
The latest frontier of talent scouting in modern football is defined by player functions, not geographical location on pitch. We have clustered players from the top 5 leagues in functional brackets, to make talent scouting smarter than ever.
COMING SOON”>
Lorem ipsum dolor sit amet, consectetur adipiscing elit. Ut elit tellus, luctus nec ullamcorper mattis, pulvinar dapibus leo.

John DoeCEO
Lorem ipsum dolor sit amet, consectetur adipiscing elit. Ut elit tellus, luctus nec ullamcorper mattis, pulvinar dapibus leo.
John DoeCEO
Lorem ipsum dolor sit amet, consectetur adipiscing elit. Ut elit tellus, luctus nec ullamcorper mattis, pulvinar dapibus leo.
John DoeCEO
Previous
Next
“>14 DAYS FREE TRIAL. IT’S ON US!”>
“>”>NO CARD REGISTRATION NEEDED, JUST SIGN UP AND ENJOY.”>
TOP 5 LEAGUES FOR FREE
ENJOY THE FULL ACCESS
MENTIONED ON
Previous
Next
SOCCERMENT BLOG AND RESEARCH
The Very Exclusive xOVA Club
25 May 2022
No Comments
We introduced Expected Offensive Value Added, or ‘xOVA’, to facilitate scouting for creative and skilled players, who are able to have a great impact in the final third of the …
Measuring pressing success: Buildup Disruption Percentage (BDP)
27 January 2022
No Comments
Pressing is a fundamental part of many teams’ game plan in modern football. At the same time, it is difficult to measure it accurately using event data. While PPDA is …
Read More

Team Stats & Analysis
Data-driven scouting for Newcastle
18 January 2022
No Comments
After the takeover from PIF, Newcastle United was set to become one of the main players in January’s transfer market. This has indeed been the case, with the Magpies already …
E-BOOKS AND PRINTED BOOKS

“>Function, not positions
(Ebook | EN)“>
Pressing is a fundamental part of many teams’ game plan in modern football. At the same time, it is difficult to measure it accurately […]
COMING SOON
“>”>The Football Analytics handbook (Ebook | EN)
After the takeover from PIF, Newcastle United was set to become one of the main players in January’s transfer market. This has indeed […]
GO TO THE SHOP

“>Wonderkids 2021 Outlook
(Printed version | ITA)“>
Pressing is a fundamental part of many teams’ game plan in modern football. At the same time, it is difficult to measure it accurately […]
GO TO THE SHOP
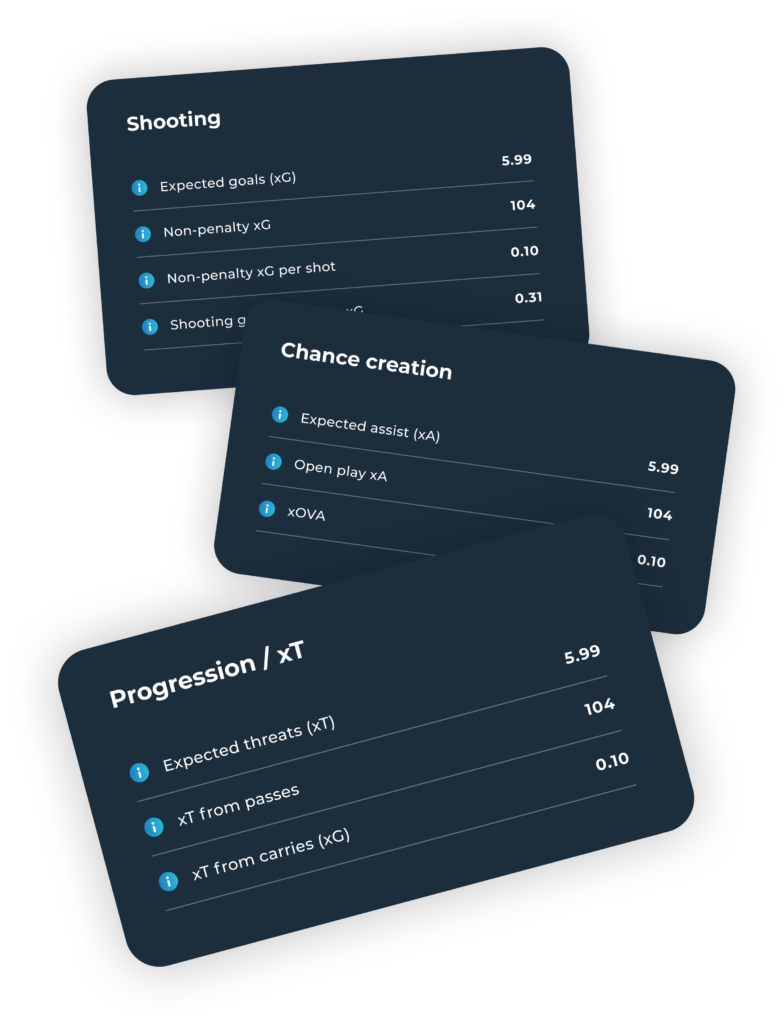
“>PLAYER ADVANCED METRICS”>
Receive RAPID and ACTIONABLE INSIGHTS through our ADVANCED METRICS and DATA VISUALISATION TOOLS.
Browse through different seasons to analyse trends over time and uncover every detail.
POLAR CHARTS sorted by clusters, POSITIONAL HEAT-MAPS, SMART RANKING PANELS and PLAYER SIMILARITY ALGORITHMS are just some of the features you can utilise to grasp every aspect on player style and performance.