

We investigate the link between shot quality, as measured by the team average xG per shot, and both results (in terms of wins) and performance (measured with our Expected Points model), for the top 5 European leagues. We find a strong link between xG per shot difference (xG per shot minus xG per shot conceded, or xGD/shot) and match win rate, with 71% of matches with an xGD/shot above 0.05 resulting in a win. We also find a significant correlation between xGD/shot and Expected Points. These results highlight xGD/shot as a significant metric to consider when evaluating team performance, alongside aggregate metrics such as total xG difference.

Introduction
Discourse around football and the outcome of individual matches often revolves around volume metrics, i.e. stats that show how much of a certain thing a team has done and whether it was more than the opponent. We see this with many metrics, ranging from possession percentages to distance covered and to shots, without focussing on the putative relationship between them and actual results and/or performance.
Concerning shots, switching from shots to Expected Goals (xG), and therefore from a binary (goal / no goal) to a probabilistic system, provides us with a much better measure of the quantity and quality of chances a team creates. The total xG in a match or a season are a better indicator of the teams’ underlying performance than just a shot count, but are obviously not the full story. In individual matches, it isn’t uncommon to see unexpected outcomes: teams losing having registered higher amounts of possession and/or shots (and sometimes even xG or non-penalty xG). Here are some recent examples, taken from our new match reports.
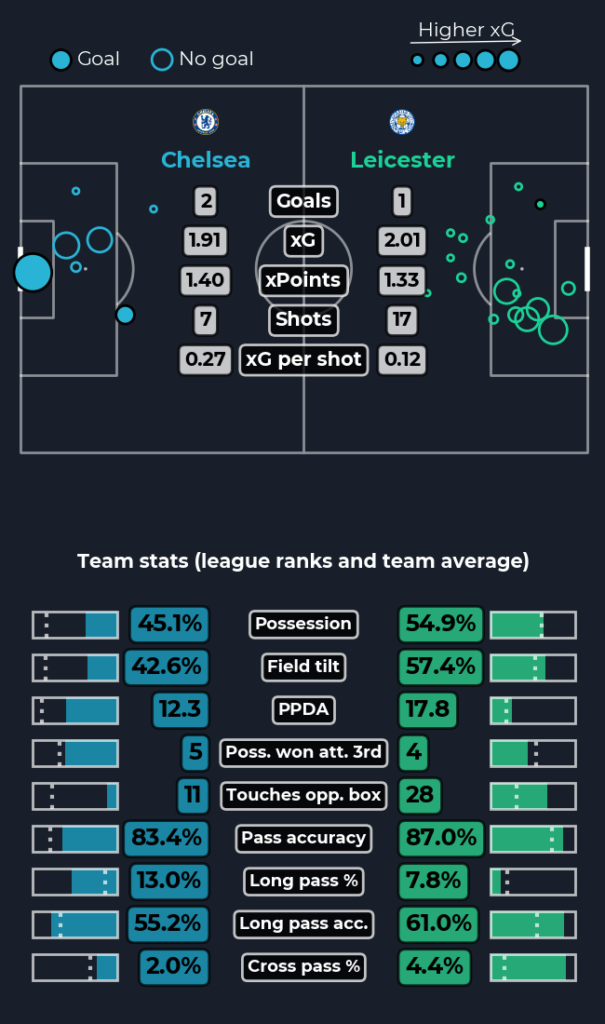
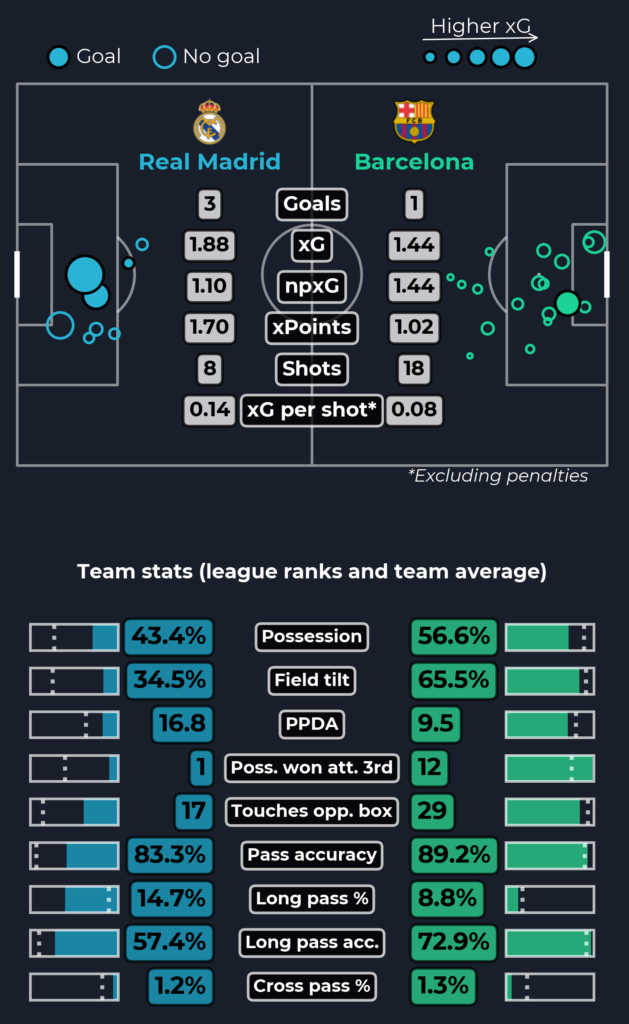
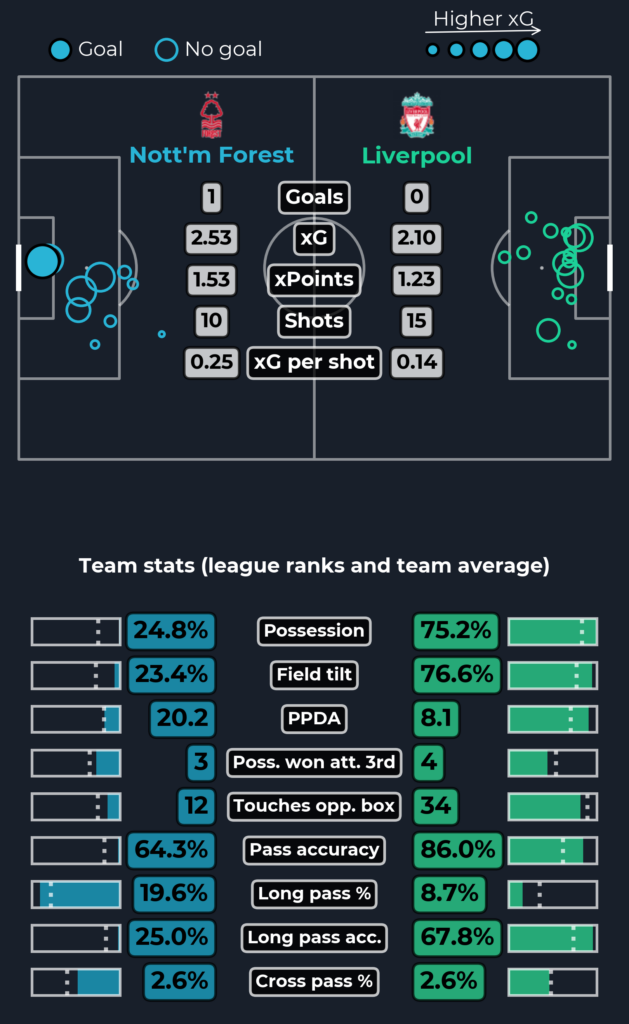
What do these three matches have in common? The teams who won took fewer shots, had lower ball possession percentage and lower field tilt. In one case (Chelsea vs Leicester), the winning team even accumulated less Expected Goals than the losing one. But we can see one common feature: the team who took home the three points had a higher average (non-penalty) xG per shot. This means they have been more selective in their shooting, taking shots in situations that were more likely to result in a goal.
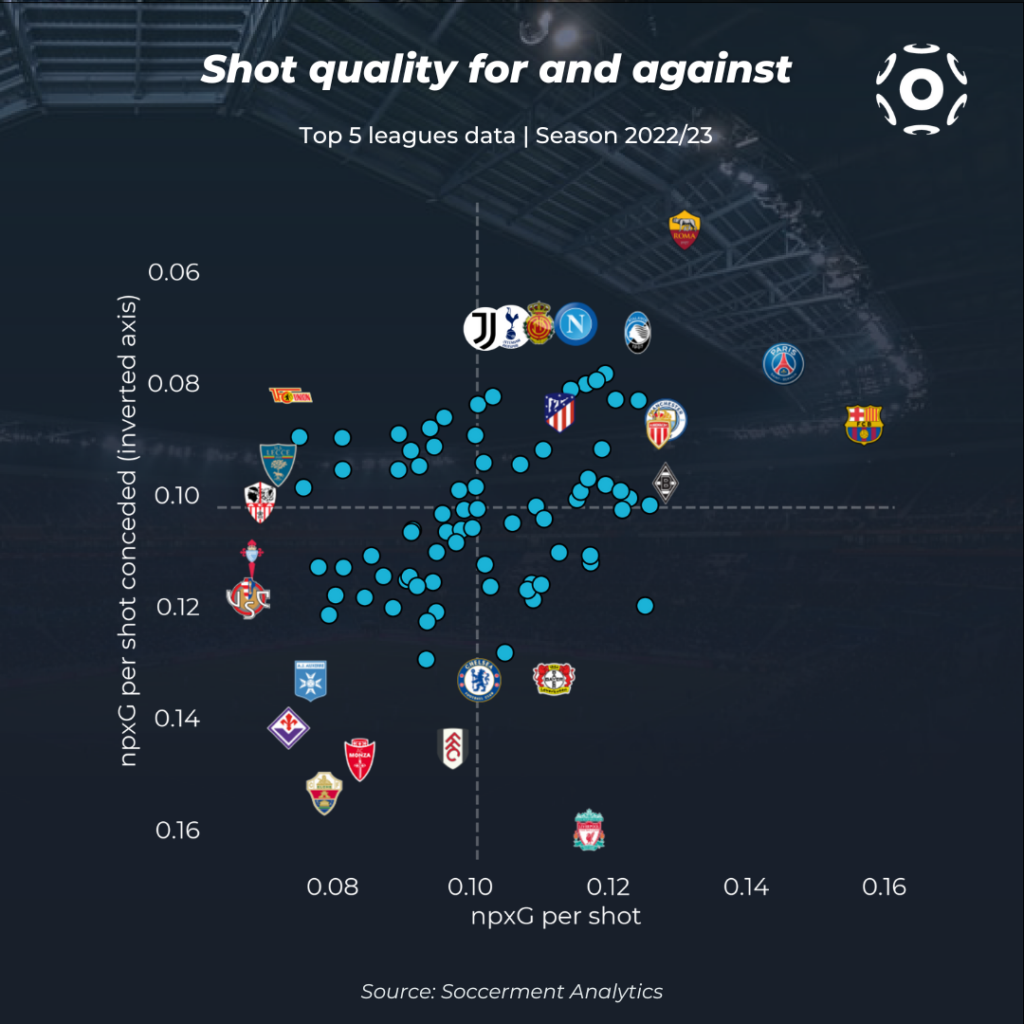
Naturally, this simple numerical fact can have different explanations. If a team decides to employ a low-block, counter-attacking strategy, if successful, they will take their shots against a disorganised and numerically disadvantaged defence, resulting in higher quality chances. On the other hand, when a team is controlling the tempo of the game and occupying the opposition half, shot selection strategies may translate into an attempt to move the ball closer to goal rather than shooting from range. In football there isn’t only one path towards success, so different tactical approaches may yield similar outcomes. For example, in the current season, a notoriously low-block team such as Atlético Madrid (44% field tilt) has a similar non-penalty xG per shot (0.113) as Napoli (0.115), one of the most dominant possession-based teams in Europe at the moment (60% field tilt).
These anecdotal observations got us thinking about average shot quality and its relation with both actual results (wins) and underlying performance indicators (Expected Points).
Soccerment Analytics 2.0 has arrived! It covers 17 leagues and the access to the top 5 leagues is 101% FREE (it is not only free of charge, but free of ads as well!!).
Shot quality and win probability
The first question is: what is the relationship between shot quality and win probability in elite football? Taking a frequentist approach, we can address this question by looking at all matches in the top 5 European leagues from season 2017/18 onward (about 10k matches), dividing the data into bins based on the value of xG per shot recorded by a team, and computing the average percentage of matches won in each group. The result is shown in the bar chart below. The bins are made to contain an equal number of matches, so naturally the outer bins are wider because extreme values are less common.
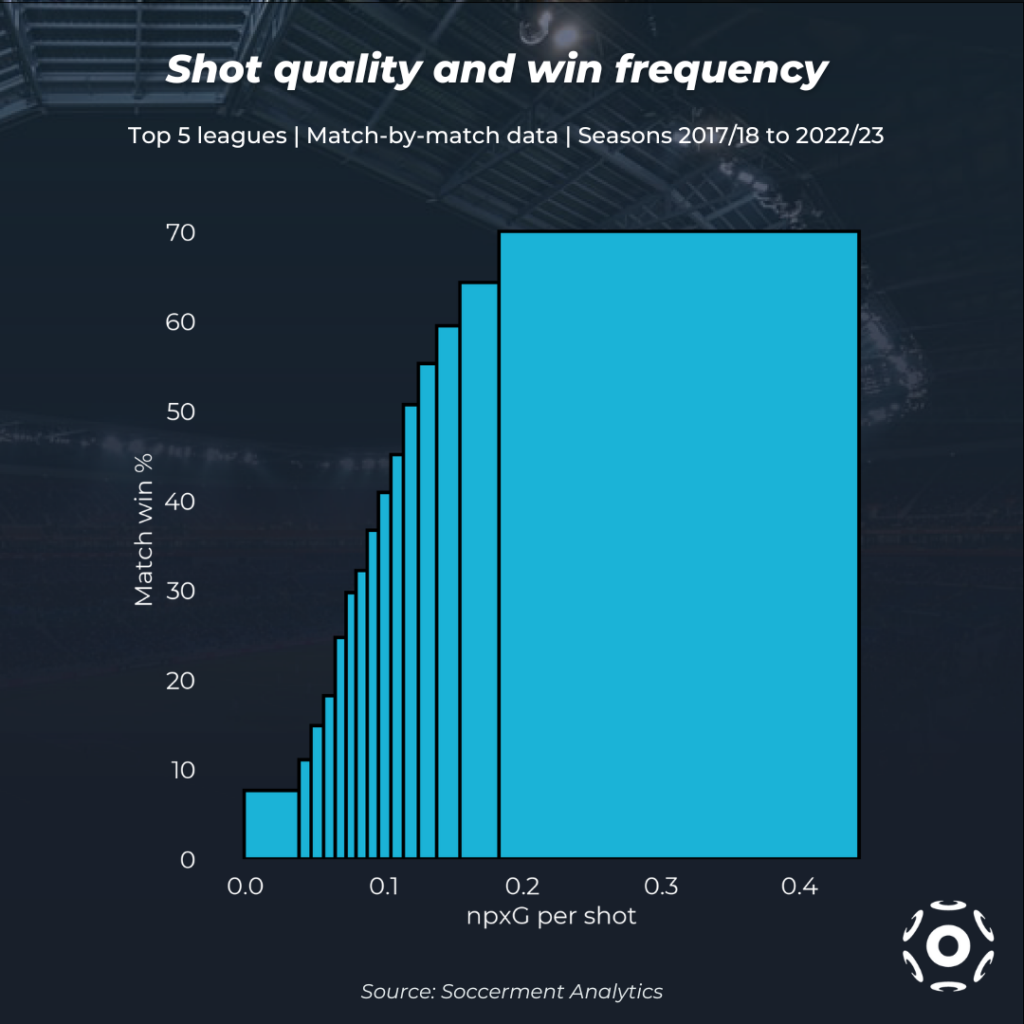
We see that the percentage of matches won increases with xG per shot, so that a value above 0.18 corresponds to a win in 70% of the cases. Naturally, in a football match the result depends also on the performance of the opposing team. That’s why the previous trend is not as clear cut as it could be: if the opponent has an even better shot quality (higher npxG per shot), the result might not be positive. To take this into account, we look at the difference in npxG per shot between the two teams.
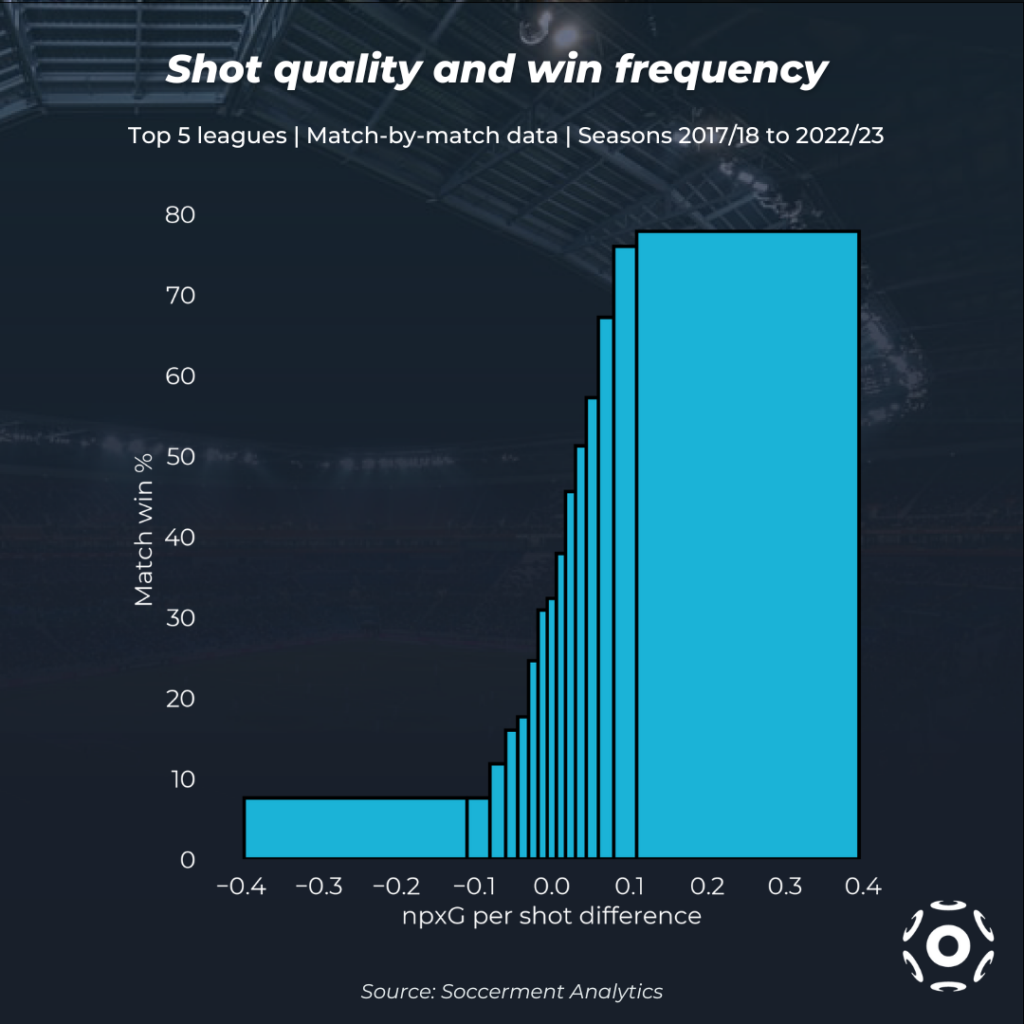
The previous trend is much more evident. Among all matches where a team recorded a non-penalty xG per shot difference greater than 0.05 compared to their opponent, the team won the match in 71% of the cases, while a difference smaller than -0.05 resulted in a win only 10% of the times. While this trend is obviously not the full story, it suggests that the individual matches that brought us to this analysis were not isolated cases, but part of a consistent trend in elite football.
Shot quality and performance indicators
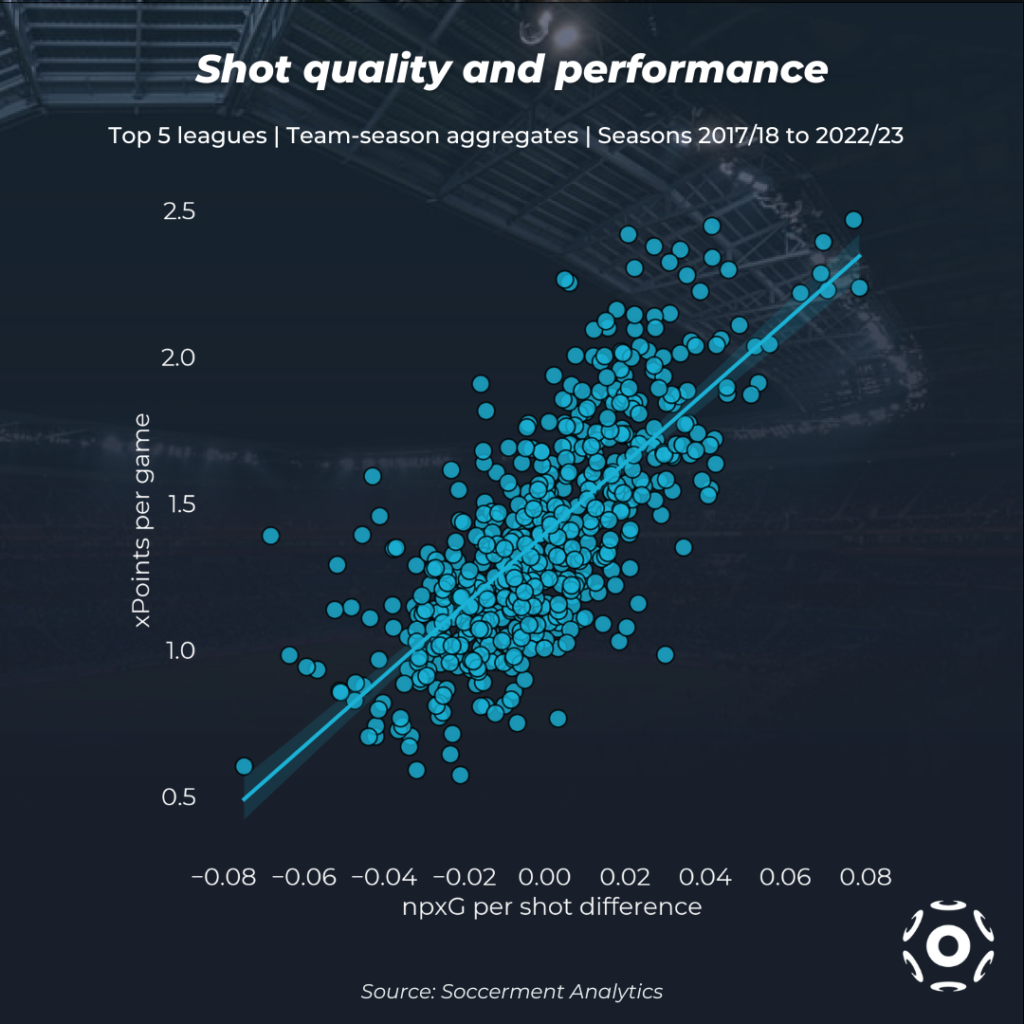
While the trend we just uncovered is already noteworthy, we know that goals and wins are heavily influenced by chance, therefore it would be interesting to analyse the relationship between shot quality and more robust performance indicators based on xG. On an individual match basis, we find for npxG per shot difference an R2 of 0.38 both for xG difference (xG for minus xG against) and Expected Points, which are based on xGD but also account for multiple shots in the same possession. This is already a decent level of correlation, but we can go a step further if we look at season averages for each team, smoothing out the strong variance which is present in individual match stats. The correlation goes up to R2 values of 0.56 and 0.55 for xGD and xPoints, respectively. This result is quite remarkable, implying that more than half of the variation in team performance can be explained with their shot quality relative to their opponents.
The evolution of shot quality
In recent years, the growing exposure of advanced metrics such as xG has led to a gradual adoption of one of its most important insights: the importance of shot selection. We can see this in several indicators, one of which is just the distribution of shot locations. In the following figure, we show a shot density map, which shows how the average goal distance of (non-penalty) shots is slowly but steadily declining in the top 5 European leagues.

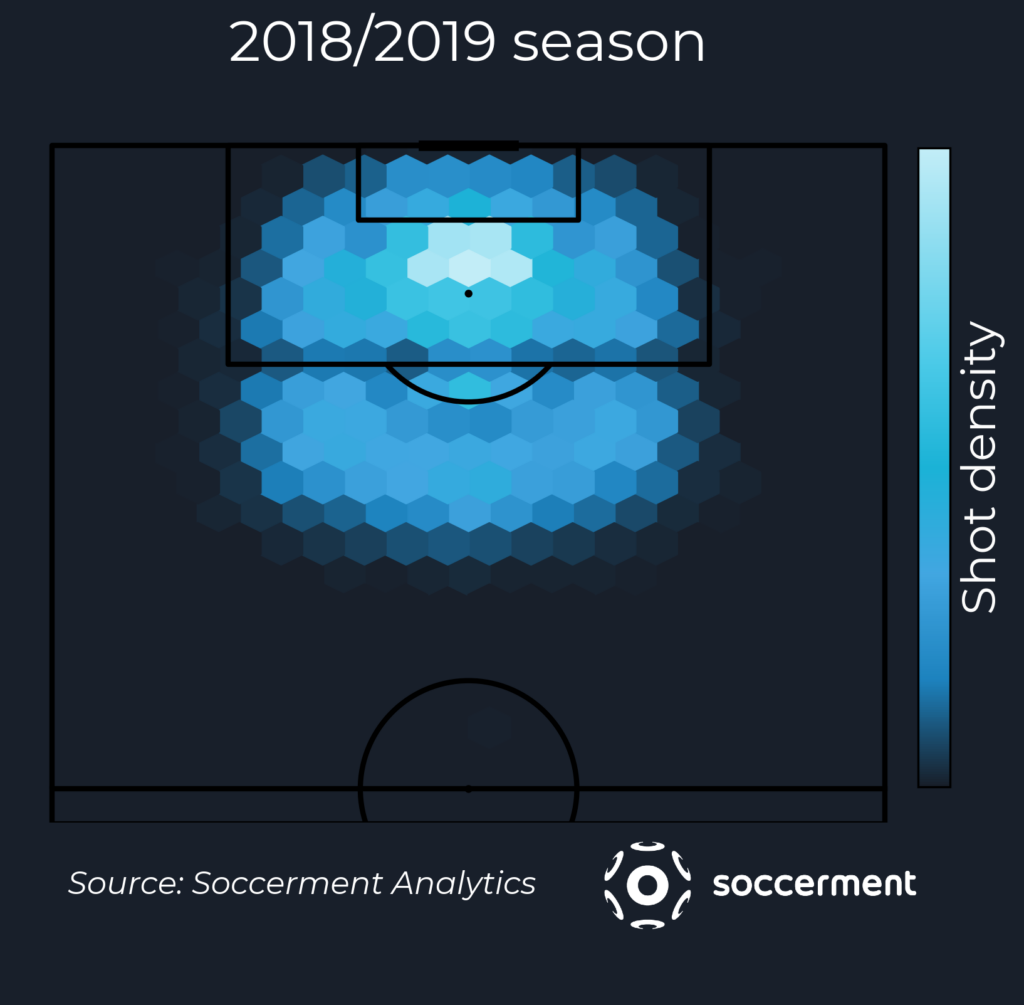

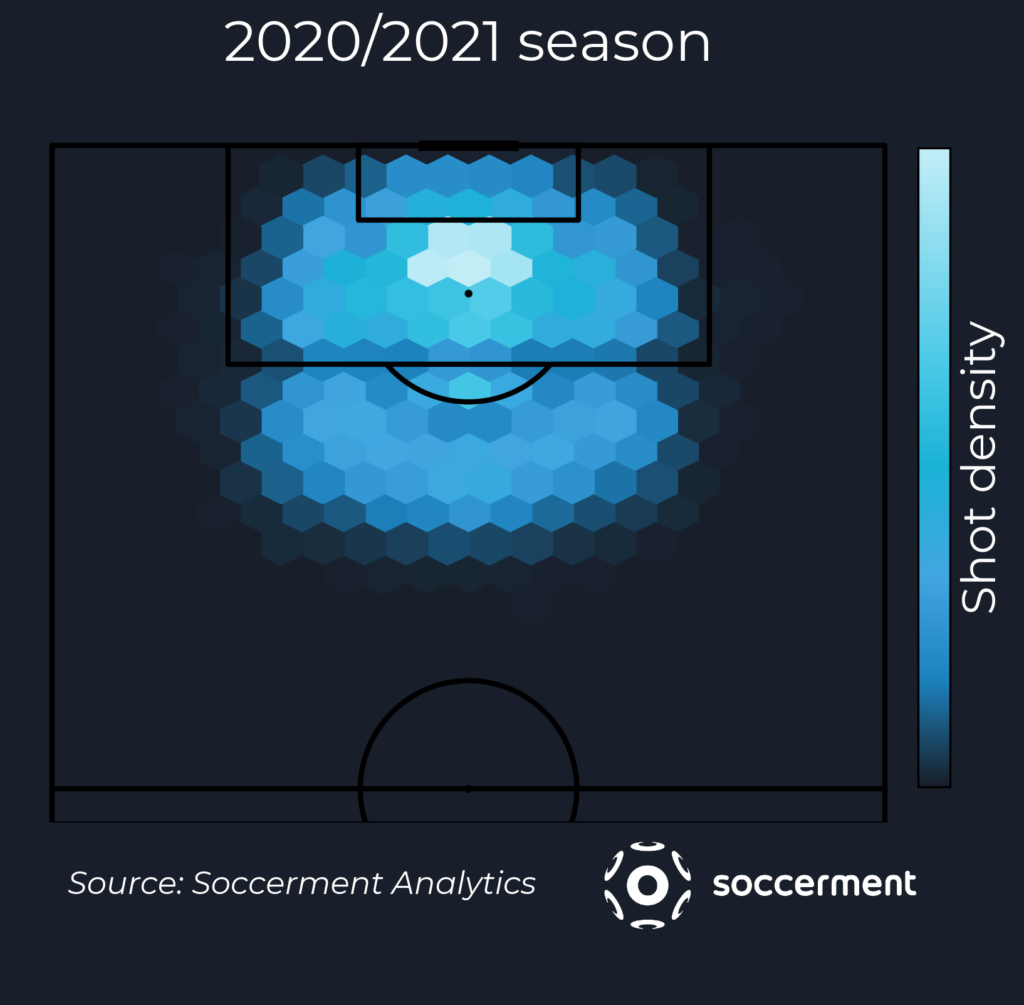
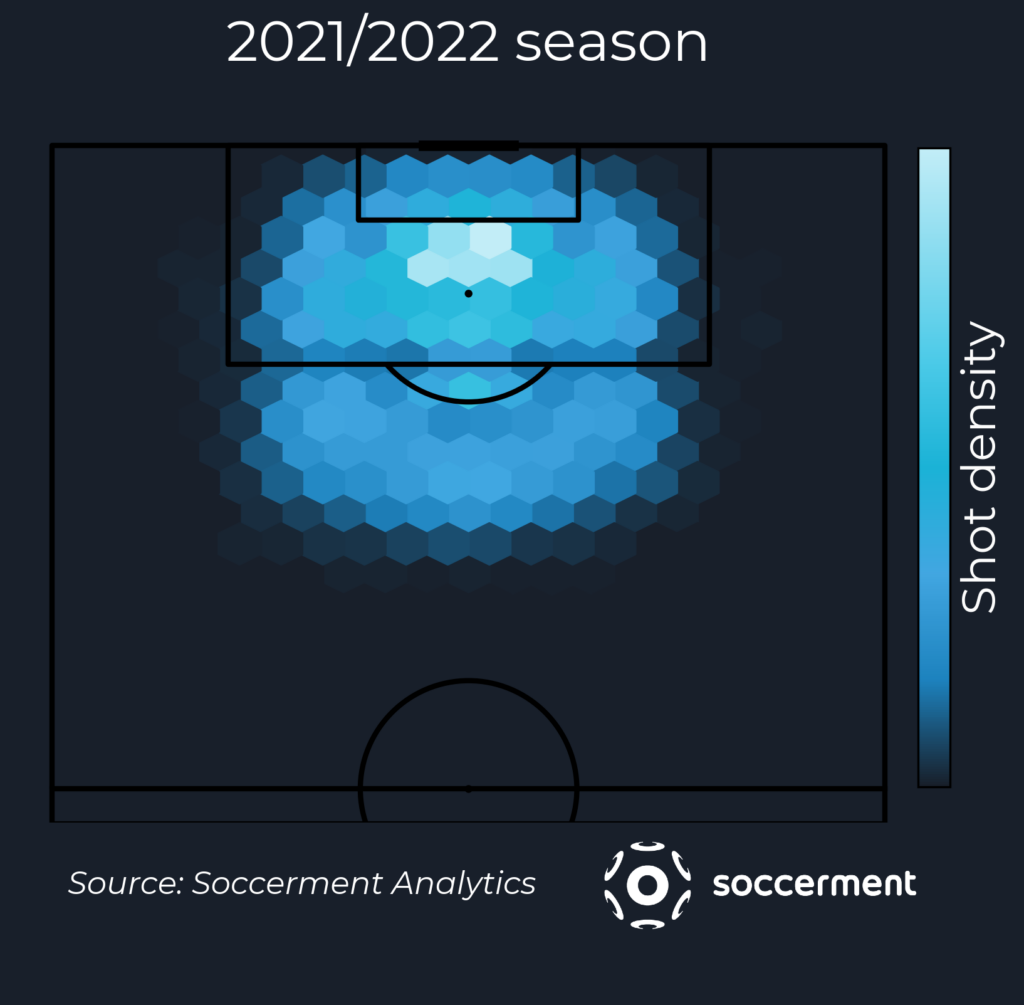
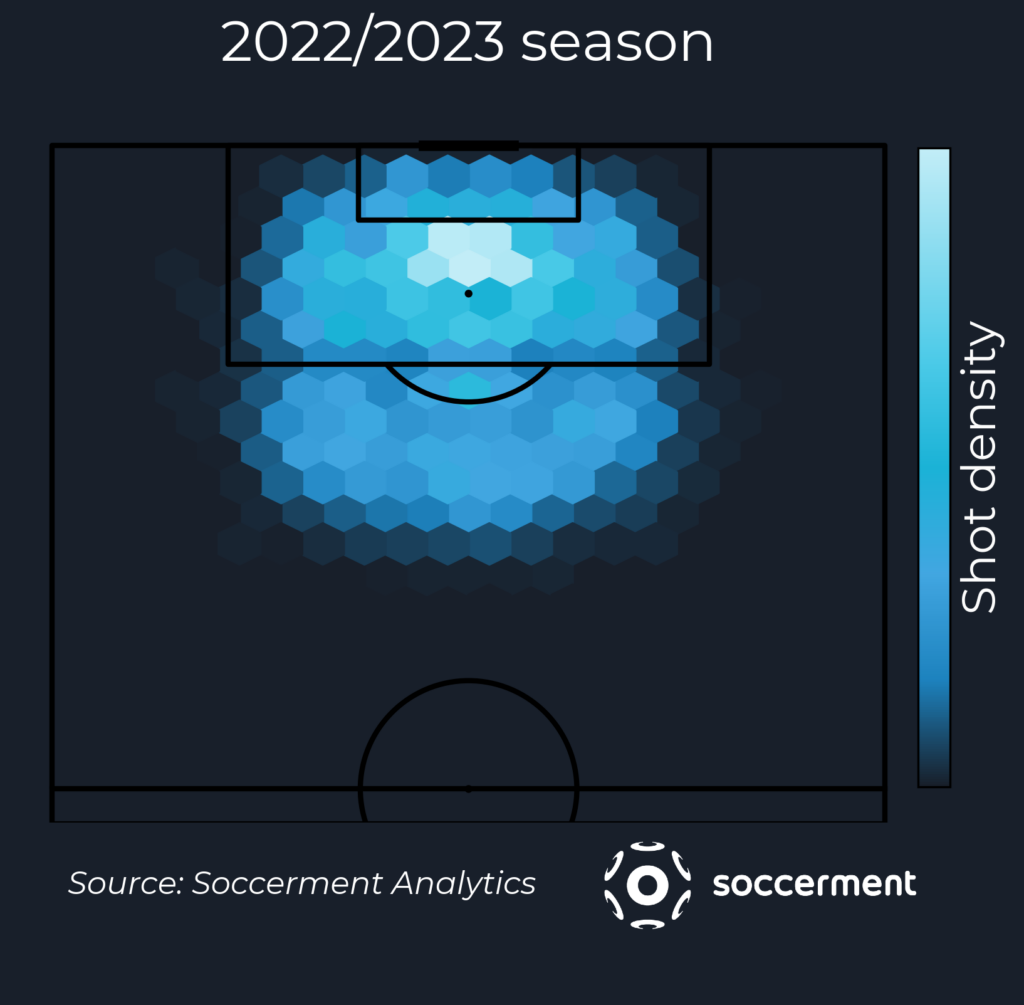
We can see this more explicitly by computing the actual average goal distance of shots in the top 5 European leagues for each season. In spite of some seasonal fluctuations, the general trend is quite clear.
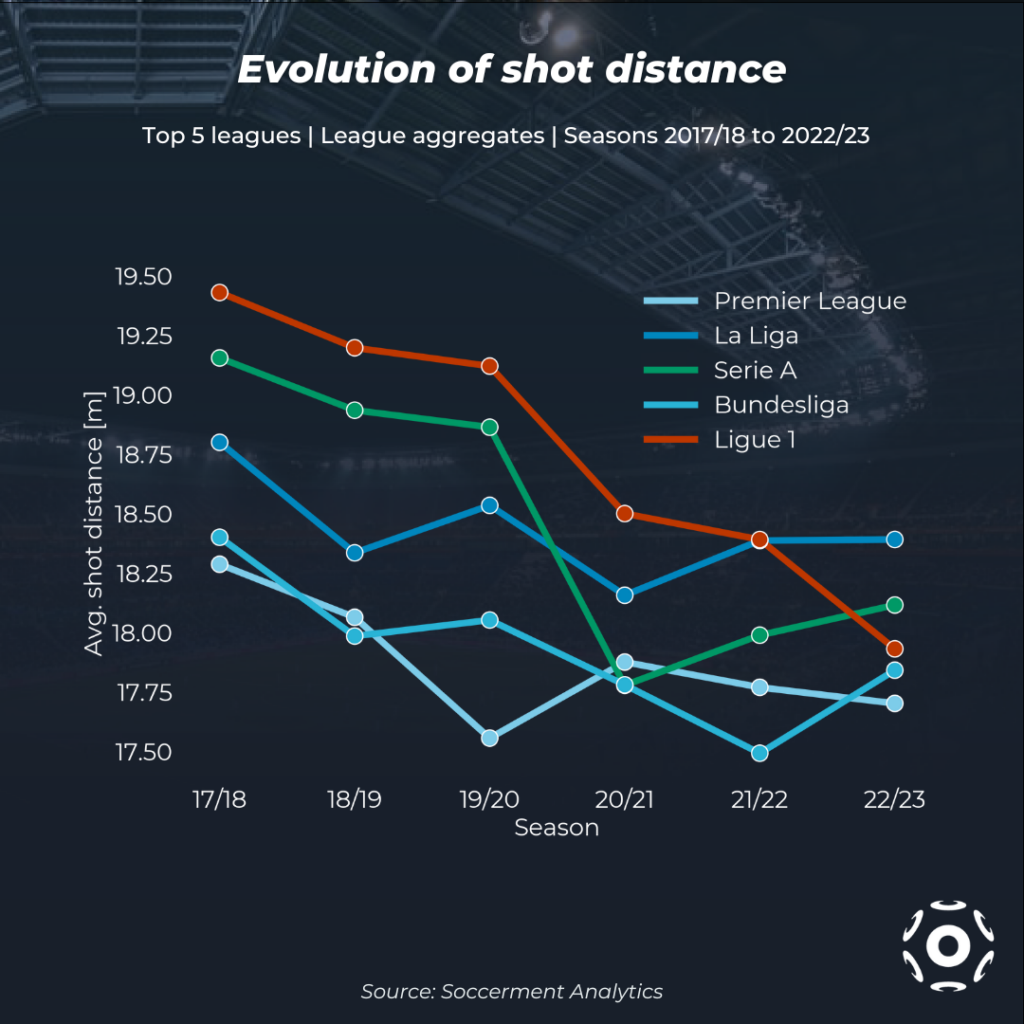
It is interesting that this trend exists despite the fact that many clubs do not in fact use advanced metrics such as xG directly in the analysis of their performance. It would seem, however, that this specific insight concerning shot selection has nevertheless been adopted, perhaps being spearheaded by a few successful clubs that do use advanced metrics in their performance analysis, or maybe simply as a byproduct of modern tactical concepts.
Conclusions
This study started from the observation of several matches where a team was able to win in spite of not having dominated the match, by several indicators (including total xG in some cases). The common thread linking these cases was a higher average npxG per shot for the winning team. We set out to clarify whether this could be part of a relevant trend, or a simple statistical anomaly. We found that there is indeed a link between the average quality of chances created (and conceded) and both actual results (win frequency) and underlying performance (Expected Points). While clearly these results do not even come close to telling the whole story of what it takes to win in football, they represent an interesting step forward in the analysis of match and season performance that goes beyond looking at xG totals.
For any question or comment, please do not hesitate to contact us: research@soccerment.com.
Did you know that…
…we developed a smart device able to track the performances of any football player automatically? It is called XSEED and tracks both the athletic and technical performance:
- Distance covered;
- Maximum speed;
- Accelerations / Decelerations;
- Number of touches;
- Passes;
- Shots & shot power;
- Crosses;
- Soon: Expected Goals & Expected Assists