Categoria: Football Analytics
-

Preview of the Champions League Final: David vs Goliath
We provide an exclusive glimpse into xvalue’s comprehensive Opponent Analysis Report, featuring data from Real Madrid’s and BVB’s 2024 seasons. This report offers a complete overview of the teams’ performance, providing valuable insights for football professionals. Introduction A match-packed 2023/2024 season is finally coming to a close. At Wembley, on Saturday, the most anticipated game…
-

Decoding the Major League Soccer: Rebuilding without illusions – Toronto FC’s comeback?
We provide an exclusive glimpse into xvalue’s comprehensive Opponent Analysis Report, featuring data from Toronto FC’s 2024 season. This report offers a complete overview of the team’s performance, providing valuable insights for football professionals. Club overview: from a poor start to the treble Toronto FC was awarded a spot in the MLS in 2005, however…
-

The data-driven revival of Union Saint-Gilloise in the Jupiler Pro League
Union Saint-Gilloise’s remarkable journey from the lower divisions to the top tier of Belgian football is a testament to the power of data-driven strategies. Leveraging advanced analytics under the ownership of Tony Bloom, USG has transformed their approach, leading to impressive performances and strategic advantages. Explore how data analytics facilitated this transformation and continues to…
-

Decoding Como’s Promotion: Soccerment’s Advanced Metrics in the Spotlight on Sky Sport
Once again, Soccerment’s advanced metrics played a crucial role in unlocking the secrets of a football success story. This time, our insights were prominently featured on Sky Sport. This significant exposure underscores our commitment to delivering top-tier football data analytics that shape the way the game is understood and appreciated. In the latest episode, with…
-

Important Update: New Advanced Data Intelligence Solutions for PROs & AI-Powered Chatbot for Football Fans
We want to share an exciting new chapter in the story of xvalue. Reflecting on our journey, our platform has thrived thanks to the robust support and insightful feedback from our community of football enthusiasts and sports analytics fans. This engagement has not only fueled our growth but has also enriched our offerings. Our collaborations…
-

AIDA – Player Performance Analysis Updates
Today, we’re pleased to introduce our latest updates toxvalue | AIDA, which are set to further refine the accuracy and depth of player performance analysis and comparison. Welcome to the Future of Soccer Analytics Welcome to the future of soccer analytics with AIDA, the AI Data Analyst that’s set to transform the way we perceive…
-

Data-driven scouting for Liverpool: replacing Fabinho
This summer, Liverpool are undergoing a full-fledged revolution in their midfield. The simultaneous departures of Fabinho, Henderson, Milner, Keita and Oxlade-Chamberlain mean that the Reds are seeking to rejuvenate the squad, adding fresh legs able to keep up with Klopp’s demanding play style. The arrivals of Szoboszlai and Mac Allister for a combined fee in…
-

AERO: a new aerial skill metric
In this blog post, we introduce our new Aerial Elo Rating Optimization (AERO) index, a new metric focused on aerial skill. Aerial skill metrics and the case for an Elo rating Aerial duels can be a key event in football on both ends of the pitch, and the relative skill between defenders and forwards in…
-

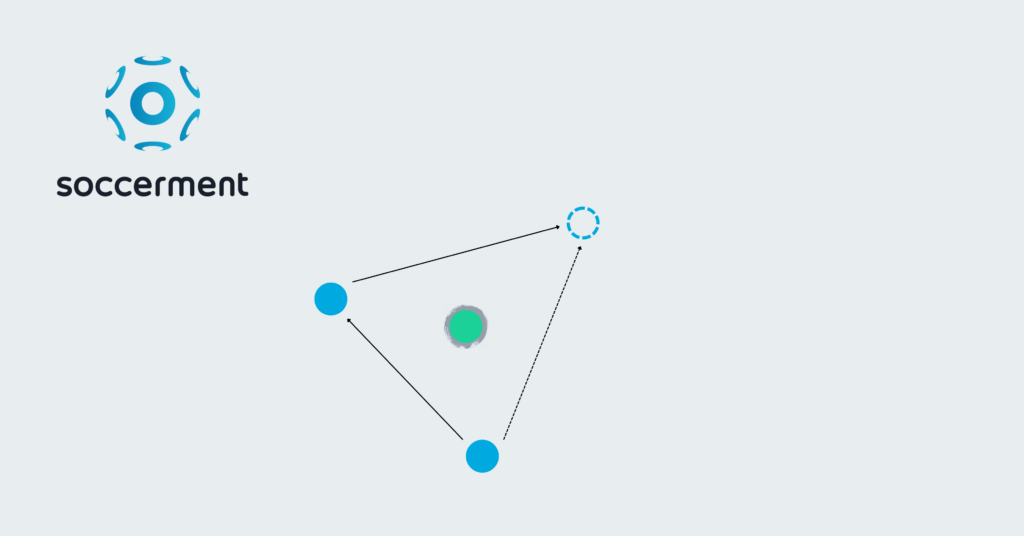
One-twos: a new metric for associative ball progression and chance creation
Ball progression and chance creation are key phases of play in football, which can be achieved in several ways. In this article, we introduce a new metric which quantifies a specific mode of associative ball progression and chance creation: one-twos. We describe our empirical definition of one-two in event data and characterize the resulting data…
-

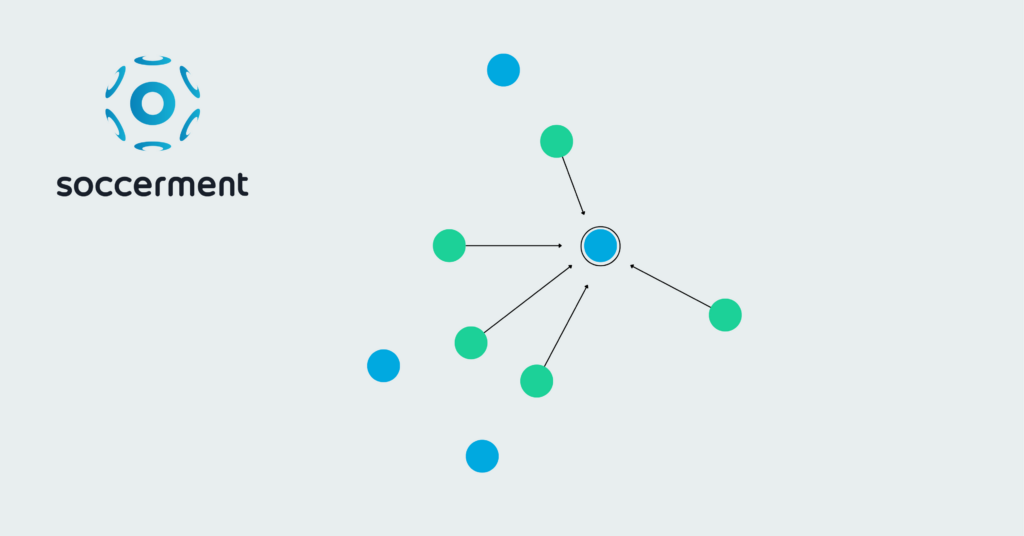
Introducing Gegenpressing Intensity (GPI)
Gegenpressing, or counterpressing, is now a well-established strategy in many possession-based teams. To capture this aspect of the game, we introduce a new metric, called Gegenpressing Intensity (GPI), which measures the fraction of times a team immediately attempts to regain the ball after losing possession in attacking areas, rather than falling back. We find that…
