

Introduction
The 2025 MLS season is underway, and after five rounds, we can begin identifying emerging trends across teams. This in-depth analysis dissects both offensive and defensive performances using key advanced metrics. Through a series of scatter plots, we explore how different teams approach the game-whether it’s through high pressing, ball possession, or efficiency in front of goal. From the dominance of Philadelphia Union to surprising trends from Sporting Kansas City, this report sheds light on which teams are thriving and which need adjustments moving forward.
Key Insights
- Philadelphia Union leads the way – Combining youth development, high pressing, and attacking efficiency, they top the Eastern Conference.
- Inter Miami’s unique dynamic – A high percentage of U-21 minutes but an aging core featuring Messi, Suárez, and Busquets.
- San Diego’s aggressive possession play – Highest Field Tilt (70%), keeping opponents pinned in their half.
- Orlando City’s offensive firepower – Leading in non-penalty Expected Goals (npxG) per 90 minutes.
- Austin FC’s defensive solidity – Best defensive performance in terms of Expected Goals Against (xGA) per 90 minutes.
- Sporting Kansas City’s pressing paradox – High pressing intensity but struggling in the standings.
- Houston Dynamo & St. Louis City SC at the bottom for ball recovery – Lowest GPI and GPE values.
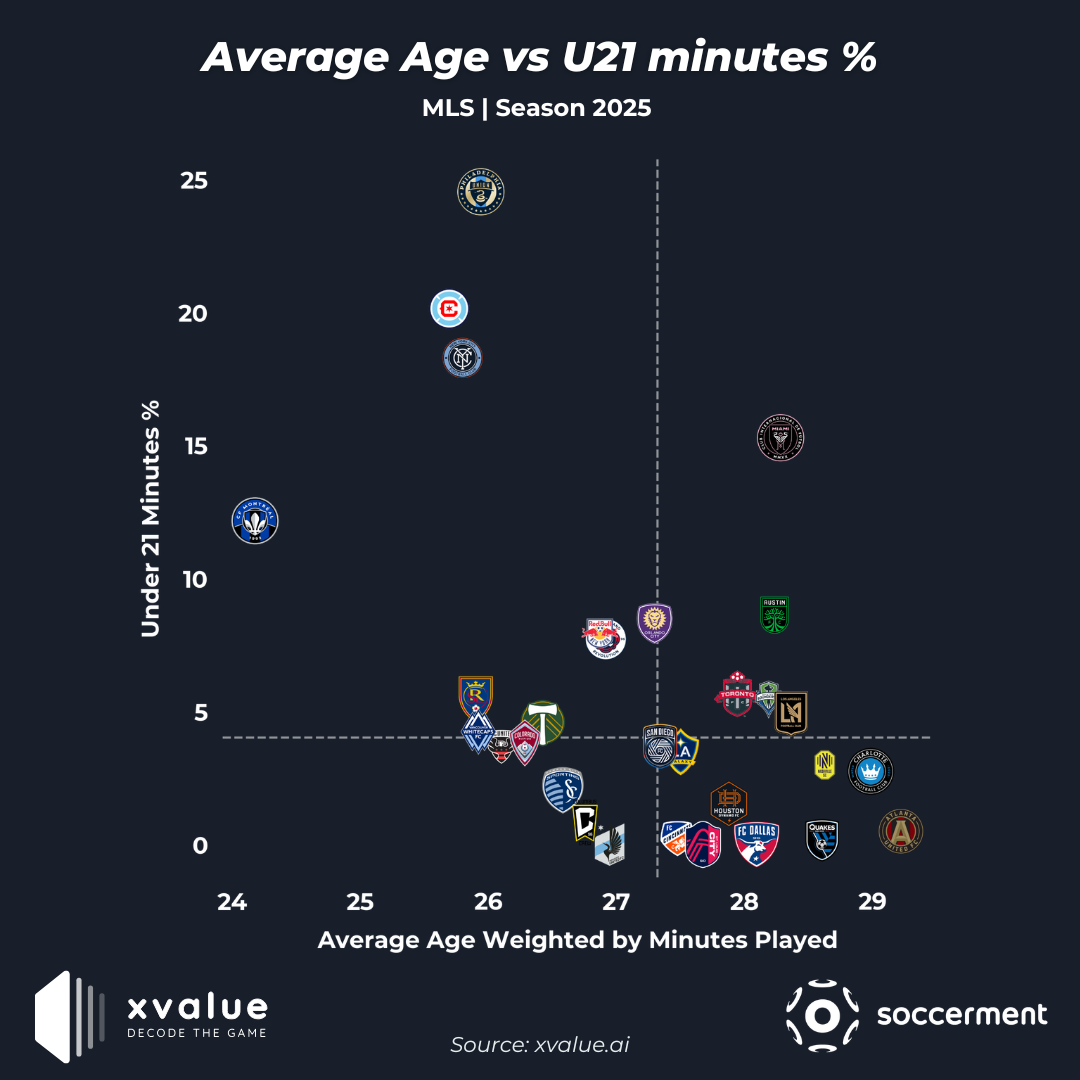
Squad Composition: Average Age vs. Under 21 Minutes Percentage
A broad look at the league’s age distribution highlights a trend toward experienced squads, with most teams averaging between 26 and 29 years old. Atlanta United stands out as the oldest team, with an average age surpassing 29 years and one of the lowest percentages of U-21 minutes. After five matches, they sit 12th in the Eastern Conference.
At the opposite end, CF Montréal emerges as the youngest squad, averaging just over 24 years, though currently positioned last in the East. A notable outlier is Philadelphia Union, leading the East while boasting the highest U-21 minutes share and an average squad age just below 26 years. Over in the West, table-toppers Vancouver Whitecaps FC also stand among the younger teams, with an average age near 26 and a U-21 utilization rate just under 5%.
A fascinating case is Inter Miami, which balances a high U-21 utilization rate (15%) with a squad skewed older due to stars like Messi, Suárez, Jordi Alba, and Sergio Busquets.
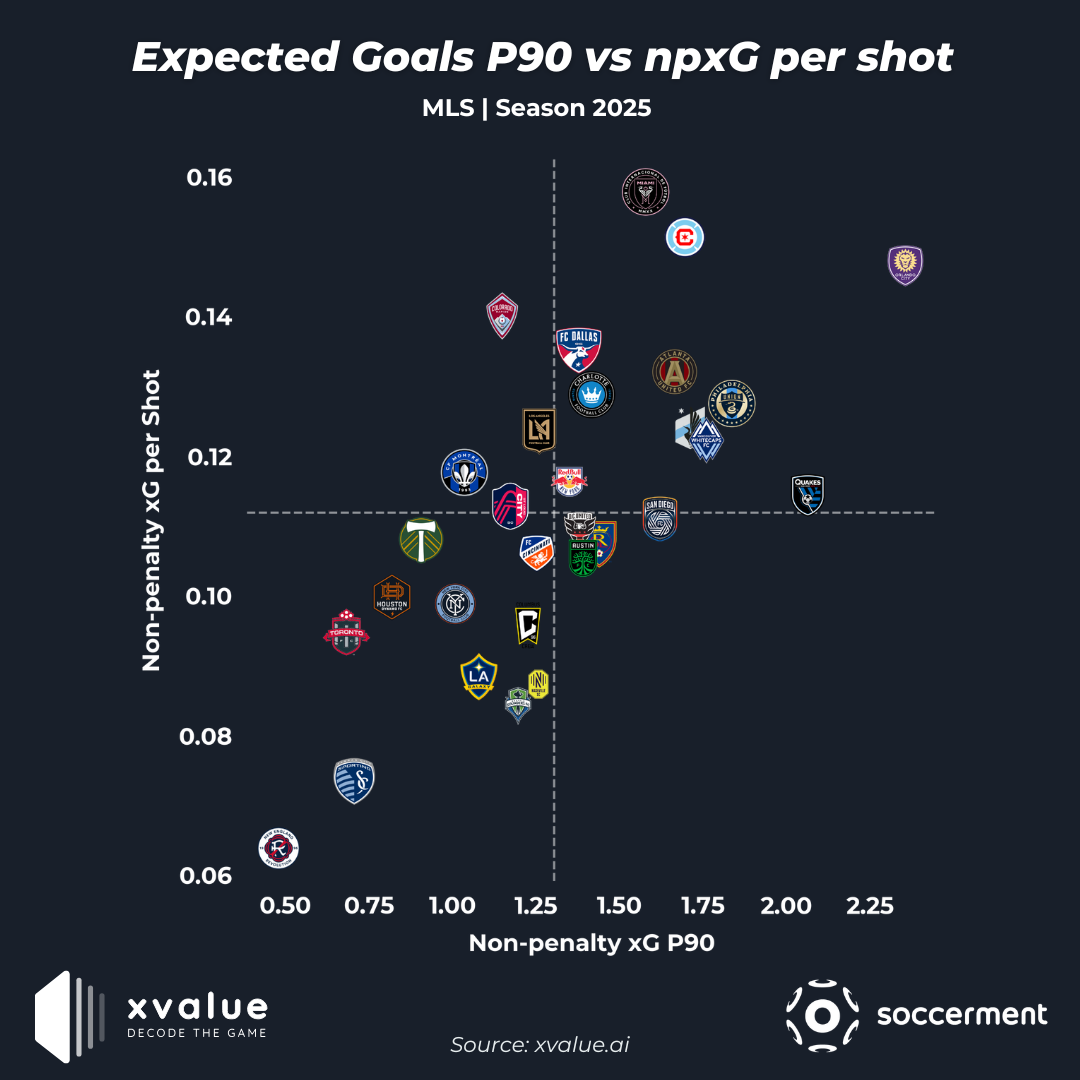
Offensive Performance: Expected Goals P90 vs. npxG per Shot
Transitioning to the attacking phase, our first scatter plot examines non-penalty expected goals (npxG) per 90 minutes and npxG per shot.
Orlando City, currently 9th in the East, leads in npxG per 90 with a strong 2.25, followed closely by San Jose Earthquakes at just over 2.00, despite sitting 10th in the West.
When assessing shot quality, Inter Miami tops the charts with an impressive 0.16 xG per shot, followed by Chicago Fire FC (5th in the East) at 0.15. Orlando City reappears among the best, reinforcing their offensive efficiency.
Conversely, New England Revolution struggles at the bottom for both metrics. Their npxG per shot hovers just above 0.06, while their npxG per 90 remains a mere 0.50. They currently rank third from last in the Eastern Conference.
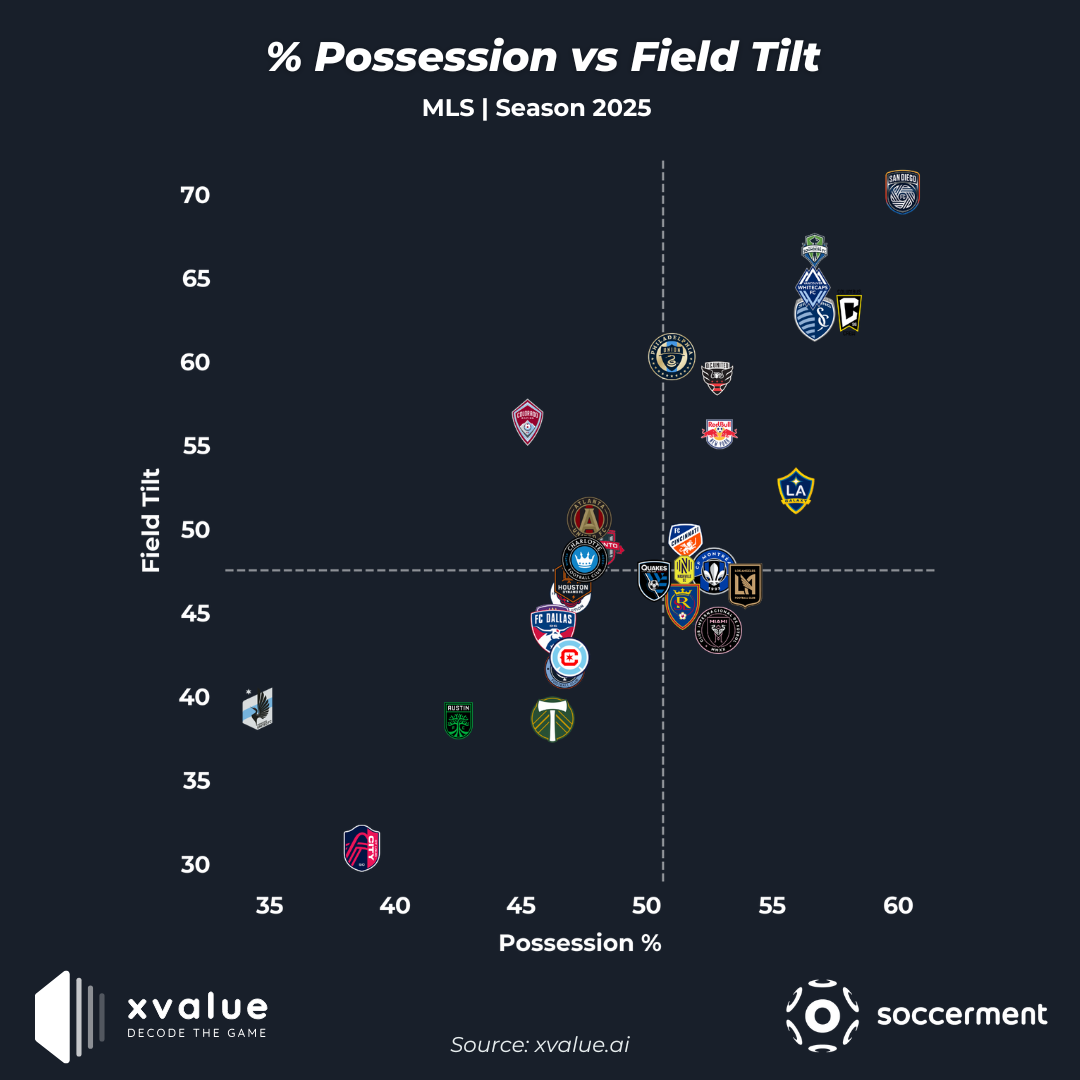
Possession Strategy: Possession Percentage vs. Field Tilt
Examining ball dominance and territorial control, five teams exceed a 60% Field Tilt, reflecting their tendency to control play in the opposition’s half. These teams also maintain over 55% possession.
Leading the way is San Diego, controlling nearly 60% possession and achieving a 70% Field Tilt, demonstrating their territorial superiority as they sit 4th in the West. Columbus Crew, MLS champions two seasons ago and currently 6th in the East, follow with 57% possession. Meanwhile, Seattle Sounders FC claim the second-highest Field Tilt (66%).
At the lower end, Minnesota United FC registers the lowest possession percentage, while St. Louis City SC ranks last in Field Tilt. Despite their more passive approach, these teams hold respectable positions-6th and 5th in the West, respectively.
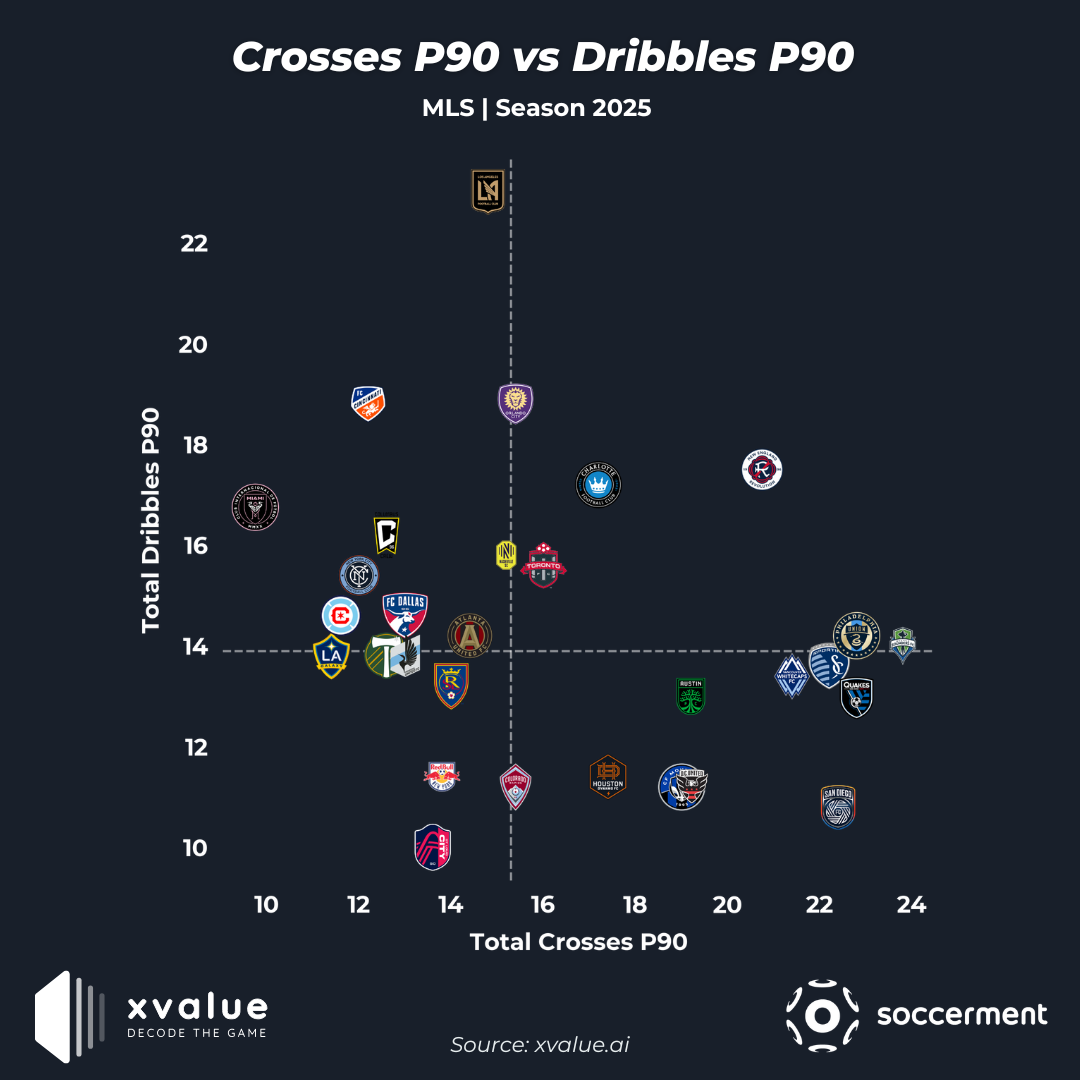
Attacking Style: Crosses P90 vs. Dribbles P90
Analyzing offensive strategies through crossing frequency and dribbling attempts, Los Angeles FC leads in dribbles with over 23 per match. At the opposite end, St. Louis City SC attempts just 10 dribbles per 90.
Crossing tendencies vary significantly. Seattle Sounders FC leading at 23.80 crosses per 90 minutes, followed by Philadelphia Union at 22.80.
Inter Miami, in contrast, ranks last in crossing frequency, attempting just 10 crosses per match.
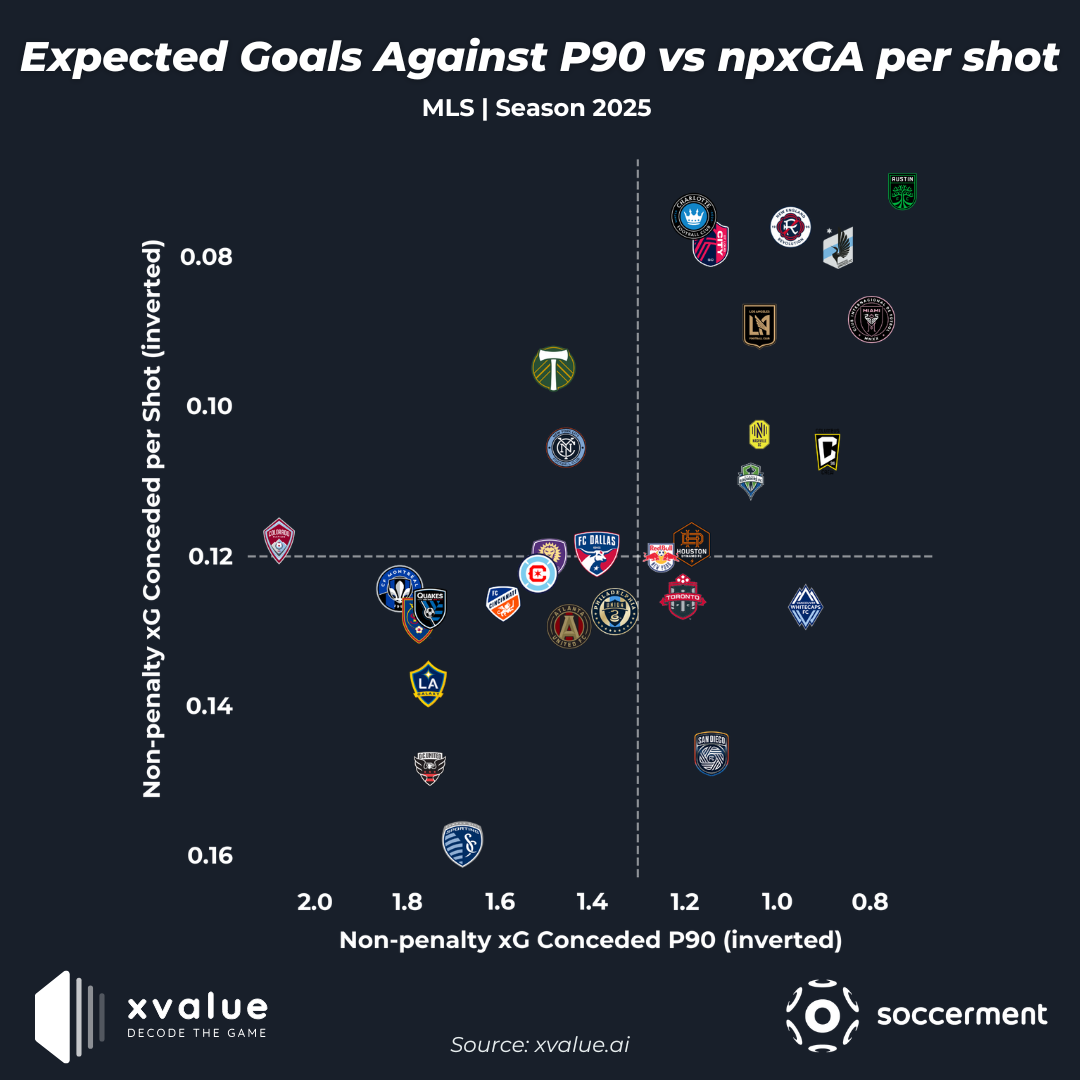
Defensive Metrics: Expected Goals Against P90 vs. npxGA per Shot
Switching to defensive resilience, Austin FC, second in the Western Conference, ranks as the most effective team in both npxGA per 90 (0.73) and npxGA per shot (0.07), thanks to an organized and efficient backline.
At the other extreme, Colorado Rapids concedes the most npxGA per 90 (2.08), while Sporting Kansas City allows the highest xGA per shot (0.16). Despite their defensive struggles, Colorado Rapids manage to stay 7th in the West, balancing weaknesses at the back with offensive efficiency. Sporting Kansas City, however, sits last in the conference.
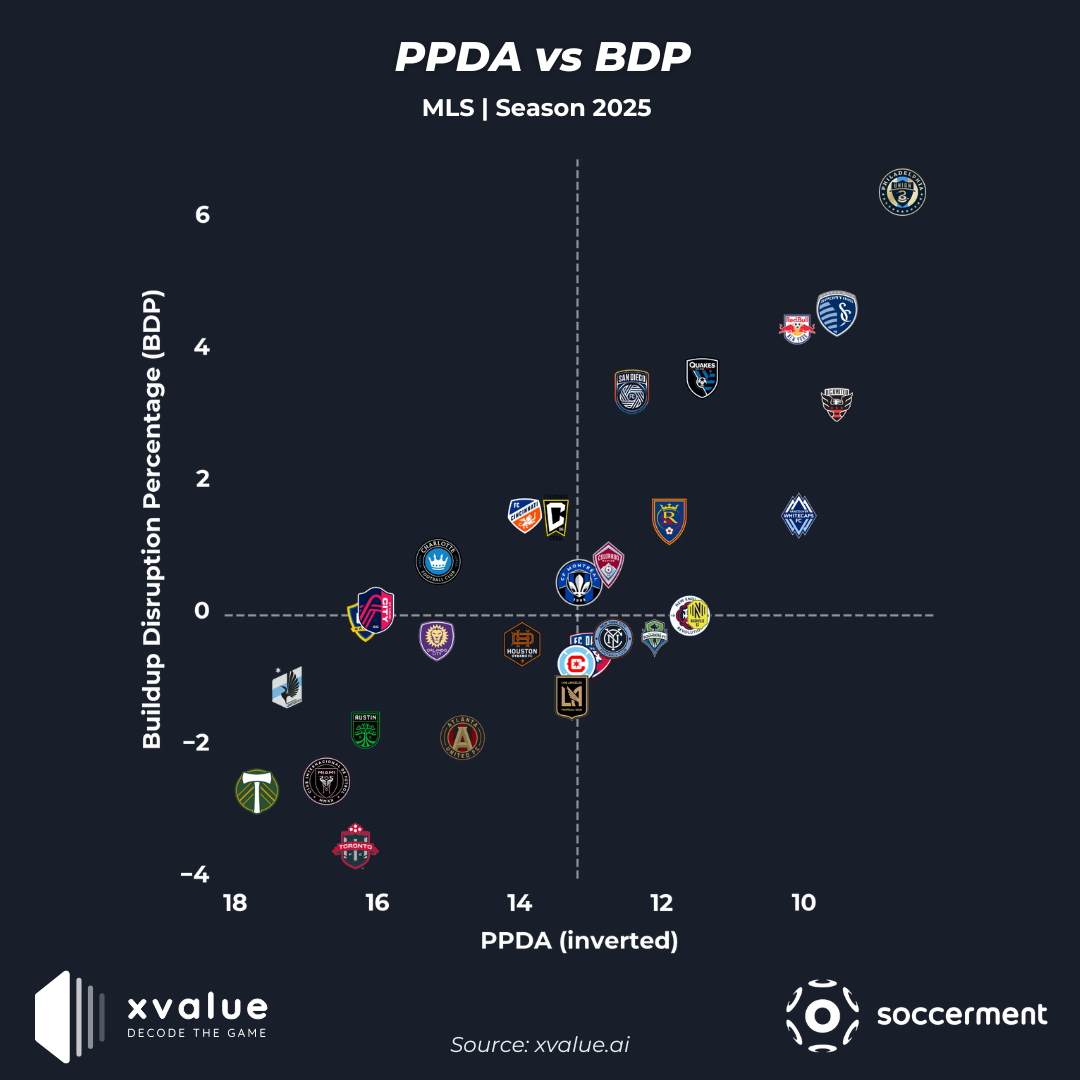
Pressing Intensity: PPDA vs. BDP
To assess pressing style, we compare Passes Per Defensive Action (PPDA) and Buildup Disruption Percentage (BDP).
Philadelphia Union tops both categories, boasting an aggressive press with a PPDA of 8.62 and BDP of 6.33, a major factor behind their dominance in the East. Sporting Kansas City, despite ranking second in these metrics, languishes at the bottom of the Western Conference. Their high pressing values (PPDA: 9.54, BDP: 4.49) suggest an aggressive approach, but it has yet to translate into results.
At the other end, Portland Timbers adopt the most conservative pressing style, registering the highest PPDA (17.70). They currently rank 9th in the West. Toronto FC records the lowest BDP (-3.58), with Inter Miami also among the least aggressive pressing teams (PPDA: 16.72, BDP: -2.60).
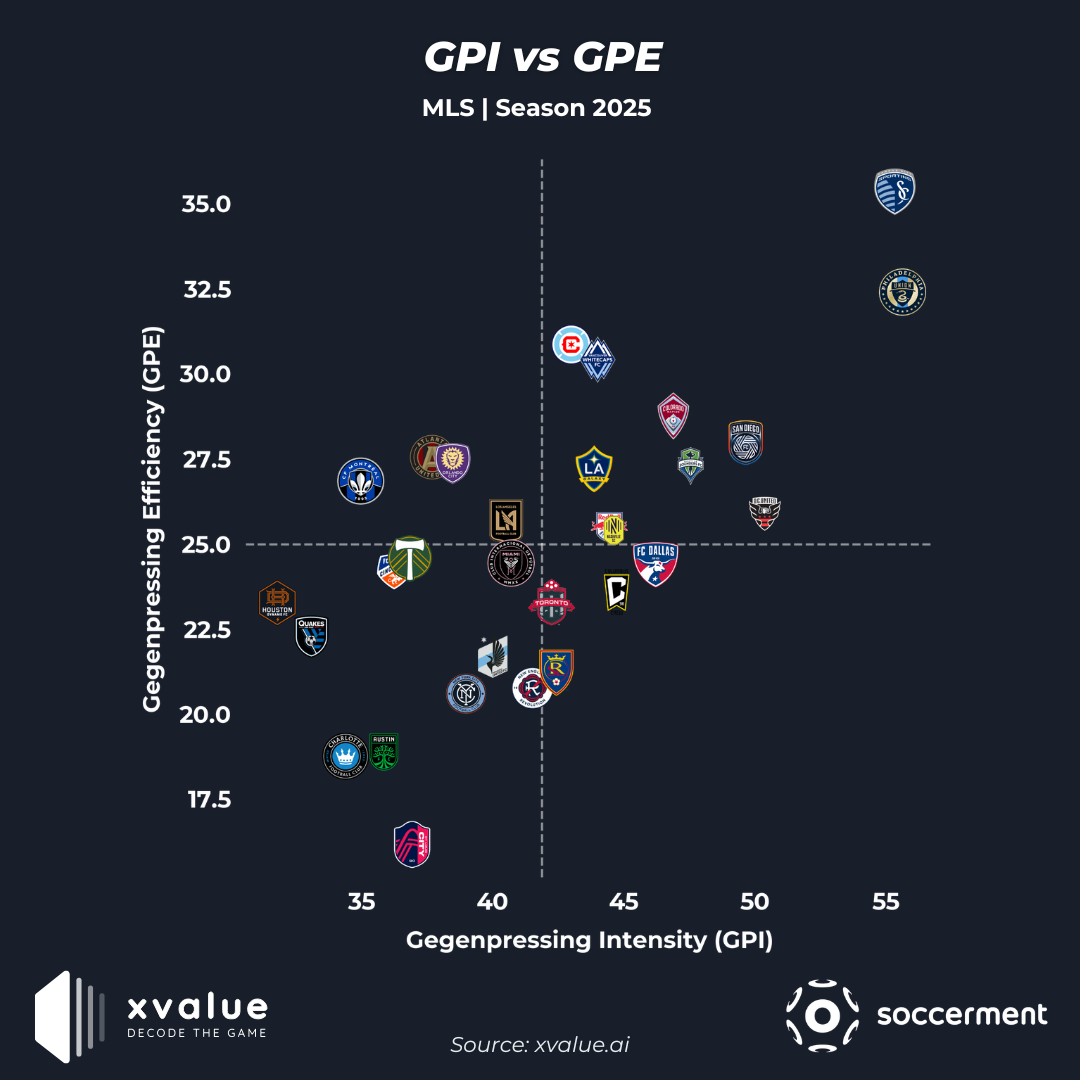
Counterpressure Effectiveness: GPI vs. GPE
Lastly, we evaluate counterpressure efficiency through Gegenpressing Intensity (GPI) and Gegenpressing Efficiency (GPE).
Once again, Philadelphia Union prove dominant, leading GPI (55.63%) and ranking second in GPE (32.39%). Sporting Kansas City, despite their poor league position, tops GPE (35.33%) while maintaining a high GPI (55.33%).
At the bottom, Houston Dynamo FC records the lowest GPI (31.78%), whereas St. Louis City SC ranks last in GPE (16.15%).
Final Thoughts
The first five rounds of MLS 2025 have revealed intriguing insights into team playing styles and efficiencies. Philadelphia Union’s high-pressing, youth-driven squad is proving to be a dominant force in the East, while Austin FC’s defensive solidity is driving their success in the West. Sporting Kansas City, despite ranking high in pressing and counterpressing metrics, struggles to convert their aggressive play into positive results.
As the season progresses, these trends will evolve, shaping the competitive landscape of the league. Stay tuned for more data-driven insights in our upcoming editions!
Thanks!
Learn more about xvalue, the go-to analytics platform for scouting and match analysis 👉🏻 xvalue.ai
Stay tuned and don’t miss out on the latest updates and insights from Soccerment!
Lascia un commento