
Ball progression and chance creation are key phases of play in football, which can be achieved in several ways. In this article, we introduce a new metric which quantifies a specific mode of associative ball progression and chance creation: one-twos. We describe our empirical definition of one-two in event data and characterize the resulting data set. We find that one-twos are a valuable action in terms of primary and secondary chance creation, as it leads to key passes with a significantly higher rate compared to generic passes. We then present the one-twos rankings at the league, team and player level in the top five European leagues. Finally, we discuss how one-twos relate to the main advanced metrics and to our player functions model.

What are one-twos?
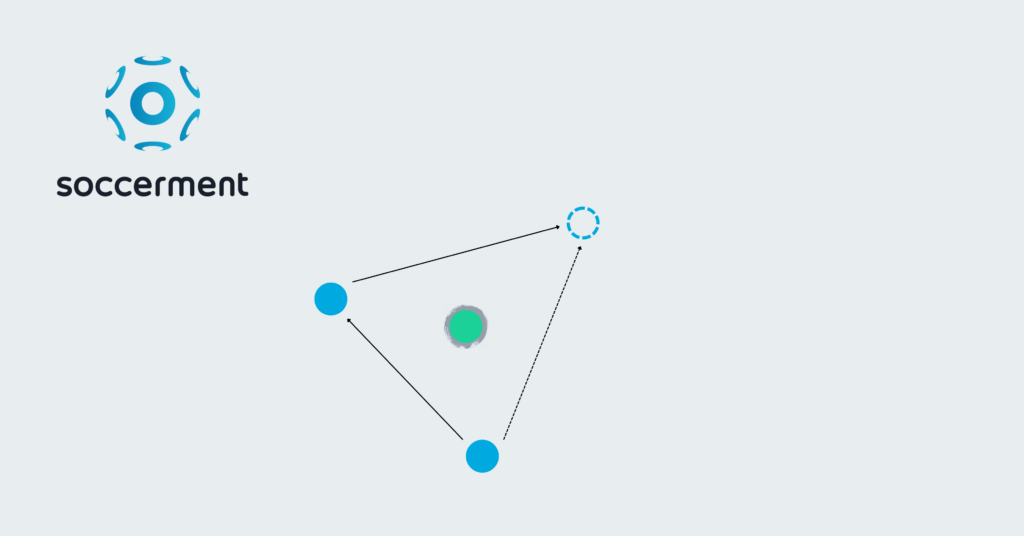
Ball progression and chance creation are key phases of play in football, and can be achieved in many different ways, be it short, patient passing or direct long balls. In the past few weeks, we have tried to quantify a specific event related to these phases of play: one-twos. This is a combination between two players where the first player (who opens the one-two) exchanges the ball with a teammate (who closes the one-two) while gaining ground with off-ball movement in between the two passes. The key element that distinguishes this action from other ways to progress the ball up the pitch is that it requires a higher level of coordination between the two players, and a better capacity to read and react to each other’s intentions and movements.
Here are two examples, one involving Lionel Messi and Kylian Mbappé, and one involving Napoli’s Zielinski and Zambo Anguissa.
How do we define one-twos in our data?
How can we detect this kind of action in event data? The basic idea is quite simple: we select all open-play completed passes that are followed by another completed pass of the same team, received by the same player who made the first pass. However, this is not sufficient, as it would include many trivial passes between defenders, for example. To recover true one-twos in a tactical sense, we first apply a progression threshold and a temporal threshold. We consider only those exchanges where the progression between the start coordinates of the first pass and the end coordinates of the second pass bring the initiating player closer to either the center of the goal or the goal line by at least 25%. At the same time, we require that no more than four seconds pass between the first and the second pass to tag the event as one-two. Finally, to further isolate one-twos as events where the second player is mostly static, and simply assists the progression of the first player, we discard all events where the carry distance between the end of the first pass and the start of the second is longer than five meters.
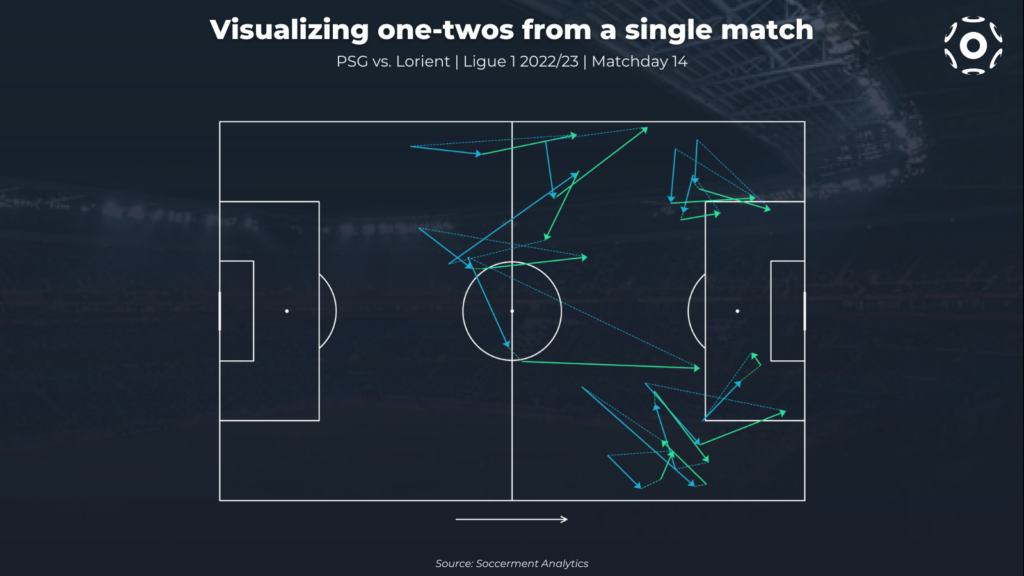
Here is how individual events look like in a single match (the one with the most one-twos by a single team so far this season in the top 5 leagues), where the blue and green arrows represent the first and second pass, respectively, and the dotted lines represent the movement of the respective player in between the passes.
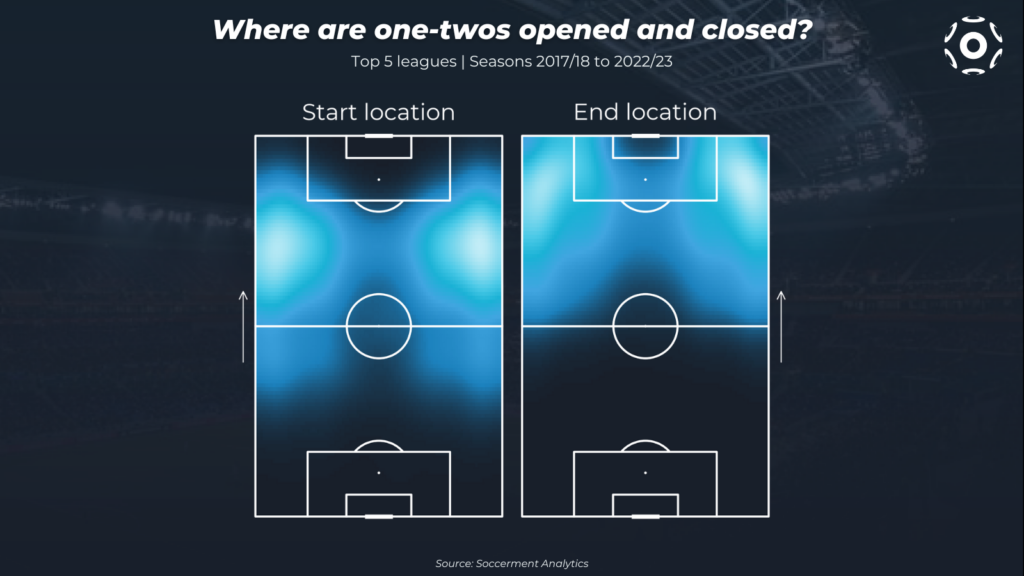
It is also interesting to have a look at the locations on the pitch where one-twos are opened and closed in the top 5 European leagues for the past six seasons. In the following heatmaps we see that, although we did not set any filter on the lateral position of these events, one-twos naturally occur most often on the wings, where they are most typically used to enter the attacking third.
We can get further insight into how one-twos relate to chance creation and threat creation in attacking areas by comparing the rate of key passes (i.e. passes leading to shot) of one-two closing passes and all open-play passes, as well as the following events, limiting the sample to one-twos and passes starting in the final third. We find 2.8% of one-two closings are key passes, compared to 1.5% for all passes, while the event following a one-two closing is a key pass in 11.7% of the cases, compared to 5.8% for events following a generic pass. We can also focus this kind of reasoning on one of the most efficient chance-creating passes: the cutback. We find that 0.18% of one-two closings are cutback key passes, compared to 0.09% for open-play passes, while the event following a one-two closing is a cutback key pass in 0.27% of the cases, compared to 0.04% for events following a generic pass. This suggests that one-twos are a valuable action type in terms of both primary and secondary chance creation, compared to generic passes.
League, team and player ranks
Let’s take a look at some rankings for this new metric across several aggregation levels, for the top five European leagues.
League-level data
Starting from the broader grouping, we collected the average number of one-twos per game in each league across the last six seasons.
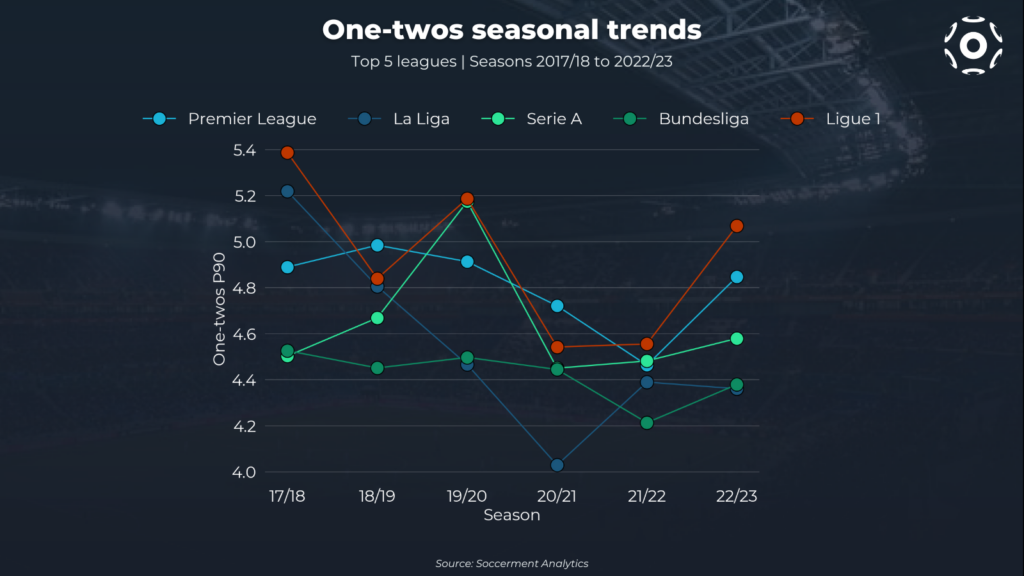
We can see the number of one-twos slowly going down in all leagues as of season 2021/22, while it’s still unclear if the current season might signal the start of a growing trend. If we take the total average per league, Ligue 1 has the highest value with 4.90 one-twos P90, followed by the Premier League with 4.80, Serie A with 4.64, La Liga with 4.56 and finally the Bundesliga with 4.42.
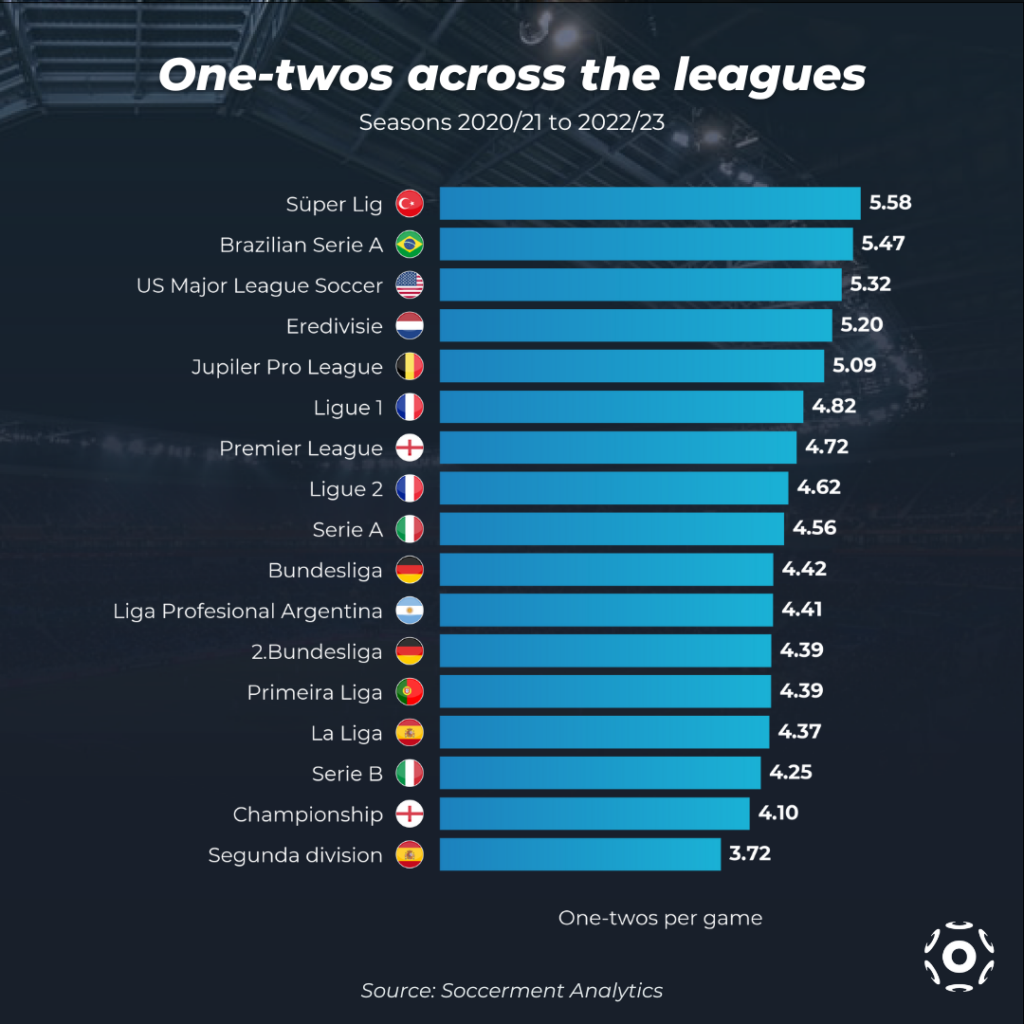
It is also interesting to have a look beyond the top 5 European leagues, in terms of average number of one-twos per game. We find that the top 5 leagues do not rank at the top for this metric among the leagues covered in our data. It is especially interesting to note that a league such as the Brazilian Serie A ranks 2nd, which is consistent with the stronger focus on a more relational play, as opposed to the stricter positional play which is hegemonic in Europe at the moment.
Team-level data
Let’s go one level deeper and look at the teams who use one-twos the most for ball progression, both across the past six seasons and during the current one. Here we show the top 20 teams for one-twos P90, for both cases.
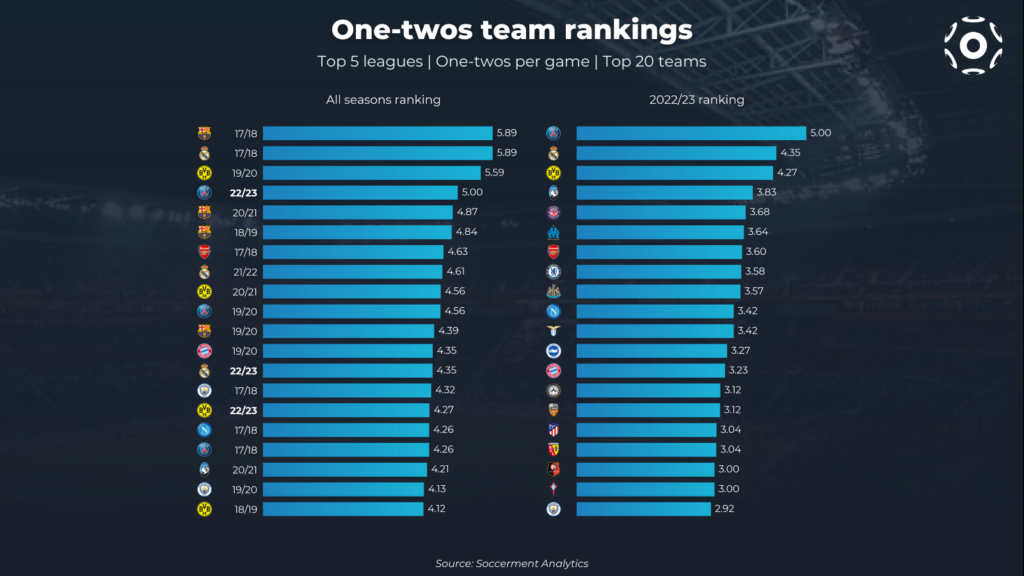
The all-seasons ranking is dominated by 2017/18 Barcelona and Real Madrid, tied at 5.89 one-twos P90. The Blaugrana are the most frequent team in the historical top 20, together with Borussia Dortmund, however they do not figure in the top20 for the current season, which sees PSG stand out by a wide margin with 5.0 one-twos P90, ahead of Real Madrid and BVB. We can also take a different view and look at a more style-based ranking, normalizing by total passes, to correct for biases related to possession percentage.
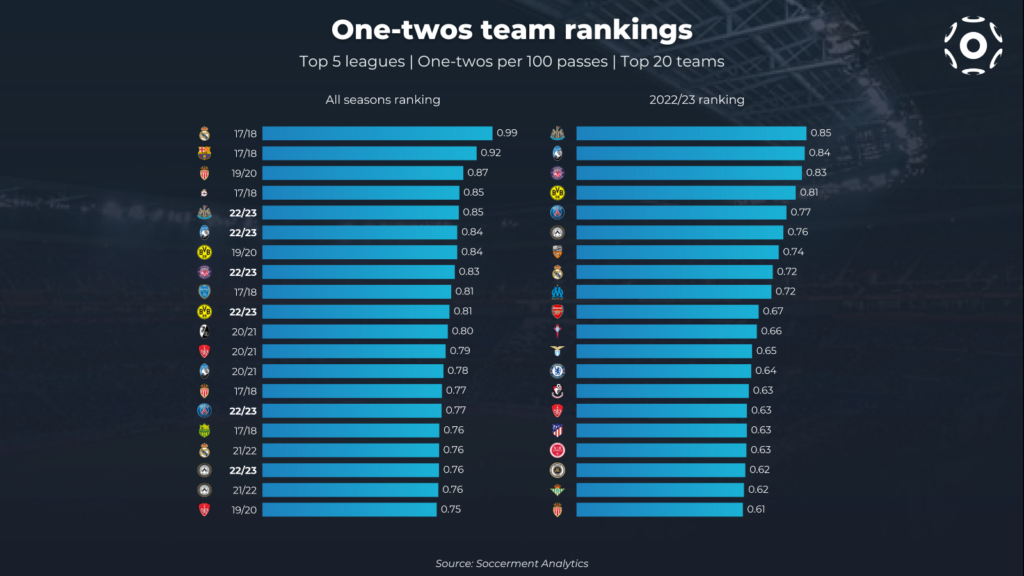
The historical ranking is more leveled in this case, even though it is still topped by 2017/18 Real Madrid and Barcelona, with the Blancos edging the rivals at 0.99 one-twos per 100 passes. As for the current season, we have a tight top-three group with Newcastle, Atalanta and Toulouse.
We can use our Expected Threat grid model to assign a value to each one-two, considering its start (origin of first pass) and end (final position of second pass). Within this framework, we can rank all teams in the top 5 leagues for 2022/23, normalizing xT from one-twos per game as well as per 100 one-twos made.
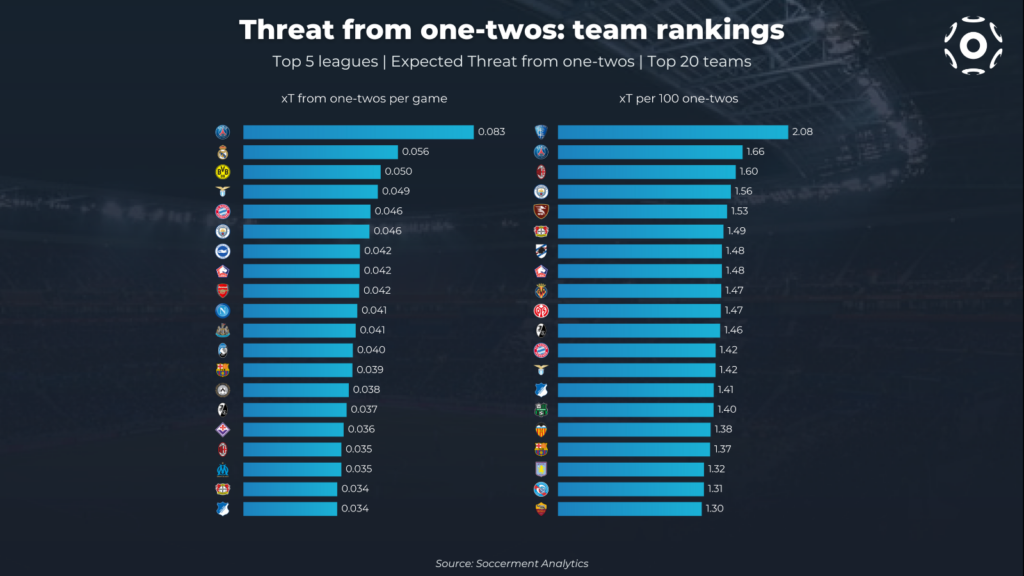
PSG top the P90 ranking by a wide margin with 0.083 xT from one-twos per game, while Serie A mid-table side Empoli are the most efficient, with 2.08 xT per 100 one-twos made.
Player-level data
Continuing our journey down the football pyramid, we can have a look at player rankings. In this case, we can count both one-twos opened and one-twos closed, since two players are involved in each event. Here is the historical top 20 ranking over the past six seasons, for players with at least 270 minutes played in each season, normalized per 90 minutes (P90).
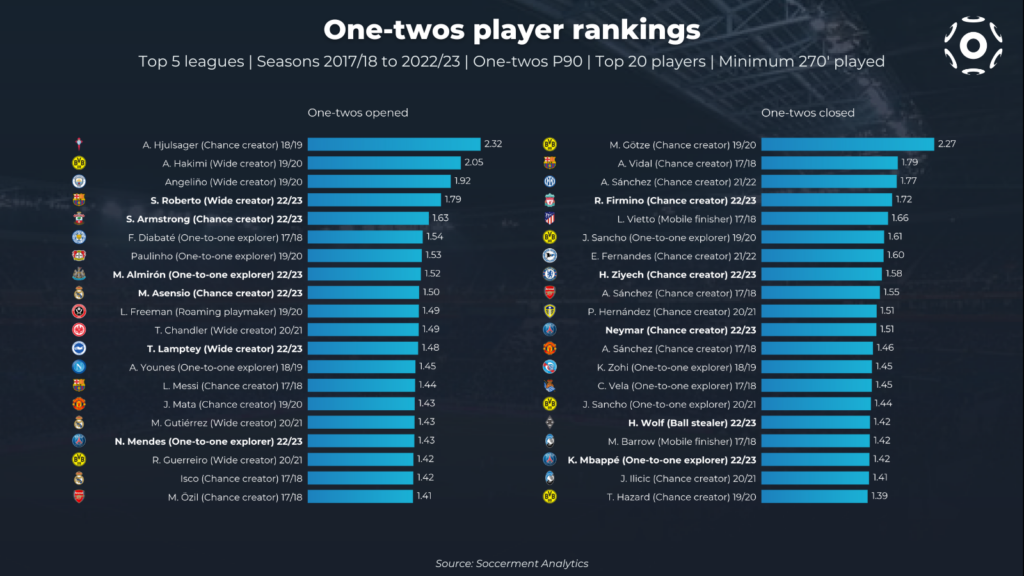
We complement the data with our player functions from our clustering model. As expected, we see that players making many one-twos are often wide attacking players, such as Wide creators and One-to-one explorers, while the ones closing them are usually Chance creators.
Here is how the same rankings look when focusing on the current season:
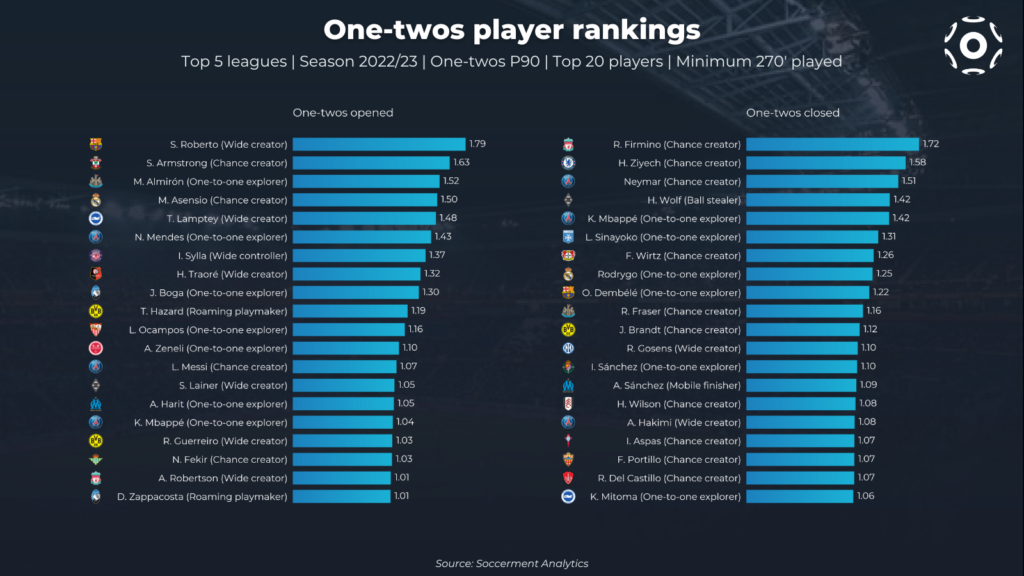
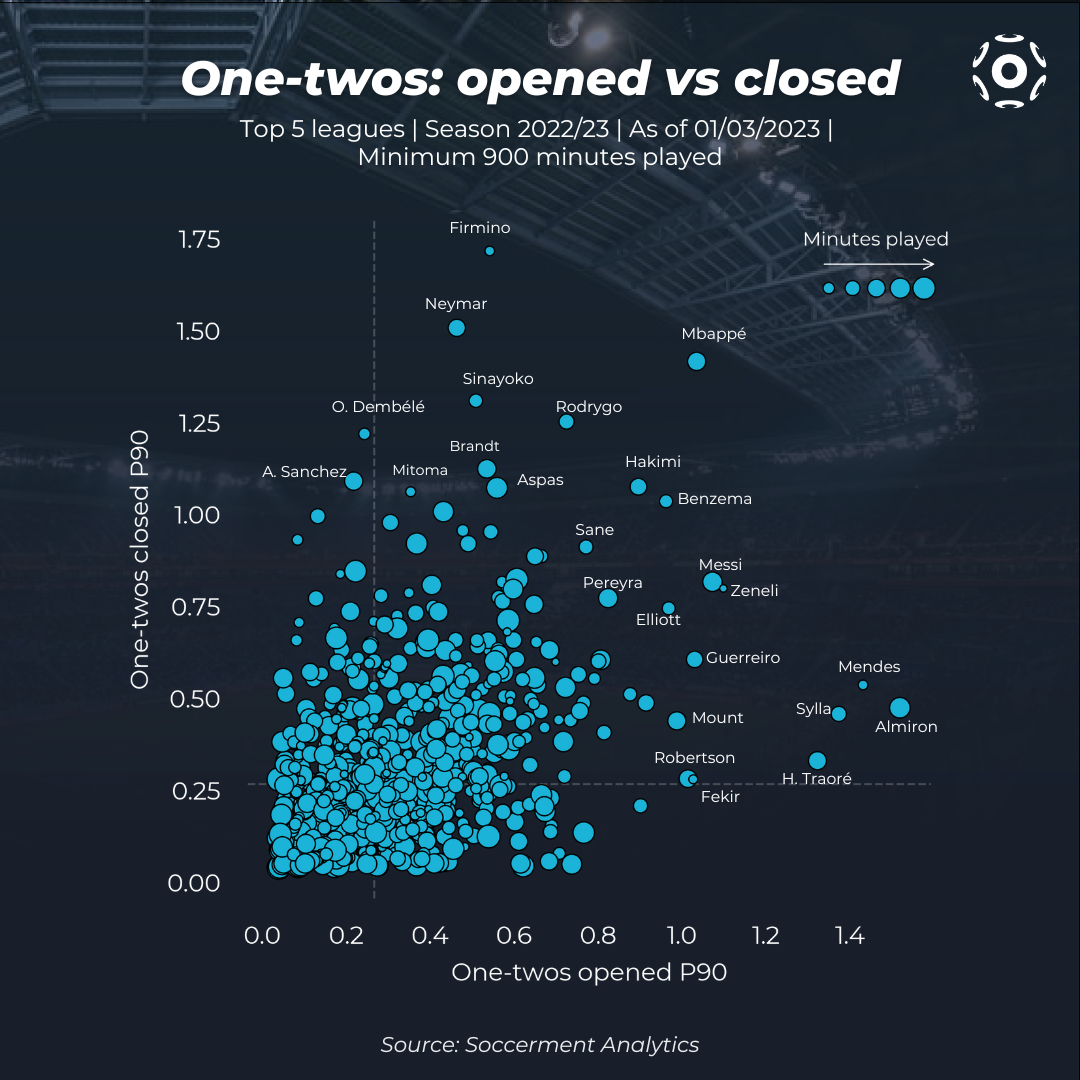
We see that players tend to appear in either of the top rankings, but not in both, i.e. it is not so common for a player to both open and close many one-twos. This makes sense, given that we saw different kinds of players dominating the two rankings. We can also see this by comparing one-twos opened vs. closed P90 for 2022/23, for players in the top 5 leagues with at least 900 minutes played and at least one instance of either event. Both top rated players in the two axes (Firmino for one-twos closed, Almiron for one-twos opened) are above the median in both metrics. PSG’s stellar front three of Messi, Neymar and Mbappé (together with Hakimi), appear in the top-right quadrant, with the Argentinian more likely to open, the Brazilian more likely to close, and the French with a balanced contribution of both.
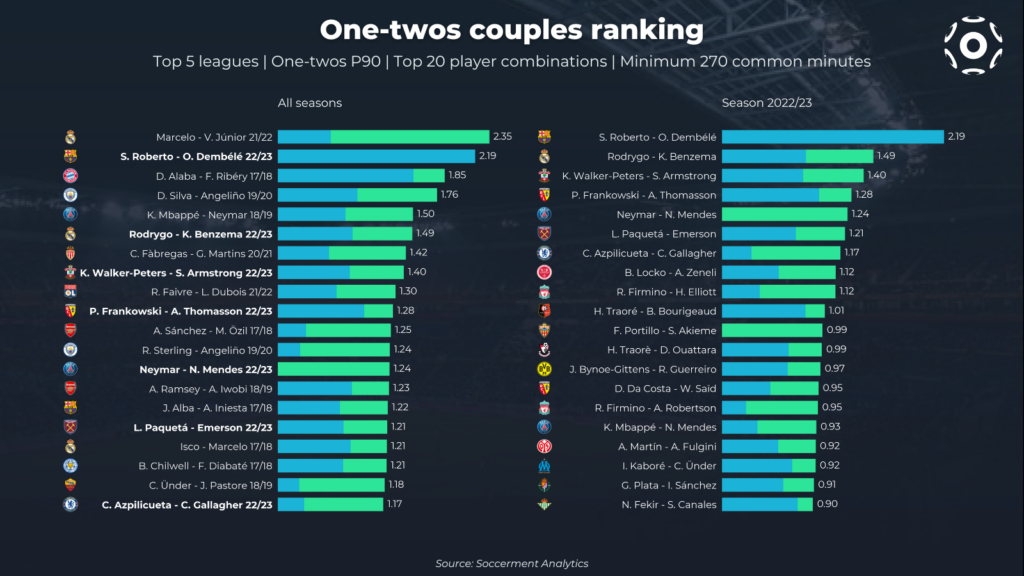
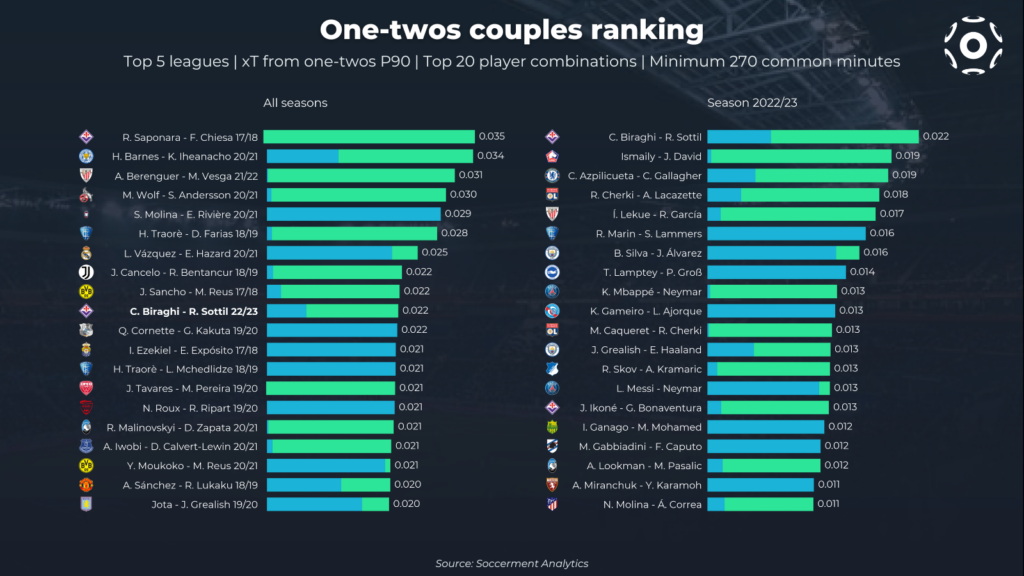
Since two players are involved in each one-two, we can also look at the player couples who make the most one-twos per 90 minutes spent on the pitch together, and what is the balance within the couple (the blue part refers to one-twos opened by player 1 and closed by player 2, the green part viceversa).
We can also look at the Expected Threat value of the two passes involved in the one-two, and use it to rank the couples in an alternative way.
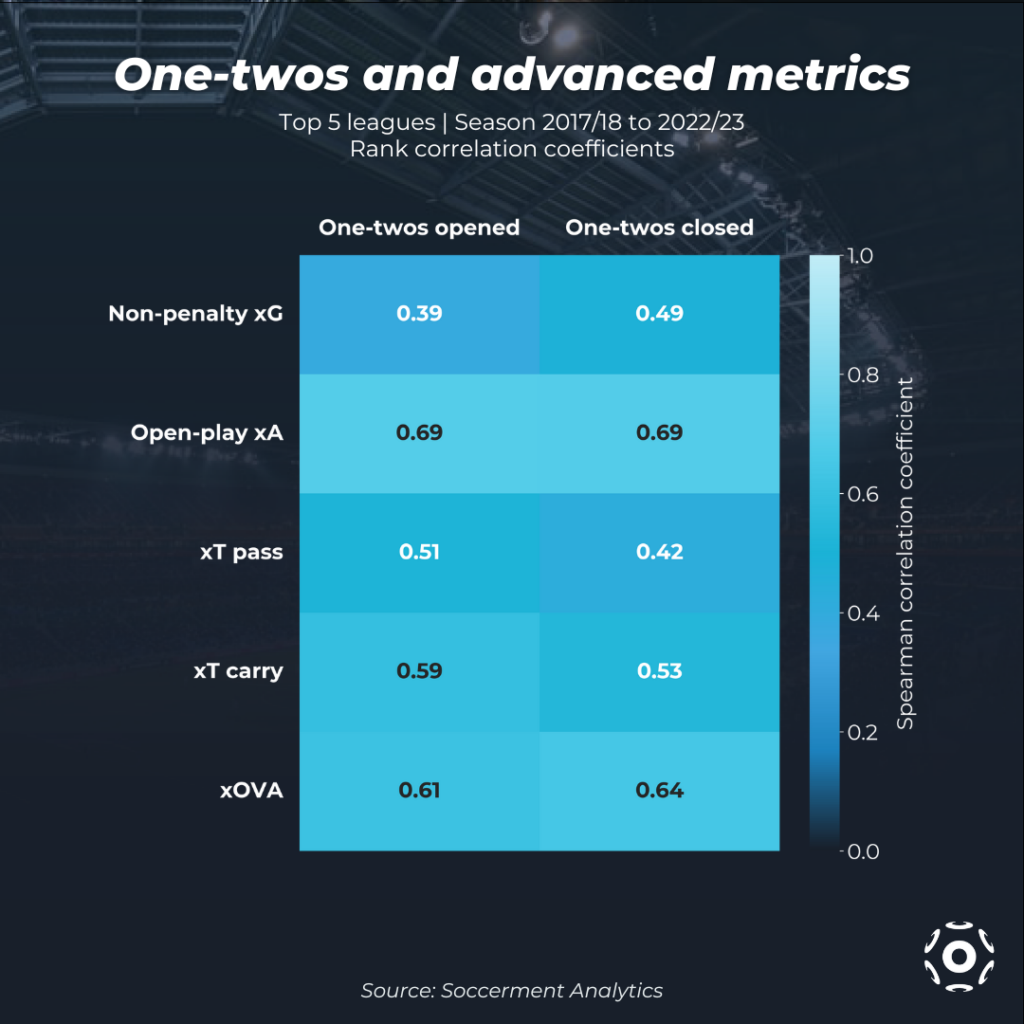
It is interesting to see if there is a correlation between one-twos and advanced metrics at the player level, such as xG, xA, xT or xOVA. Here we show the correlation coefficients of one-twos opened and closed against these advanced metrics. We see that both one-two metrics have a good level of correlation with advanced metrics. Specifically, the highest correlation levels are found with open-play xA and xOVA, signaling that creative players tend to perform a high number of these actions. It is interesting to see that non-penalty xG correlate more with one-twos closed than opened, which makes sense in football terms, as strikers will tend to perform layoffs with their back to goal to support runs from their teammates.
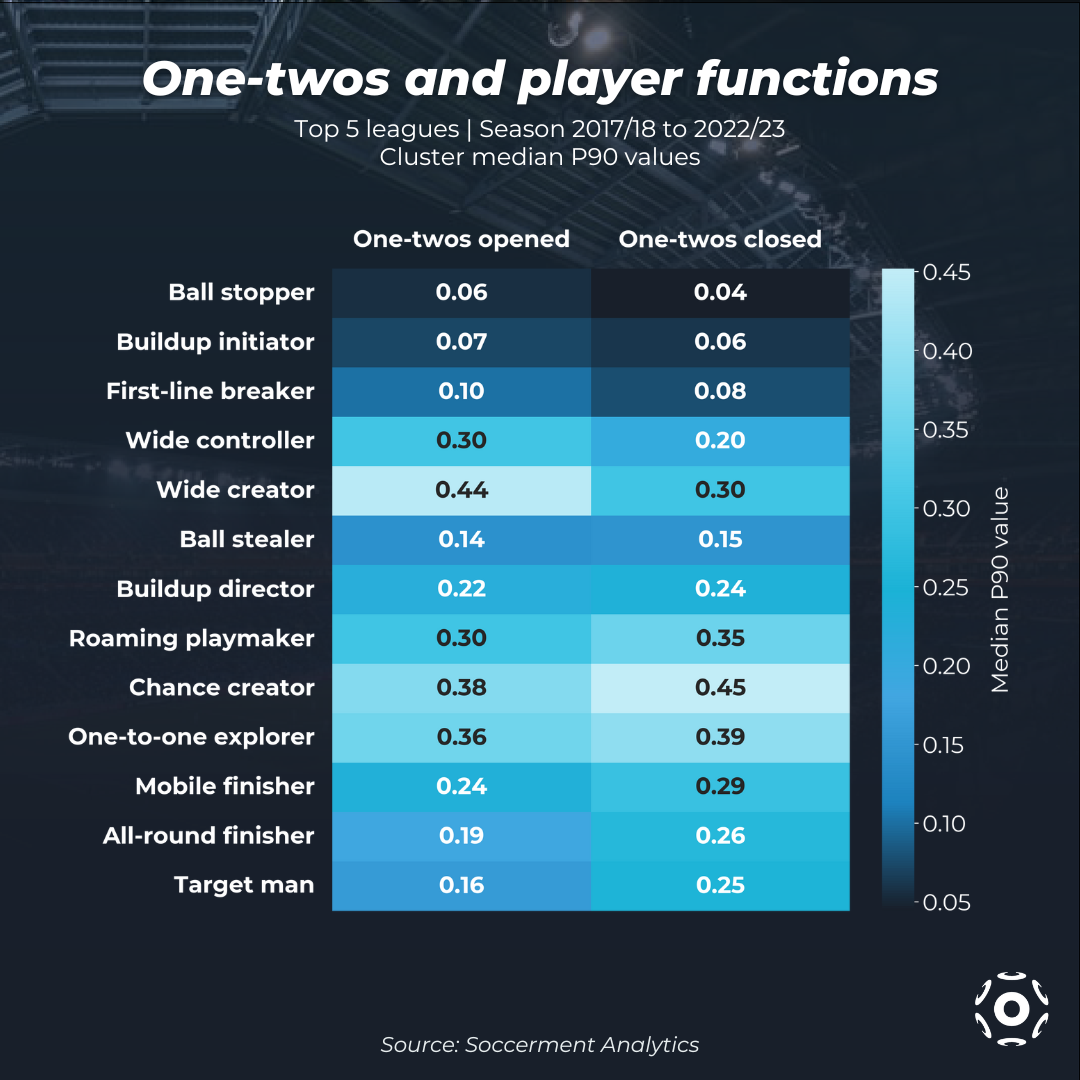
We can also look at the number of one-twos through the lens of our clustering model, by taking the median values of one-twos opened and closed per 90 minutes in each cluster. We see that Wide creators have the highest number of one-twos opened, while Chance creators close the most. This is consistent with the player rankings we saw before, and with the function corresponding to these clusters. We will integrate one-twos in future updates of our clustering model, as it will help to further characterize player functions.
Lascia un commento