


Introduction
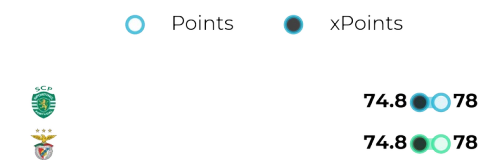
We’ve reached the final stretch of the Portuguese league season, and here’s the situation at the top of the table: Benfica and Sporting Lisbon are tied on 78 points, with both sides also registering 74.8 expected points.
It’s an unusual but very real scenario that will likely be resolved this weekend, on Saturday, May 10, at the Estádio da Luz, home of Benfica, where they’ll face off against Sporting Lisbon.
Both teams arrive at this point with the same number of points and identical expected points. Let’s now take a deeper look at their playing styles and the key differences between them-crucial for anticipating how Saturday’s match might unfold.
🔑 Key Insights
- Benfica and Sporting are tied on points and expected points — the title will likely be decided here.
- Benfica is stronger on set pieces; Sporting excels in open play.
- Benfica’s high press leaves them exposed defensively; Sporting is more compact.
- Both teams build up differently but are equally dangerous in attack.
1. COMPARISON RADAR
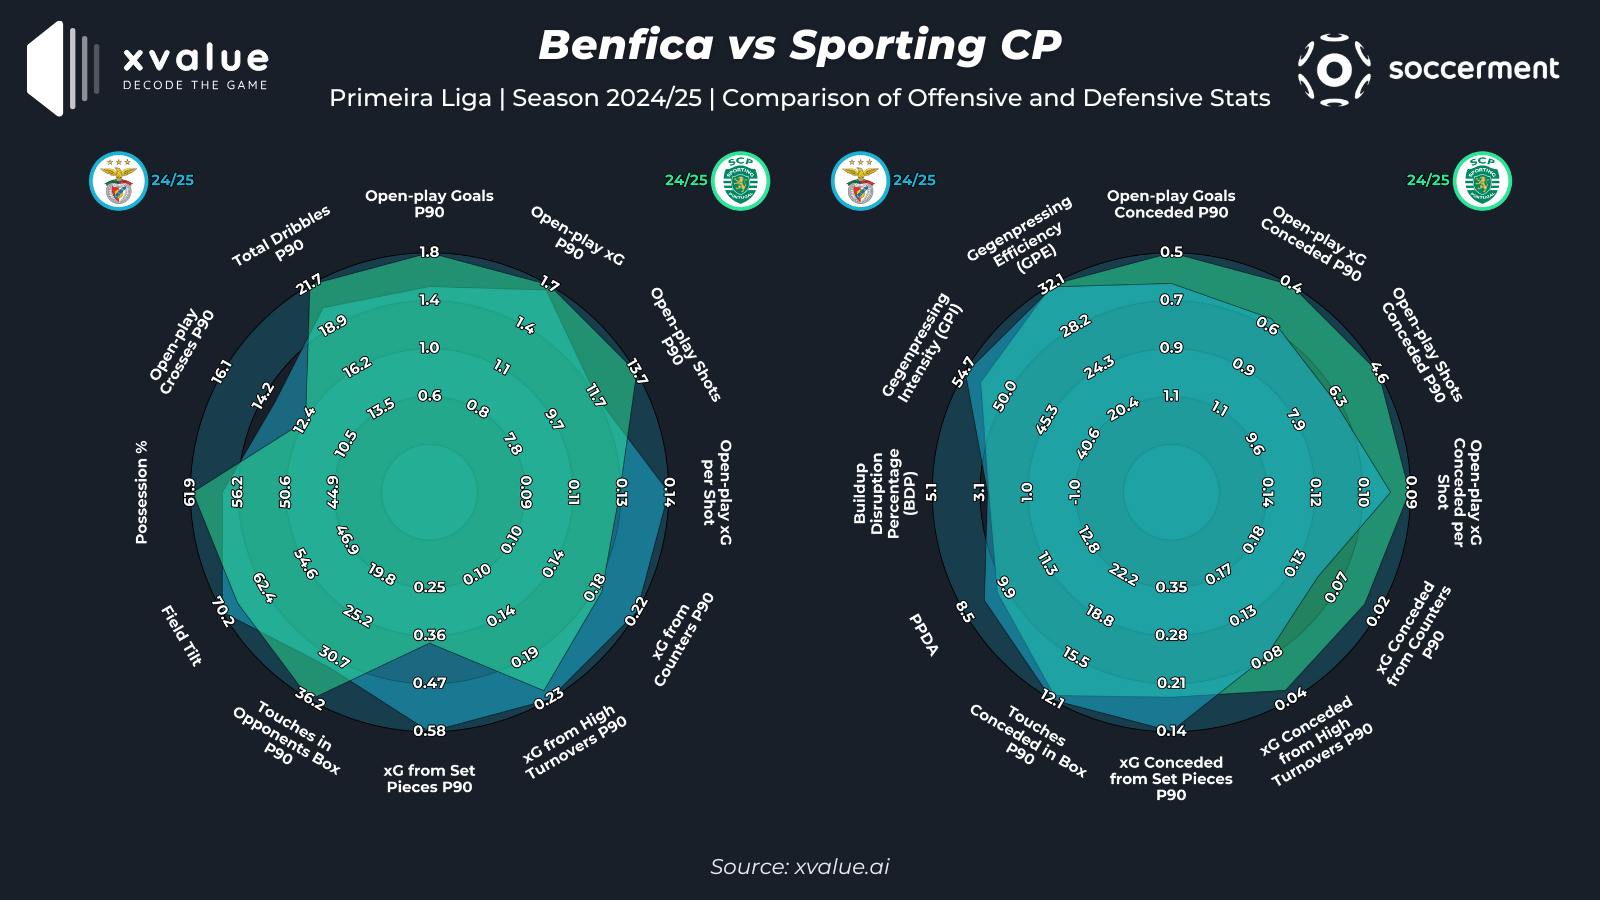
Let’s immediately look at two comparison radars between the teams. The one on the left shows offensive stats and metrics, while the one on the right focuses on defensive metrics.
In blue, on both radars, we see Benfica’s performance; in green, Sporting Lisbon’s.
The two radars also compare these teams to the rest of the Primeira Liga, and at first glance, it’s clear that both lead in most offensive and defensive metrics.
OFFENSIVE RADAR:
Let’s now break down the offensive metrics in the comparison. Some differences immediately stand out.
The most striking is the xG generated from set pieces, with Benfica clearly ahead, posting a value of 0.58 compared to Sporting’s 0.36. Still focusing on Benfica, they also show superiority in open play xG per shot, with a value of 0.14, indicating high-quality shot opportunities. They also excel in xG per game from counterattacks (0.22) and have a slight edge in xG from high turnovers (0.23).
In terms of offensive threat, Sporting performs better in open play goals per game (1.8) and open play shots per game (13.7).
Regarding playing style, Benfica leads in open play crosses per game (14.0 vs. 12.4 for Sporting) and slightly edges in field tilt (70.2).
Looking at Sporting’s style, they are stronger in possession percentage (61.9%) and total dribbles (21.7). They also outperform in touches in the opposition box per game, with a value of 36.2.
DEFENSIVE RADAR:
Now let’s analyze the second radar with defensive metrics. Again, both teams post top-tier numbers in the league. However, some differences stand out.
Benfica seems more effective only in terms of xG conceded per game from set pieces. In addition to strong offensive set-piece data, they also dominate defensively in this area, unlike Sporting, who appear slightly more vulnerable to dead-ball situations.
In other defensive effectiveness metrics, Sporting is superior, starting with open play goals conceded per game (0.5), and continuing with xG conceded from counterattacks and high turnovers.
In terms of defensive and pressing style, both teams adopt a high and aggressive approach, seeking to press and counter-press quickly after losing the ball.
Still, Benfica shows a slightly more aggressive stance, outperforming in PPDA and GPI. In efficiency metrics like BDP and GPE, both teams are practically equal.
2. 🔴 Benfica – Aggression, Quality and High Press
Offensively, the Lisbon side scores 2.56 goals per game, with an identical xG of 2.56 per game, showing good finishing efficiency. Their non-penalty xG per shot is 0.14, indicating high-quality shot selection. In build-up play, Benfica shows great territorial control in the final third, with a field tilt of 70.21%, the highest in the league.
Defensively, they concede 0.81 goals per game and use an aggressive style, highlighted by a defensive event height of 43.88 meters—the highest in the league. This reflects a clear intent to press high and quickly regain possession. Their gegenpressing efficiency (GPE) stands at 32%, second-best in the Primeira Liga, confirming their effective pressing game.
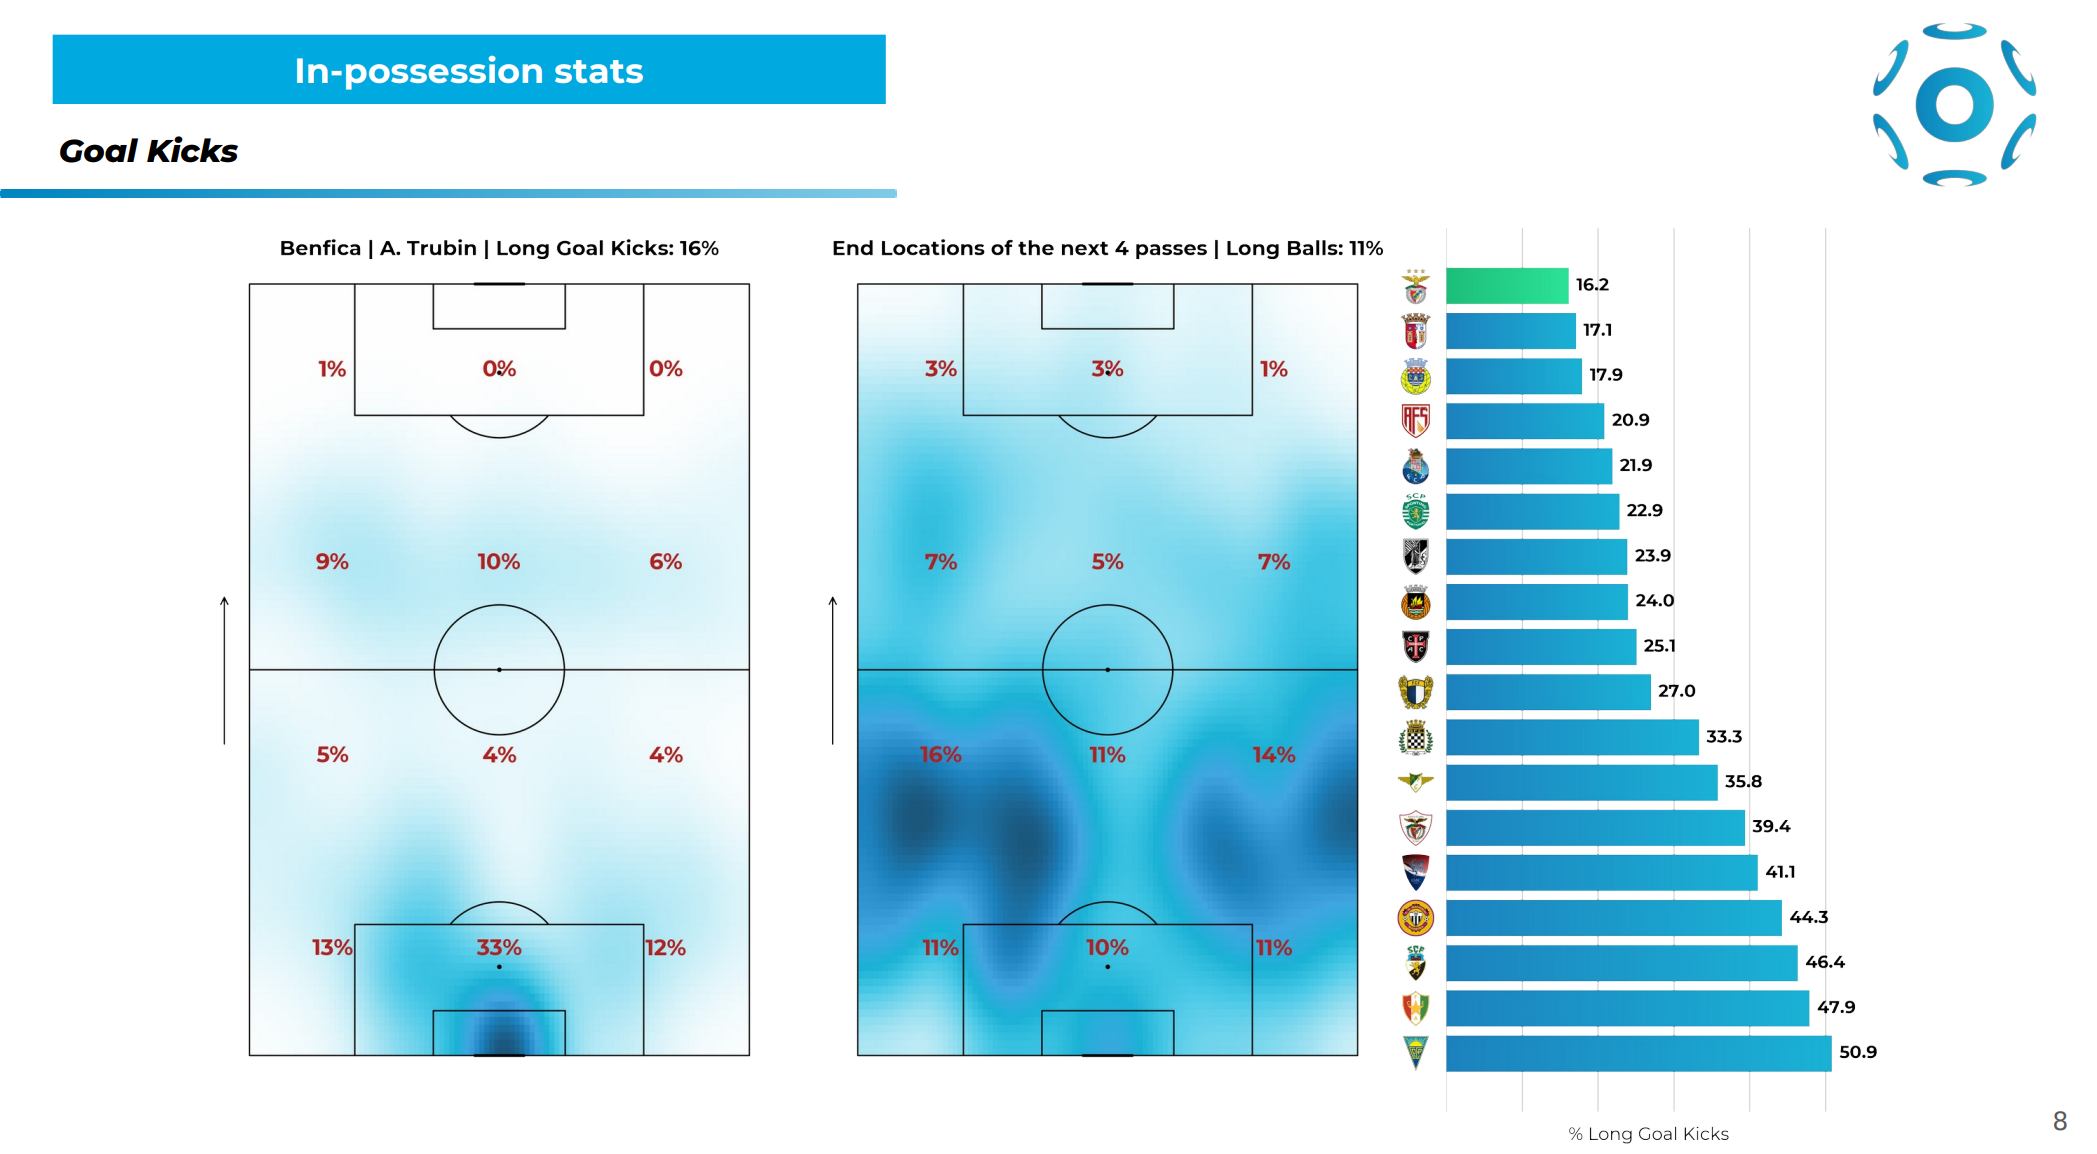
🔨 Build-up from Goal Kicks
Let’s now analyze Benfica’s goal kick phase.
They rank last in % of long goal kicks (16.2%), meaning they mostly start their plays with short passes.
From the first heatmap on the left, we can see that the first pass is played centrally within the six-yard box 33% of the time.
The next four passes are then directed towards the wide channels, as shown in the second heatmap on the right, with a slight preference for the left side (16% left – 14% right).
They are very effective in this phase, leading the league in xG generated from goal kicks with 3.23. However, they also rank fourth-last in xGA after losing possession (1.29), confirming what we previously observed in the radars: Benfica struggles with possession losses and opponent counterattacks.
Still, they are very effective in progressing the play, leading in % of buildups reaching the final third, the opposition box, and getting a shot off.
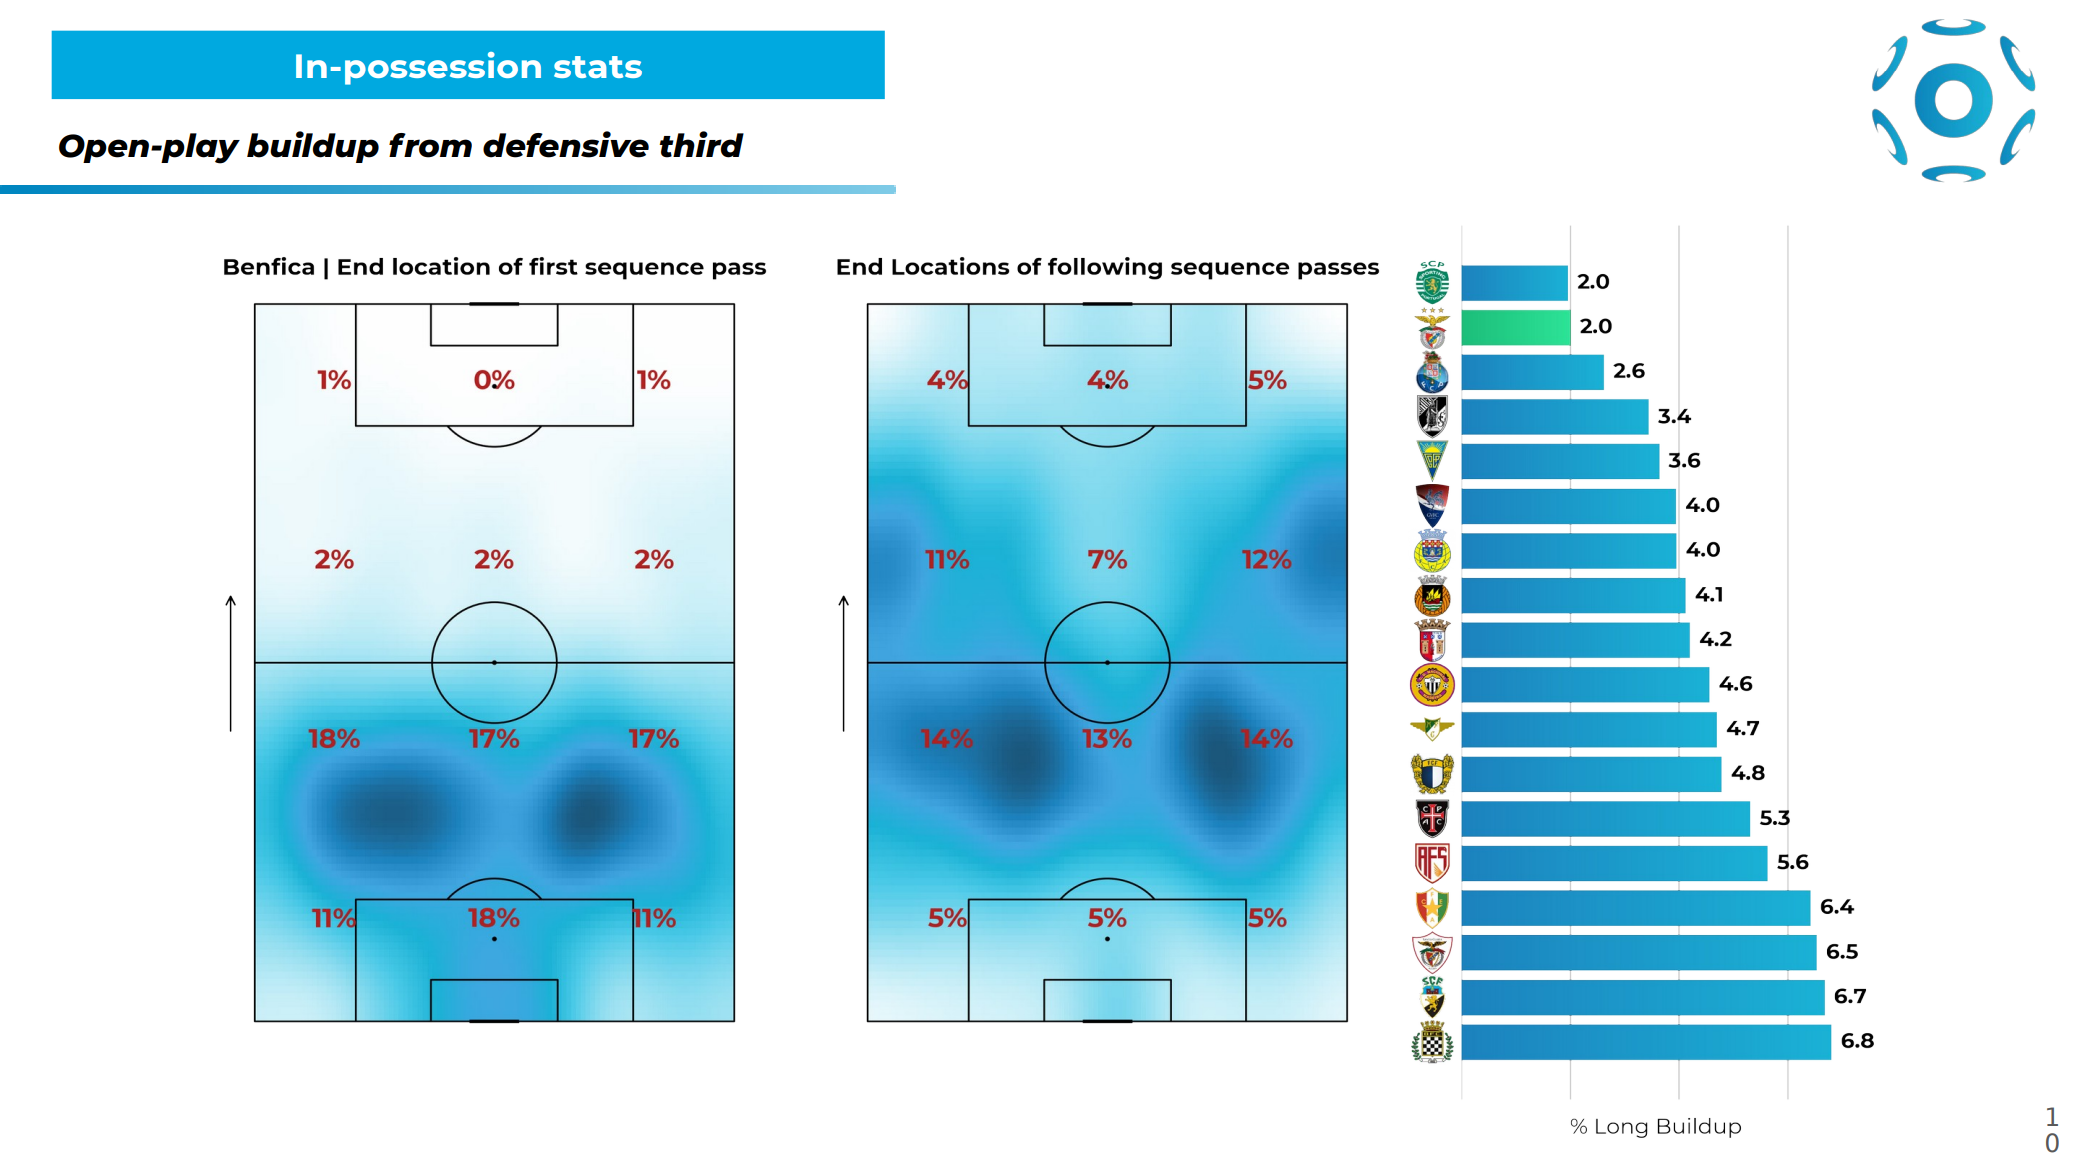
🛠️ Open Play Build-up
In open play build-up, Benfica is again second-last in % of long build-ups (2%).
From the first heatmap on the left, we can see that in the first passing sequence, they use the entire defensive third, with a slight preference for the left side. They often occupy and play through the left and right half-spaces.
In the following passing sequences, they distribute equally on both flanks (14% left and right) in their own half, but slightly prefer the right flank in the attacking half (12% right – 11% left).
In this phase, Benfica is once again the league’s most dangerous team, ranking first in xG generated (10.88), and also top in % of sequences reaching the final third, opposition box, and shots taken.
🔗 Pass Network
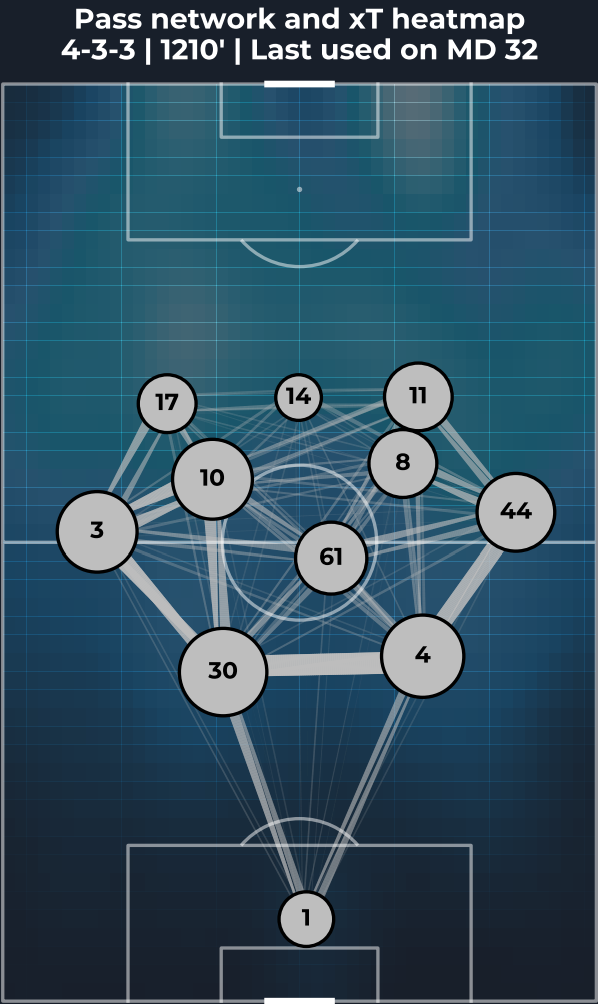
Below we see Benfica’s pass network, clearly shaped as a 4-3-3 with stronger passing lines among the four defenders.
We also notice that the number 10, Kökçü, in midfield has a larger node, meaning he’s highly involved in the team’s possession. The same goes for number 11, Di Maria, in the attack.
📈📉 Seasonal Trend
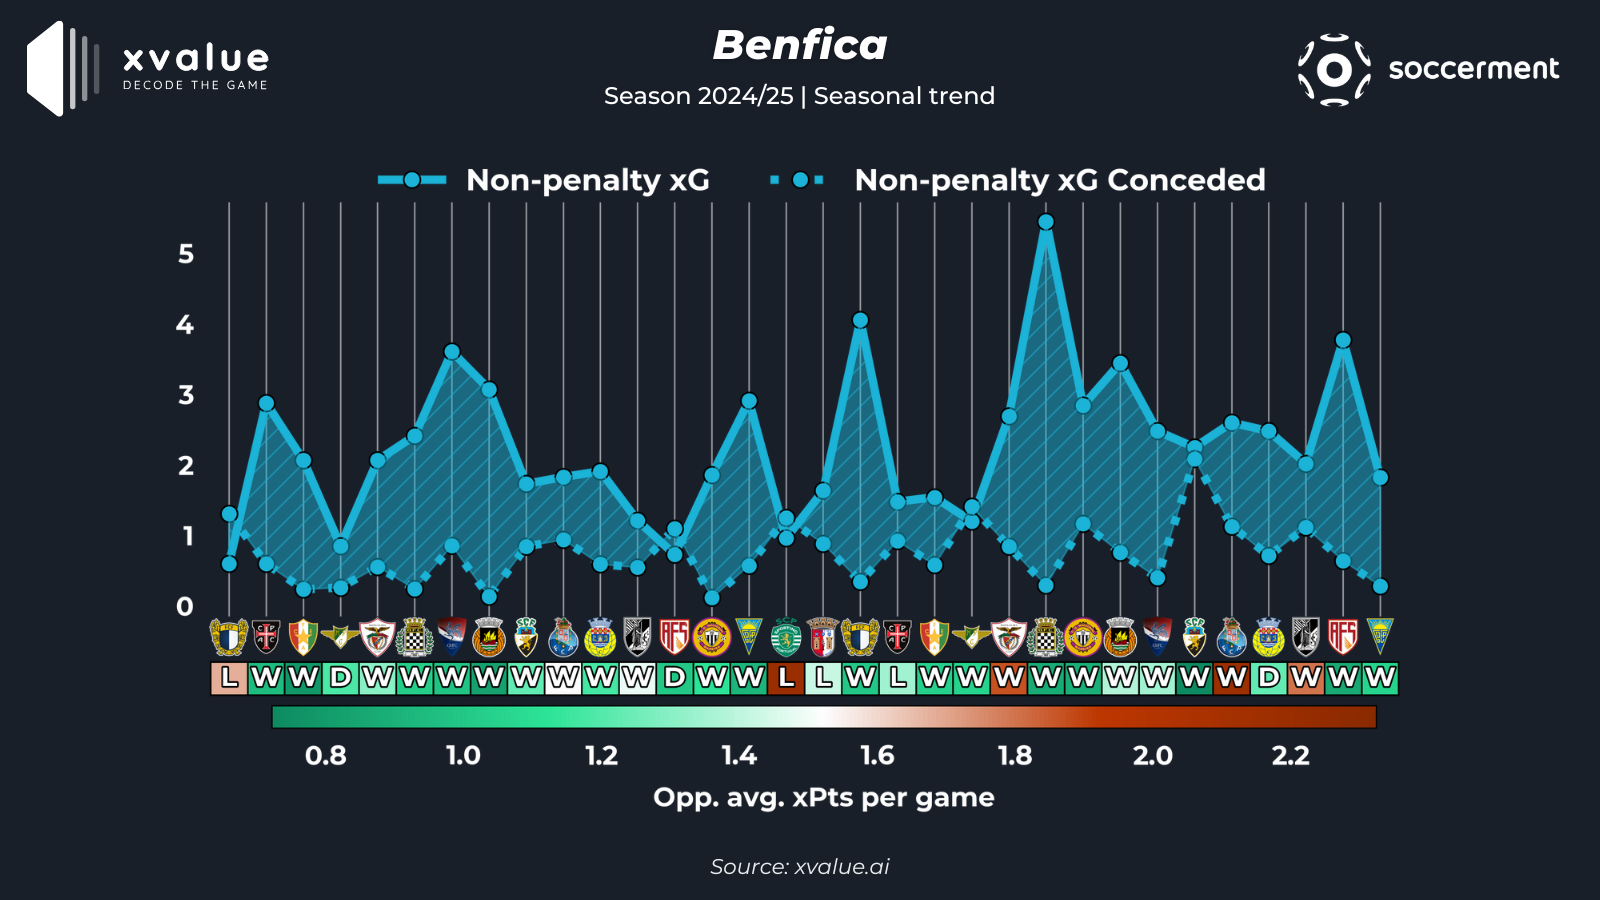
Finally, let’s analyze Benfica’s seasonal trend based on non-penalty expected goals for and against.
In most matches, Benfica created more xG than their opponents. This did not happen in just four games: matchday 1 vs. Famalicao, matchday 13 vs. AVS, matchday 21 vs. Moreirense, and matchday 16 vs. Sporting Lisbon.
Benfica is currently on a 13-game unbeaten streak, with 12 wins and 1 draw.
In the four matches where they had lower xG than the opponent, they only won once-losing to Famalicao and Sporting Lisbon, and drawing with AVS.
This shows that Benfica rarely wins when it doesn’t create more chances than the opposition.
3. 🟢 Sporting CP – Control, Possession and Defensive Solidity
Offensively, Sporting are the best attack in the league with 2.66 goals per game. Their 36.16 touches in the opponent’s box per game-the highest in the Primeira Liga-reflect a strategy based on possession and positional attack.
The Lions also lead in total passes per game(529.06), showing their commitment to build-up play.
Defensively, concede 0.81 goals per game, but particularly shines in expected goals against: 0.66 xGA per game, the best defensive xG in the league. This highlights their excellent organization and ability to limit dangerous chances.
Sporting’s style of play emphasizes control and order, with less focus on immediate pressing but great ball retention and spatial manipulation.
🔨 Build-up from Goal Kicks
Let’s now analyze Sporting Lisbon’s goal kick buildup phase.
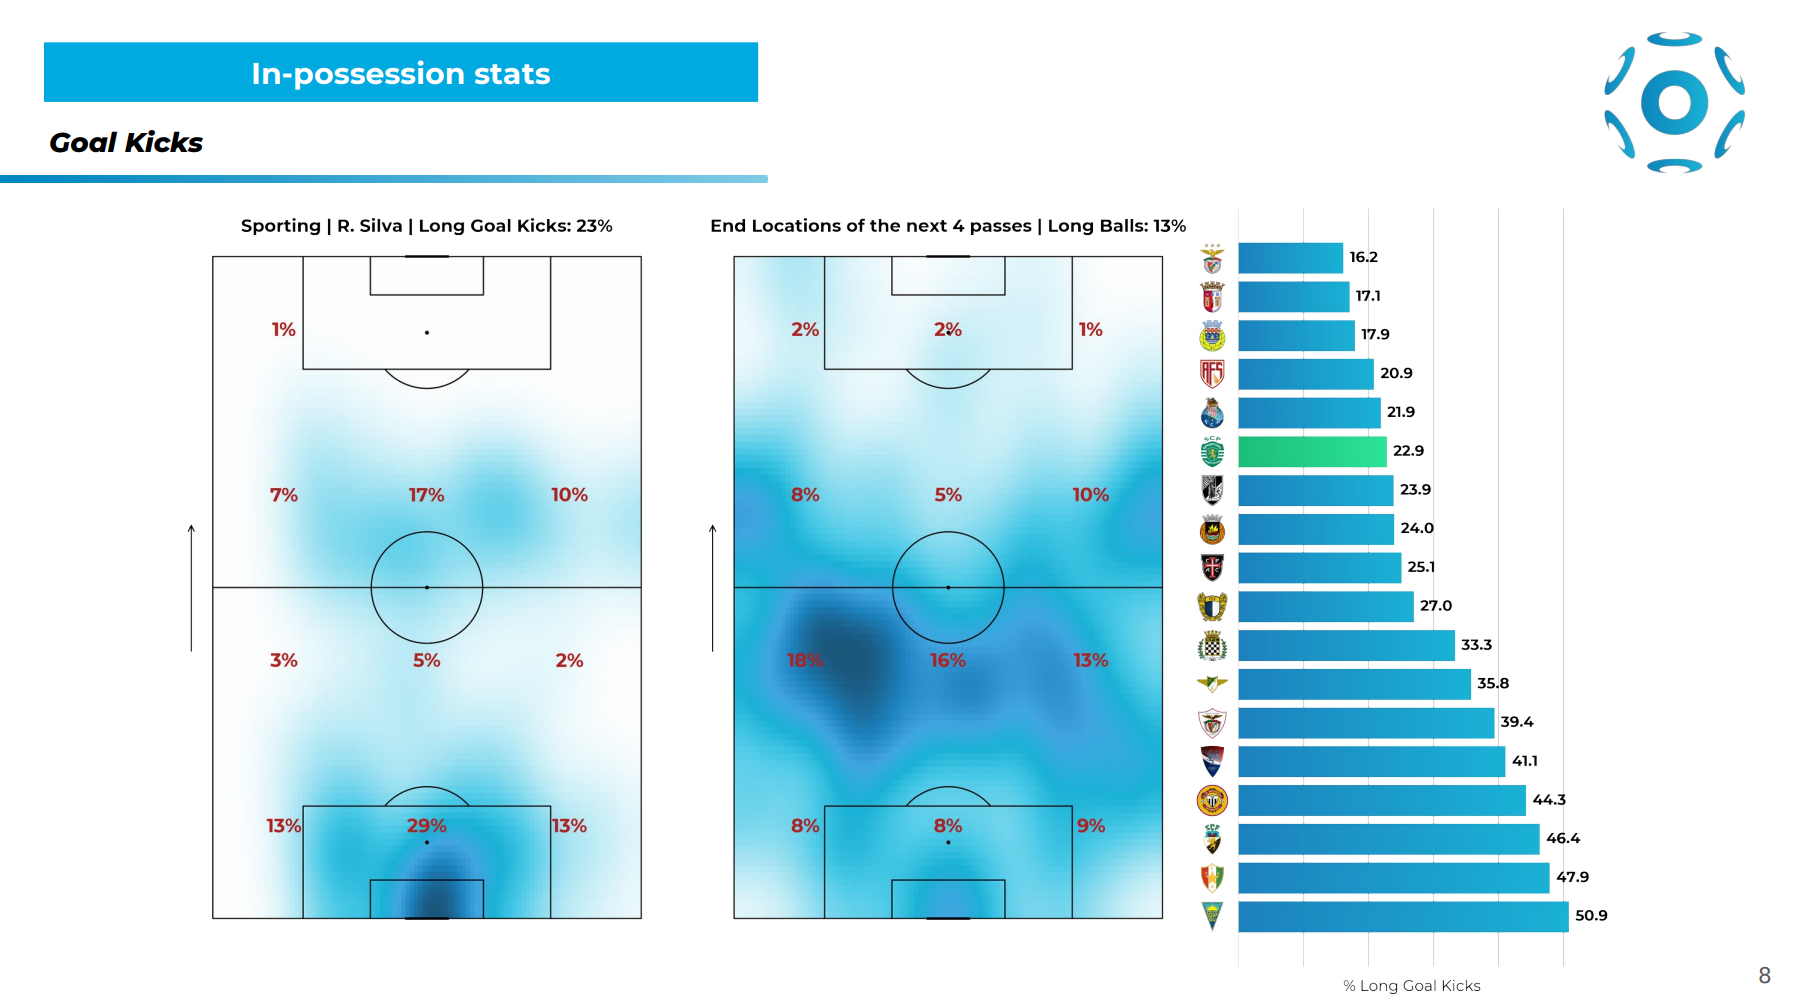
Compared to Benfica, they rank 13th in the use of long goal kicks (22.9%). This middle-low ranking suggests that Sporting prefers short build-ups but is also capable of playing long and direct, especially toward Gyökeres, leveraging his physical attributes.
From the first heatmap on the left, we see that the first pass is short 29% of the time, within the six-yard box. When they go direct, they mostly aim for the central attacking third (17%).
From the second heatmap on the right, we see that the next four passes mainly go down the left flank (18%) and the middle zone (16%). When building directly, the ball often ends up on the right side after aerial duels and second-ball battles (10%).
In this phase, Sporting is far less effective than Benfica, ranking 8th in xG (0.90). Despite being less dangerous offensively, they are 5th in xGA, showing strong defensive stability after losing possession.
They are also effective, though behind Benfica, in reaching dangerous zones-2nd in % of sequences reaching the final third and opposition box, and 3rd in % of sequences ending in a shot.
🛠️ Open Play Build-Up
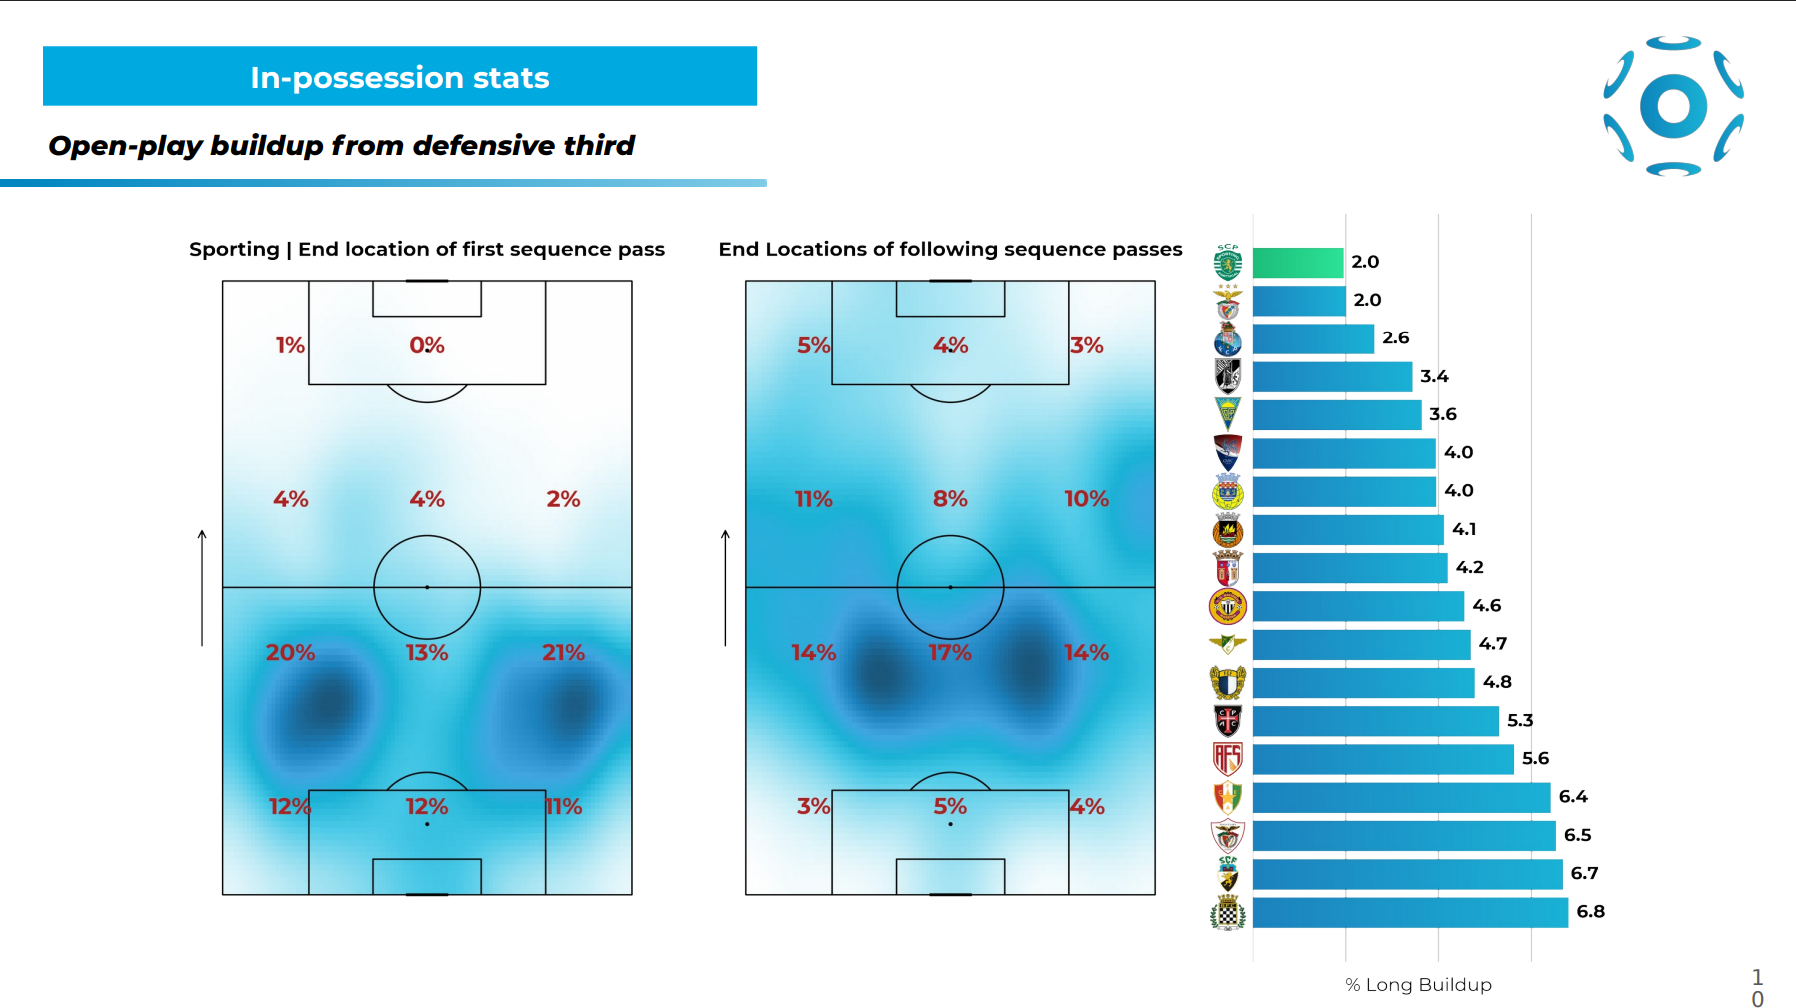
As for the build-up in open play, in this phase Sporting is the team that uses long passes the least, ranking last in long buildup percentage with 2%.
We immediately notice from the first heatmap on the left how, in the initial passing sequence, Sporting focuses on development through the wide channels, with a slight preference for the right side (21% vs 20% on the left).
In the following sequences, as shown by the second heatmap on the right, they tend to narrow their action radius to the left-central and right-central zones in their own half, then develop play down the flanks in the attacking half (11% on the left and 10% on the right).
During this phase, Sporting remains consistently moderately dangerous, ranking eighth in xG generated with a value of 3.58. They also remain very solid defensively after losing possession in this phase, ranking third in xGA with a value of 1.01.
As in the previous phase, they are effective at reaching dangerous and advanced zones, though still behind their rivals. In fact, they rank second in the percentage of times they reach the final third and the percentage of times they take a shot, while they are third in the percentage of times they reach the opponent’s penalty area.
🔗 Pass Network
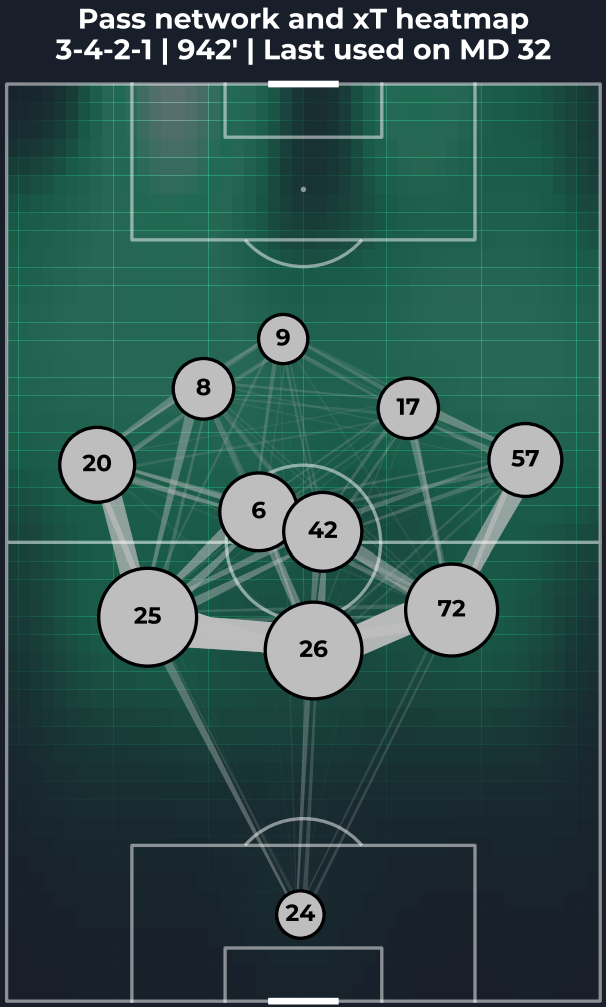
Let’s now move on to the visualization of Sporting Lisbon’s pass network.
We immediately notice their formation, 3-4-2-1, with the two attacking wingbacks positioned very narrow to support the central striker.
We also observe how the three dots representing the central defenders are very large, a sign of the high amount of possession maintained in the defensive phase.
📈📉 Seasonal Trend
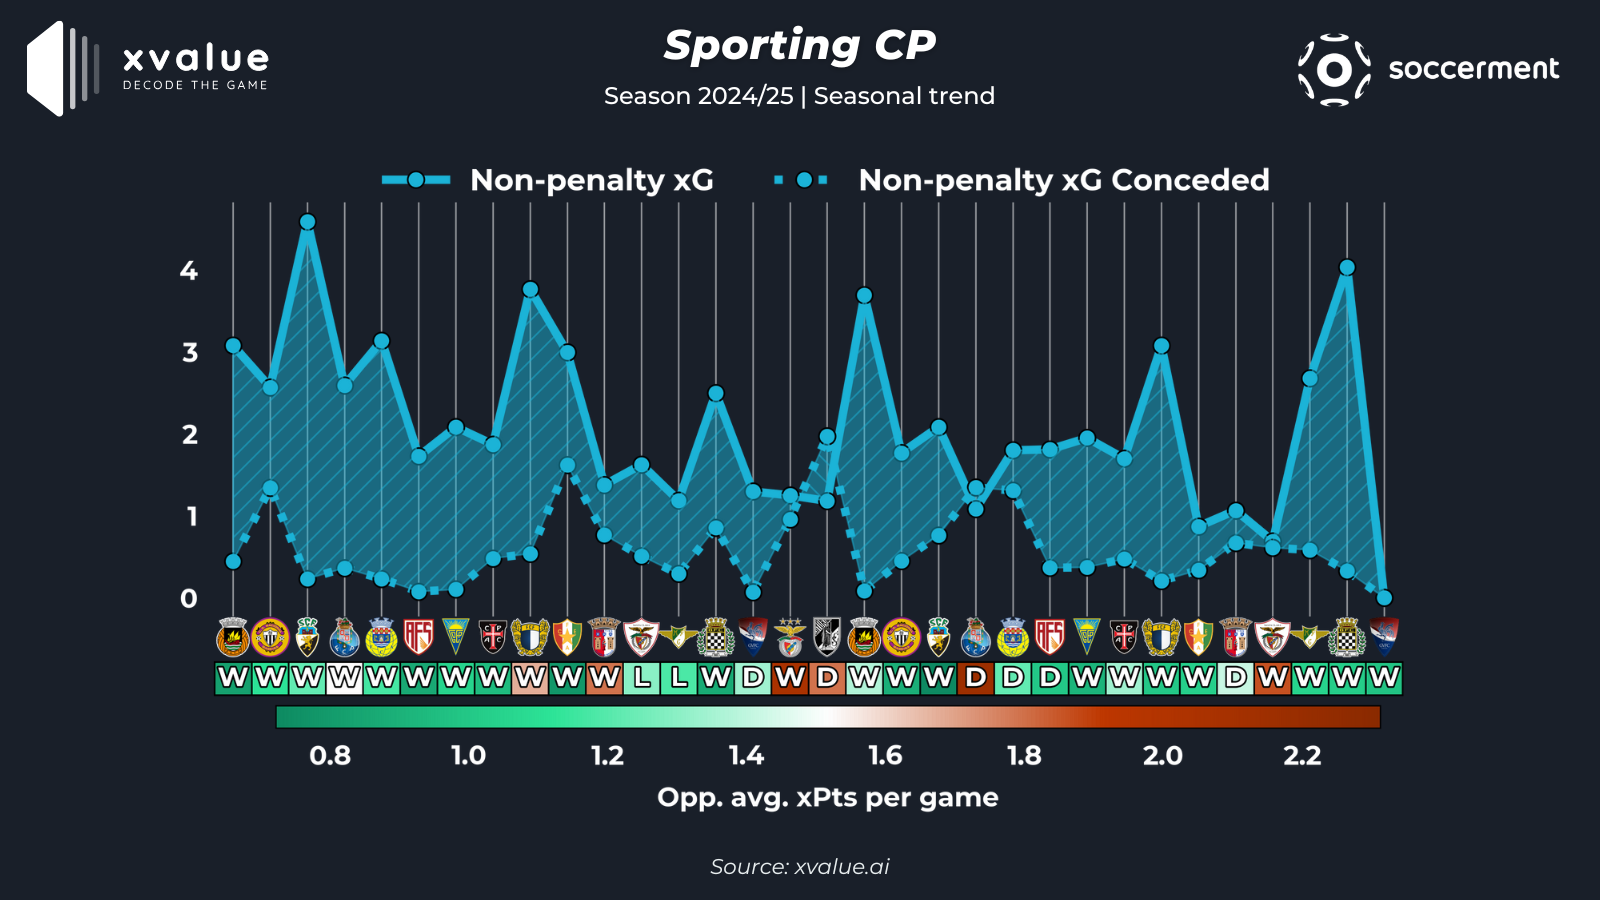
Finally, let’s analyze Sporting’s seasonal trend based on non-penalty expected goals and non-penalty expected goals conceded.
Sporting has dominated most matches in terms of xG created, showing a consistently high level of performance throughout the season.
There are only three matches in which they produced fewer xG than their opponent: matchday 14 against Vitória Guimarães, matchday 18 against Braga, and the recent matchday 30 against Porto.
In those three matches, they recorded two defeats and one draw—an indication that, like Benfica, Sporting struggles to secure positive results when it fails to create more than its opponent.
The team comes into this weekend with 11 consecutive unbeaten matches (9 wins, 2 draws), and seems to be peaking at the right time for the decisive clash against their rivals.
4a. 🔐 The Tactical Key to the Match – Benfica on Set Pieces
After analyzing both teams from different angles, we were able to identify their strengths, but more importantly, their weaknesses.
For Benfica, their strength lies in being the most efficient and dangerous team in the league across all offensive metrics. However, the real key to the match could be set pieces, where Benfica ranks first offensively, generating 0.58 xG per game.
On the other hand, although Sporting tops nearly every defensive metric in terms of effectiveness and solidity, they are more vulnerable on set pieces. They rank fourth in xGA per game from set plays and second to last in the percentage of xGA conceded from set plays relative to total xGA, with a value of 35.11%.
This means that 35.11% of the xG conceded by Sporting comes from set pieces.
So, let’s break down Benfica’s attacking set pieces and contrast them with Sporting’s defensive set piece performance.
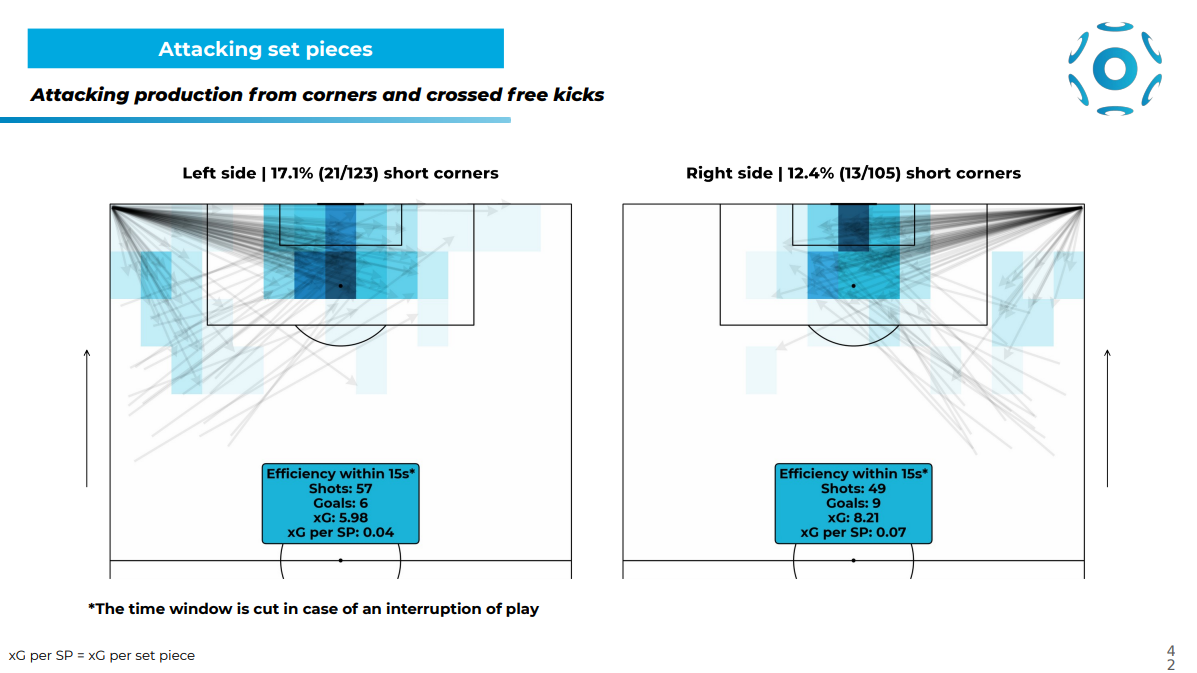
🎯 Attacking Set Pieces – Benfica
Regarding Benfica’s set pieces, we notice that they are much more dangerous from the right side, with 8.21 xG generated, 49 shots taken, and 9 goals scored.
They have also created a lot from the left side, with 5.98 xG generated, 57 shots taken, and 6 goals scored.
Starting from the right (where they are more dangerous), we observe that the most targeted area is the center of the six-yard box, while on the left, the most targeted area is the central part of the box around the penalty spot.
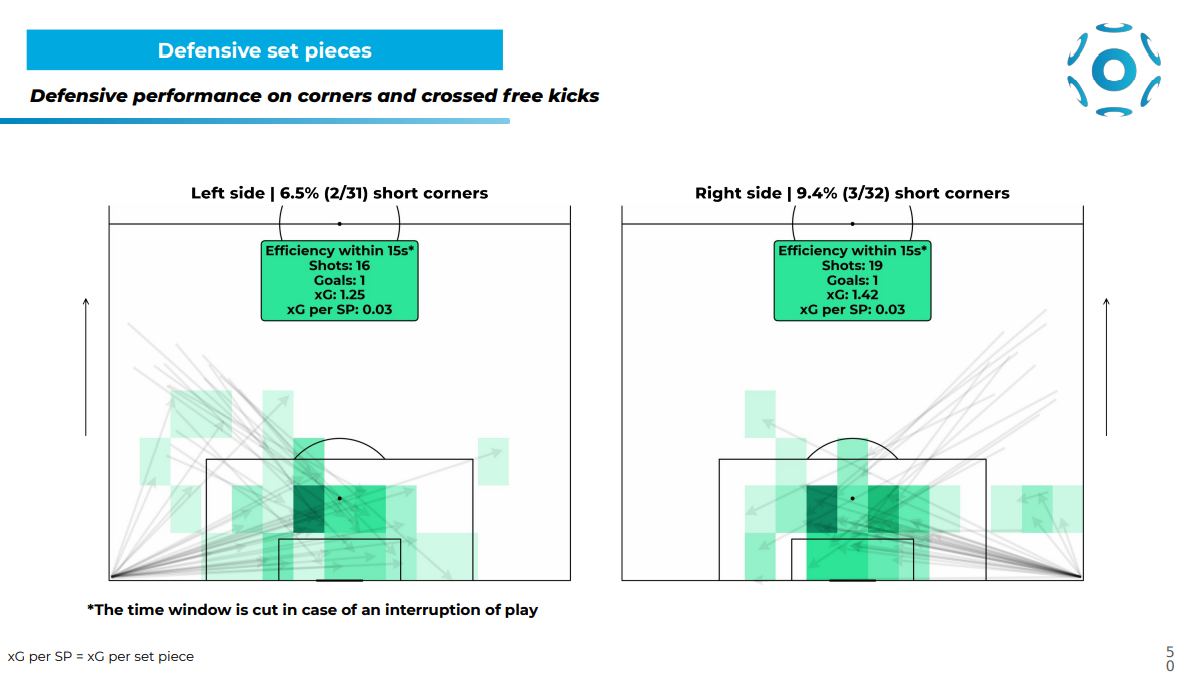
🛡️ Defending Set Pieces – Sporting Lisbon
Now let’s compare the situation of Sporting Lisbon’s defensive set pieces.
We notice that, between the right and left sides, they concede slightly more set pieces from the right, having allowed 1.42 xGA, 19 shots, and 1 goal. From the left, they have conceded similarly, with 1.25 xGA, 16 shots, and 1 goal.
We also notice that from the right, they give more space in the center-second post area. On the left, however, they concede more space in the center-first post area.
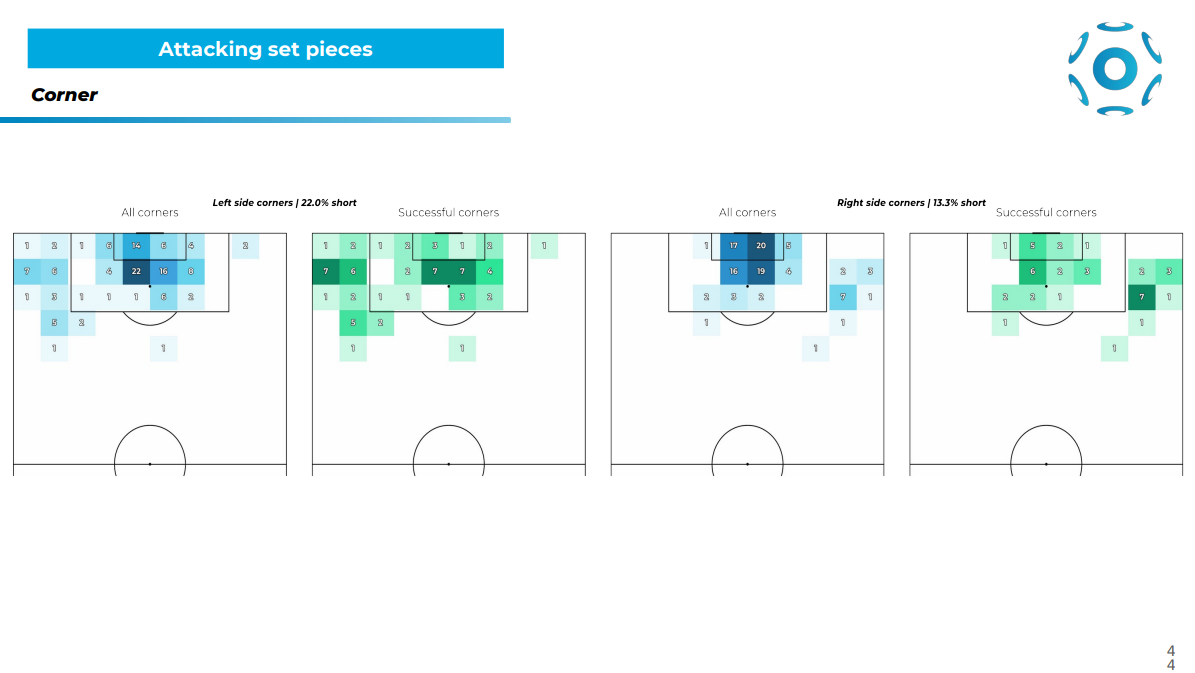
🎯 Attacking Corners – Benfica
In this graphic, we analyze Benfica’s attacking corners. Blue indicates the delivery zones, and green shows the zones where a teammate successfully made contact with the ball.
There is a clear difference between corners from the left and right. From the left, Benfica targets the near-post central area most often (22 times), while from the right, they target the entire central area, especially the center of the six-yard box (darker zone).
From the left, they are more effective inside the box, especially when connecting in the central zones-both near and far post.
In percentage terms, they’ve been more efficient at the far post, making as many successful contacts as at the near post but with fewer deliveries.
It’s also worth noting that they opt for short corners 22% of the time from the left side.
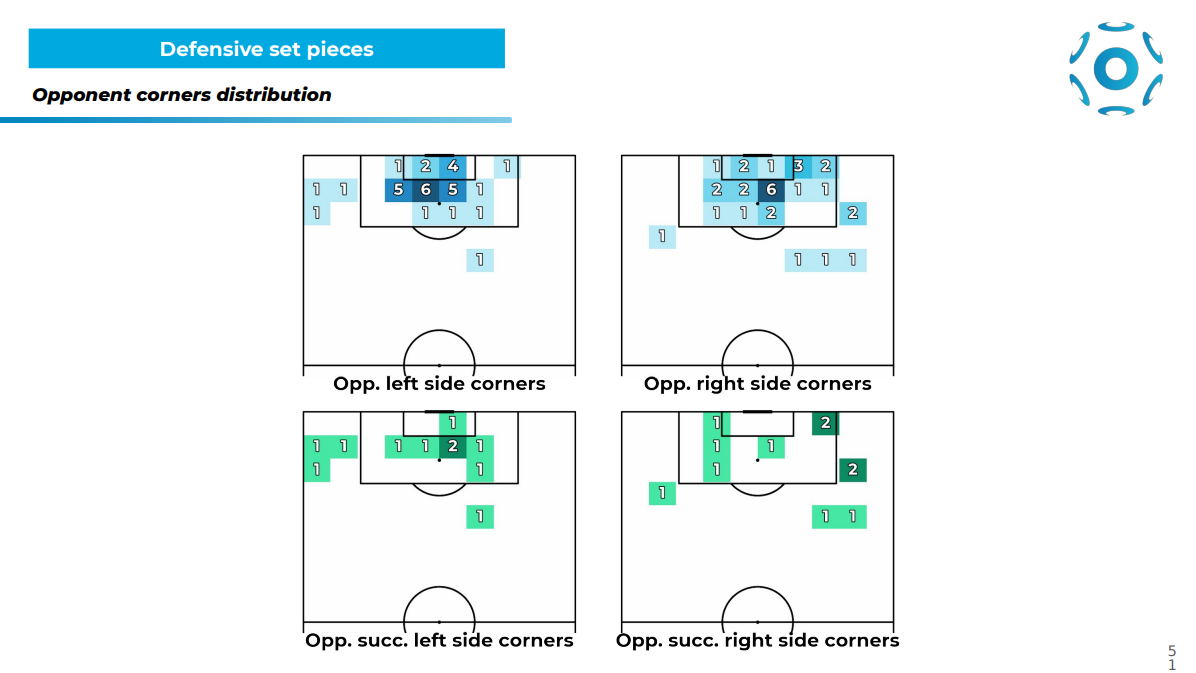
🛡️ Defending Corners – Sporting Lisbon
Now let’s contrast Benfica’s attacking corners with Sporting’s defending zones. As before, blue indicates where opponents attempted to deliver the ball, and green where they made contact.
It’s clear that Sporting is more vulnerable from the left side, whereas they’ve defended the box very well from the right.
From the left, the most problematic area is the center to far-post zone.
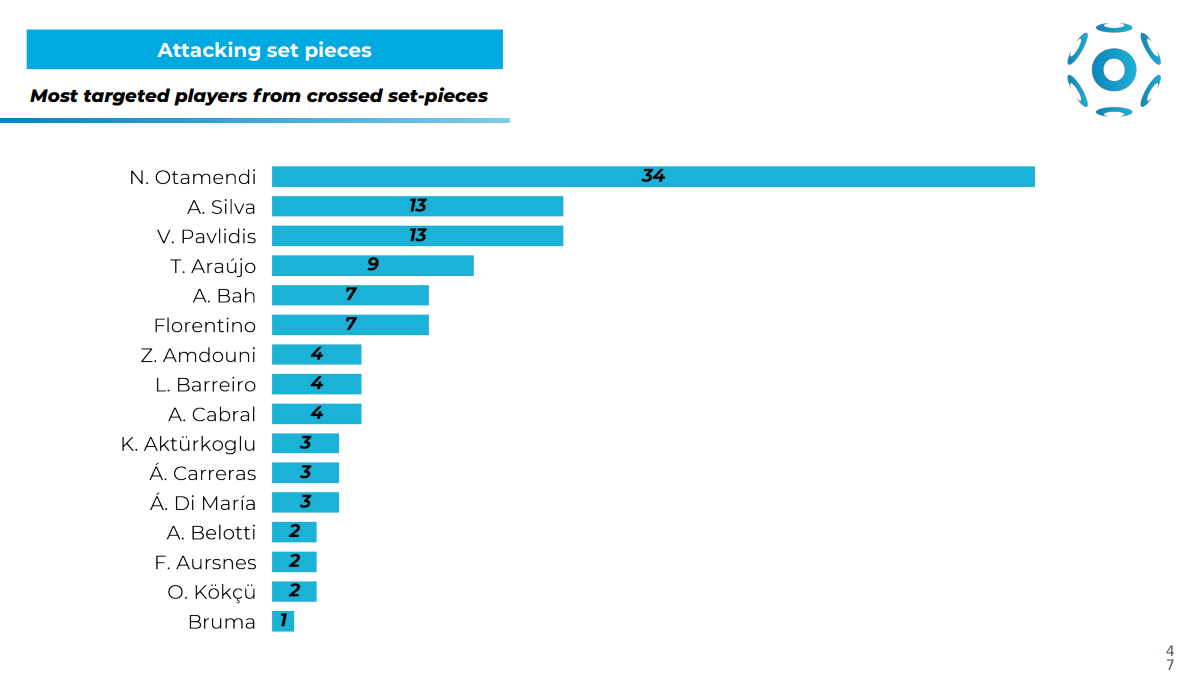
🛫 Aerial Duels and Most Dangerous Players
Looking at the most dangerous players, it’s clear that Otamendi stands out as Benfica’s biggest threat on set pieces. He has connected with crosses nearly three times more than the players ranked second and third. Definitely one to watch.
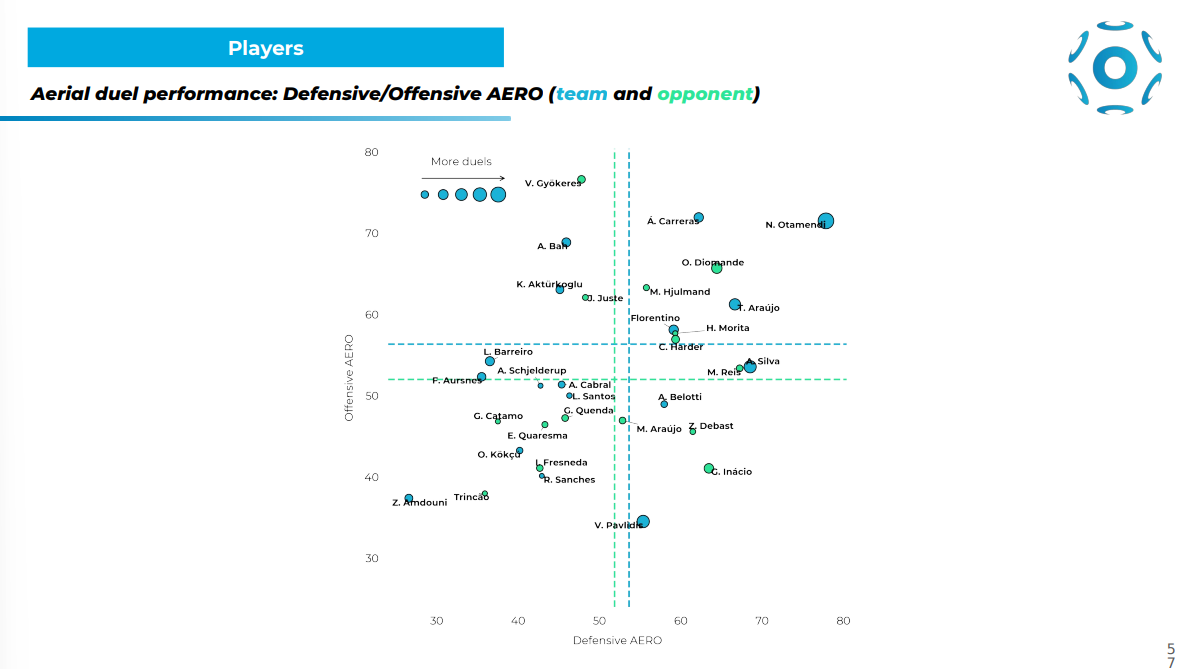
Finally, let’s look at aerial duels using the Defensive and Offensive AERO metrics, which measure a player’s effectiveness in aerial duels.
We can immediately see the strongest players in aerial duels, both offensively and defensively.
In attack for Benfica: Otamendi, Araujo, André Silva, and Carreras stand out.
In defense for Sporting: Gyökeres leads by far, followed by Diomande and Hjulmand.
4b. 🔐 The Tactical Key to the Match – Sporting on the Counter
After identifying Benfica’s potential key to the match through Sporting’s struggles on set pieces, we now look at the opposite: the opportunities Sporting could exploit.
Among all phases of play, Sporting’s positive transitions clearly stand out-particularly when contrasted with Benfica’s difficulties in negative transitions.
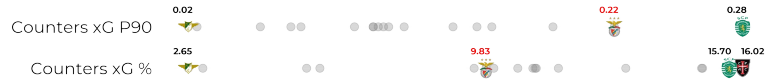
As shown in the two images below, Sporting ranks first in xG created per game from counterattacks (0.28) and second in percentage of total xG generated from counters, with 15.70%.
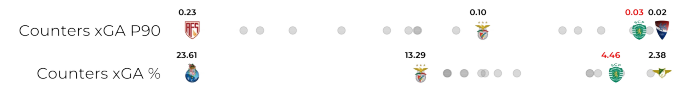
This means that 15.70% of Sporting’s xG comes from counterattacking situations.Conversely, Benfica ranks eighth in xGA per game conceded from counters (0.10), and second to last in the percentage of total xGA conceded from counterattacks, with 13.29%.
This means that 13.29% of the xG Benfica concedes comes from opponent counterattacks.
🤔 Your Take – Who Will Win It All?
After breaking down all the key tactical aspects of the match, we want to hear from you.
Who do you think will come out on top in this Lisbon showdown – Benfica or Sporting?
And more importantly, who will lift the Primeira Liga trophy, and how do you think it will happen – a dominant display, a late winner, or maybe even a dramatic twist in the final matchday?
Let us know your predictions!
Thanks!
Learn more about xvalue, the go-to analytics platform for scouting and match analysis 👉🏻 xvalue.ai
Stay tuned and don’t miss out on the latest updates and insights from Soccerment!
Lascia un commento