
One of the cornerstones of measuring offensive contributions in football is based on a very simple fact: the likelihood of scoring a goal in the next few actions depends heavily on the distance to goal at any given moment. It follows, therefore, that the most valuable actions, besides those directly related to scoring such as goals and assists, are those that move the ball closer to goal. This is the concept at the base of the action-valuing framework commonly known as Expected Threat (or xT), whose goal is to take a step back from actions such as shots and key passes, and assign credit to the preceding actions that made them possible in the first place.

Introduction
The concept that we now refer to as Expected Threat, or simply xT, was first introduced by Sarah Rudd back in 2011, before being repurposed into the currently most used definition by Karun Singh in 2018.
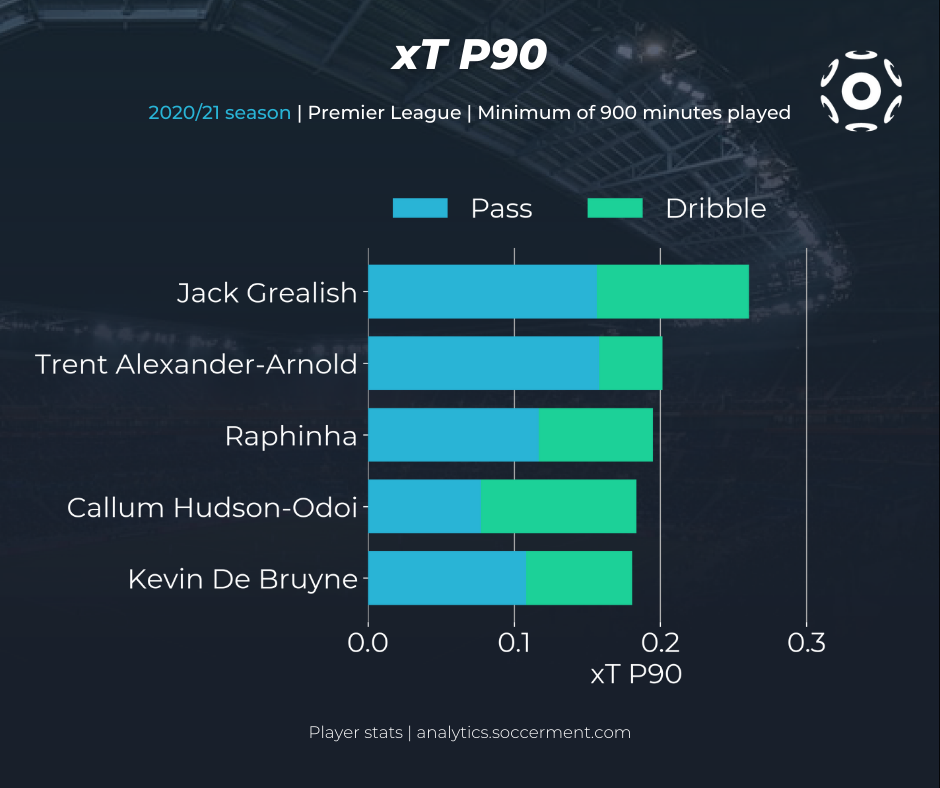
We can see an example of high-xT actions in the following sequence from Jack Grealish against Manchester United on matchday 17 of the 2020/21 EPL season. Grealish gets the ball on the left flank and carries it inside the penalty box. He then successfully delivers the ball to Traore at the edge of the six-yard box, with the pass becoming a goal assist in this case. Overall, in this sequence the new Manchester City no.10 increased his team’s scoring probability by 27%, effectively creating a hard-to-miss chance out of thin air.
The basic idea behind xT is to divide the pitch into a grid, with each cell assigned a probability of an action initiated there to result in a goal in the next N actions. This approach allows us to value not only parts of the pitch from which scoring directly is more likely, but also those from which an assist is most likely to happen. Actions that move the ball, such as passes and dribbles (also referred to as ball carries), can then be valued based solely on their start and end points, by taking the difference in xT between the start and end cell. In the case of Grealish, his ball carry brought a 0.013 xT increase, and the pass added a further 0.26 xT. In short, he moved the ball from a low-xT cell (0.02 xT) to a much more dangerous area of the pitch (0.32 xT). Note that the xT action value can be negative for passes and carries that move the ball away from goal.
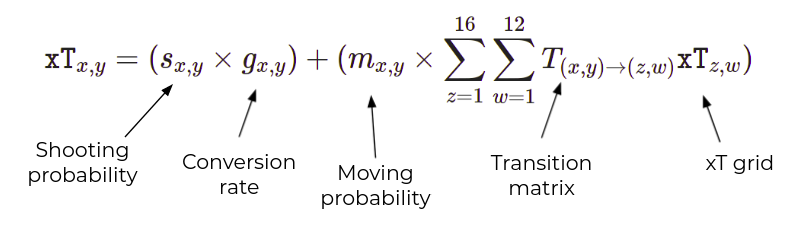
The scoring probability of a cell, i.e. the local xT value, is calculated as the sum of two terms. The first term is related to shooting and is simply the fraction of times a player shoots when in possession in that cell, multiplied by the shot conversion rate from that cell. The second term is the product of the fraction of times a player decides to move the ball, rather than shooting, and the sum of the moving probability to each of the other cells (called transition matrix) multiplied by their xT value. Basically, this term tells us which option a player is most likely to choose when in a certain cell, and how valuable those options are. The latter term is the one that allows xT to credit valuable passes that enable further actions such as key passes and shots.
Going back to the Grealish action, his starting cell had a low xT value, both because of the low shot conversion rate from that position and the weak offensive threat of moving to an adjacent area of the pitch. However, thanks to his outstanding dribbling and passing skills, Grealish was able to move the ball to a position from which scoring is relatively easy, and the offensive threat generated by passing the ball to a close player could be substantial. These factors contributed to the high xT value of the final position reached by the ball.
The figure below shows the xT grid we have calculated using all events from seasons 2017/18 to 2020/21 (included) in the top 5 leagues.
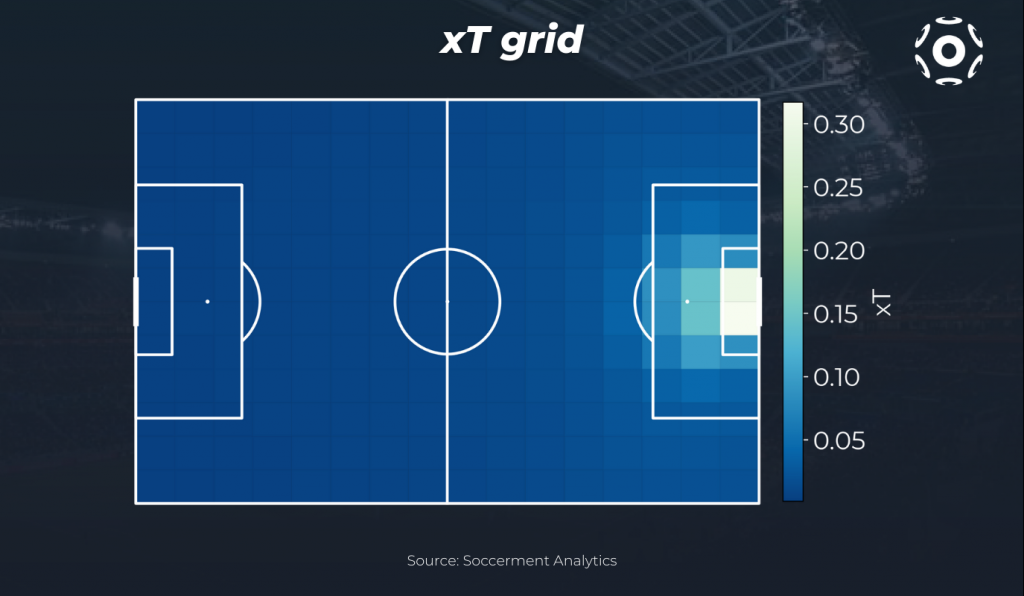
We note that xT frameworks can also include crosses as actions that progress the ball, but given their specific nature with respect to goal scoring probability we decide to exclude them from this analysis as they tend to have an overestimated action value.
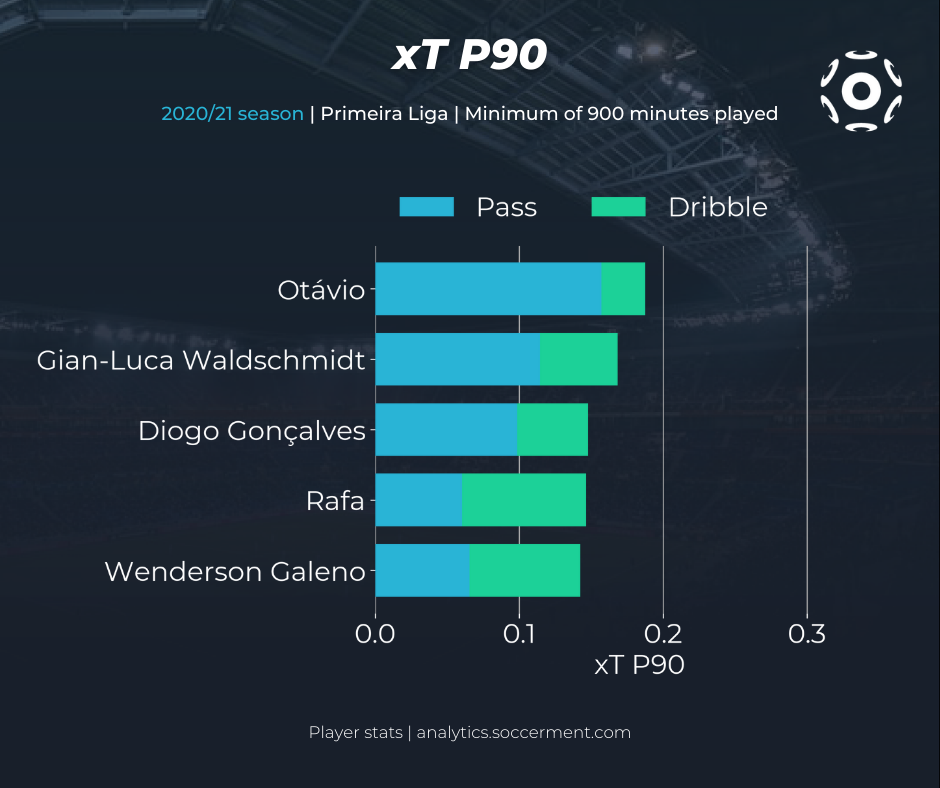
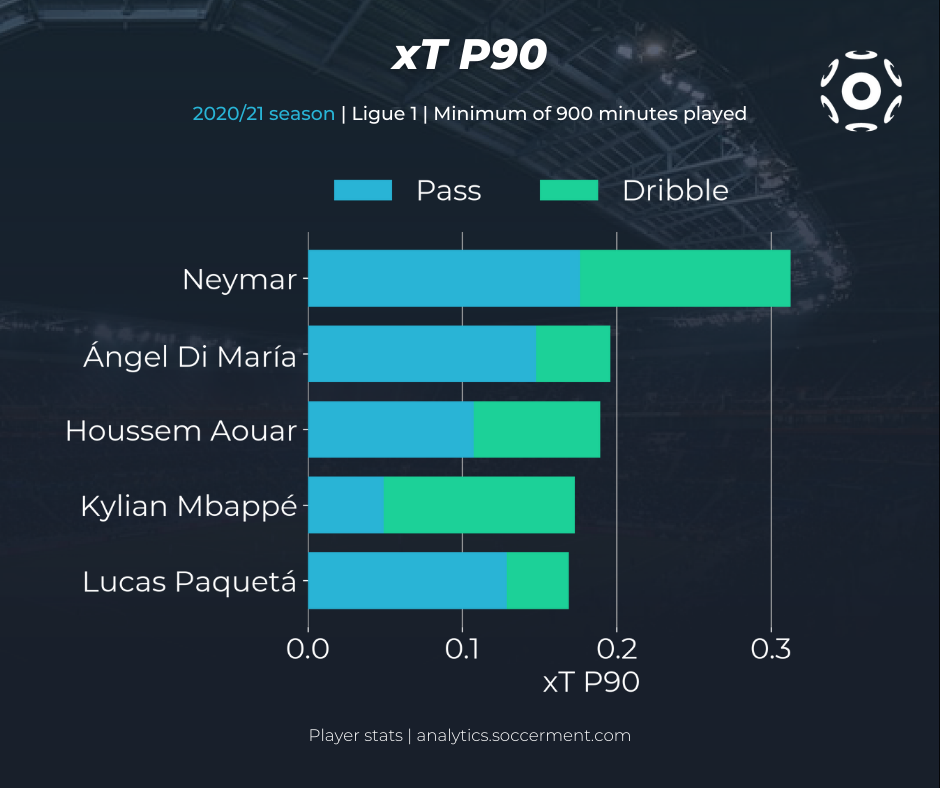
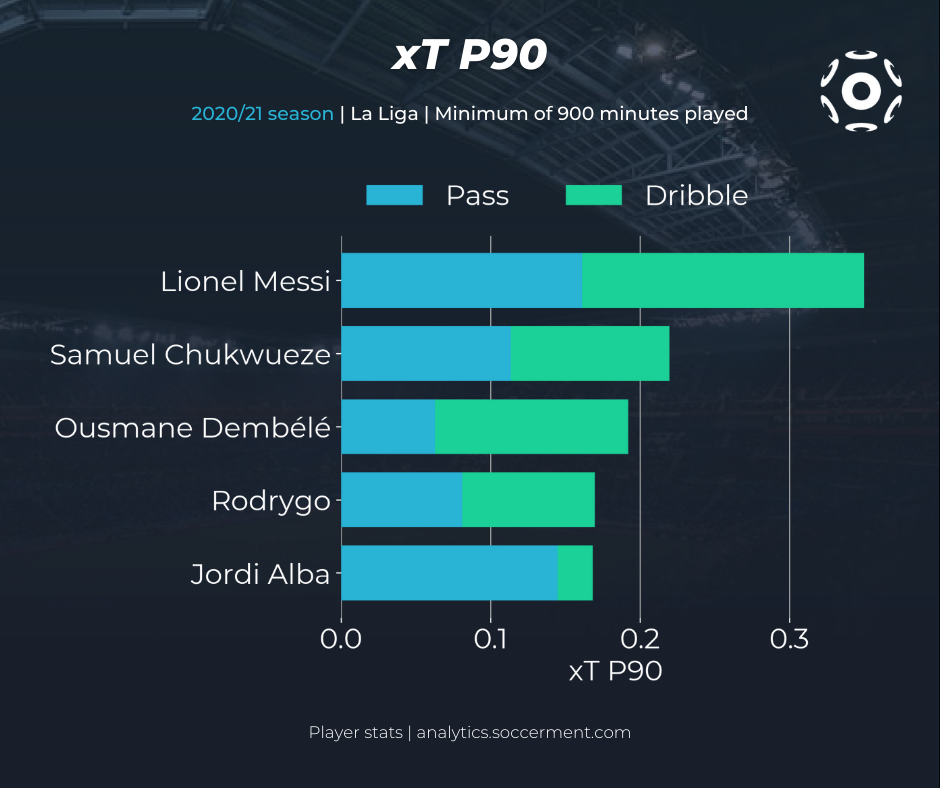
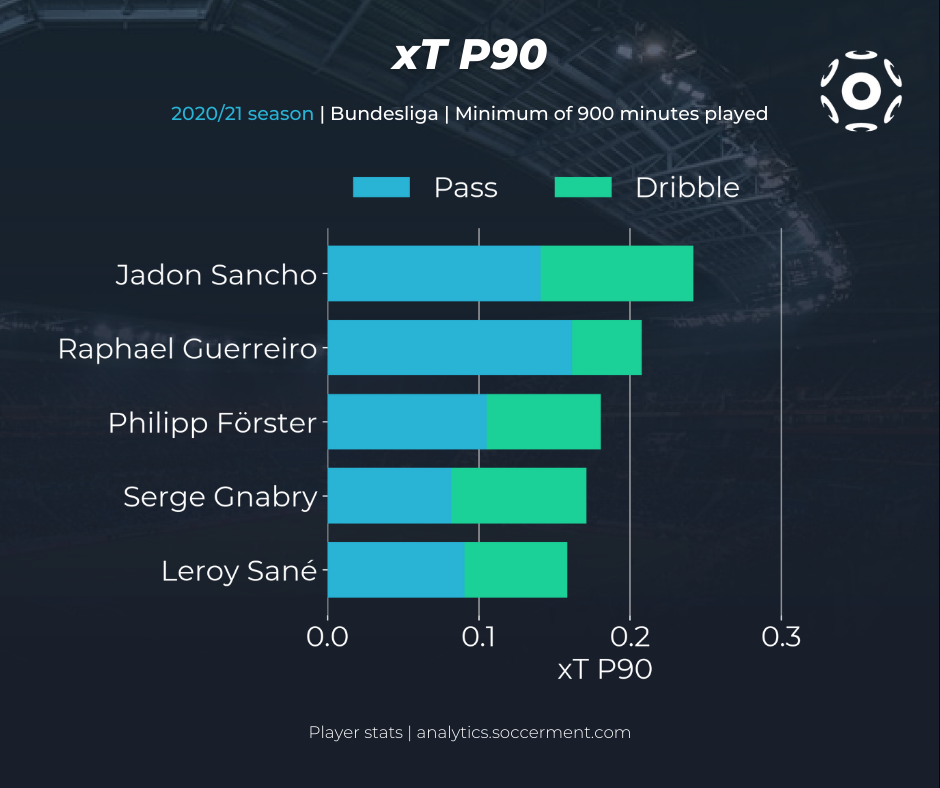
Who are the most "threatening" players?
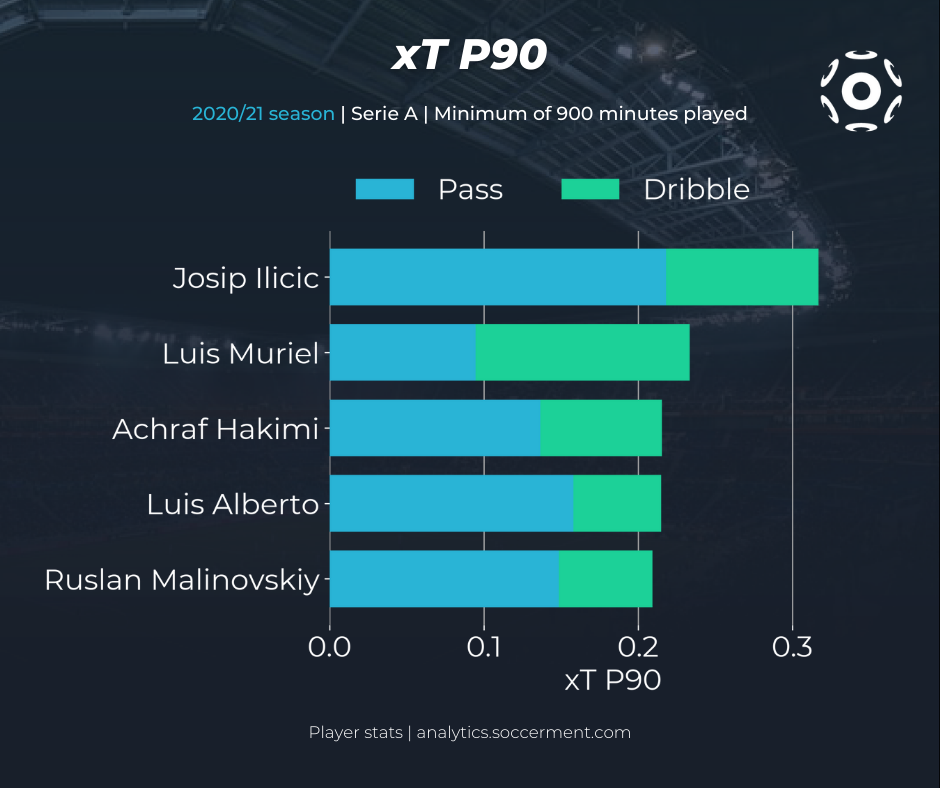
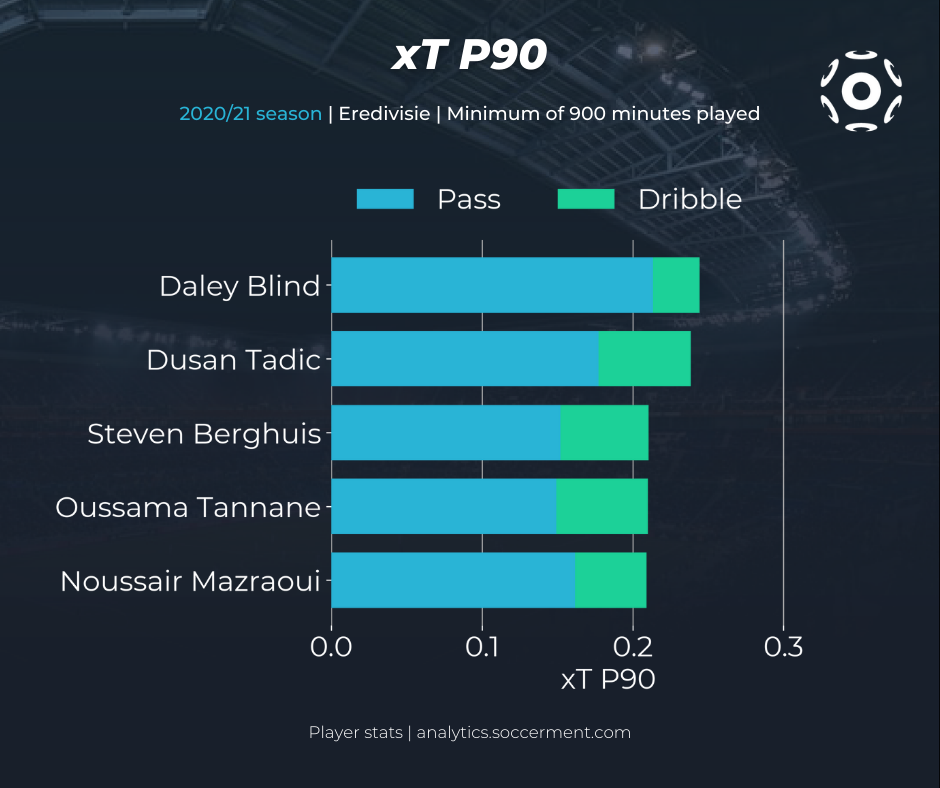
The following charts show the top 5 players for xT P90 in the 2020/21 season across the top 7 leagues. We can see how xT is able to credit not only chance creators who are more directly involved in the final attacking phases (e.g. Messi or Neymar), but also players that make most of their contributions in earlier phases of play and so are not captured by metrics such as xG and xA (Jordi Alba, Blind).
In the following chart we visualize the relationship between xT from passes and xT from dribbles, for players in the top5 leagues with at least 3600 minutes between seasons 2017/18 and 2020/21.
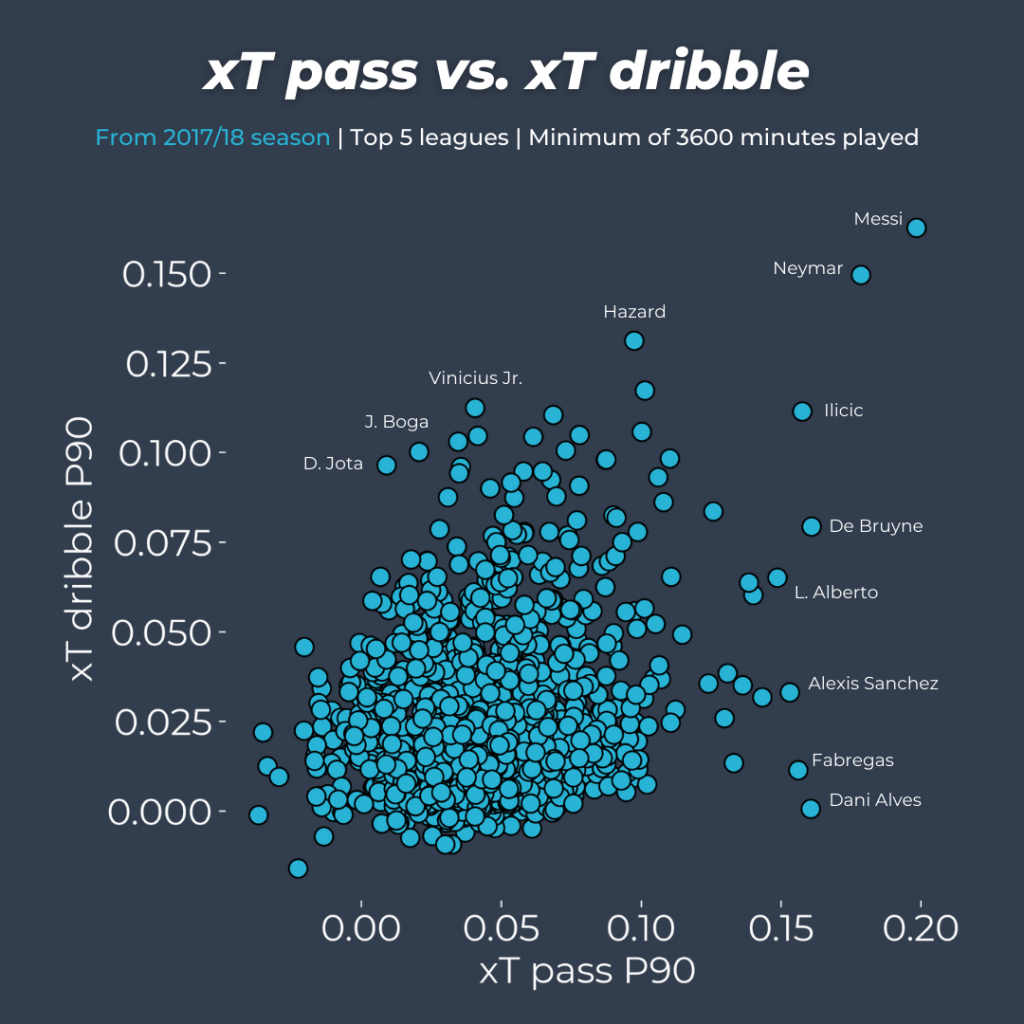
It is no suriprise to find world-class creators such as Messi and Neymar in the top-right corner, brining threat both with passes and carrying the ball themselves. On the right side of the chart we find players who create threat mostly with passes, such as Kevin de Bruyne, but also Barcelona attacking full-back Dani Alves. On the upper side of the distribution we find players who bring more threat by carrying the ball, such as Hazard and Vinicius Jr.
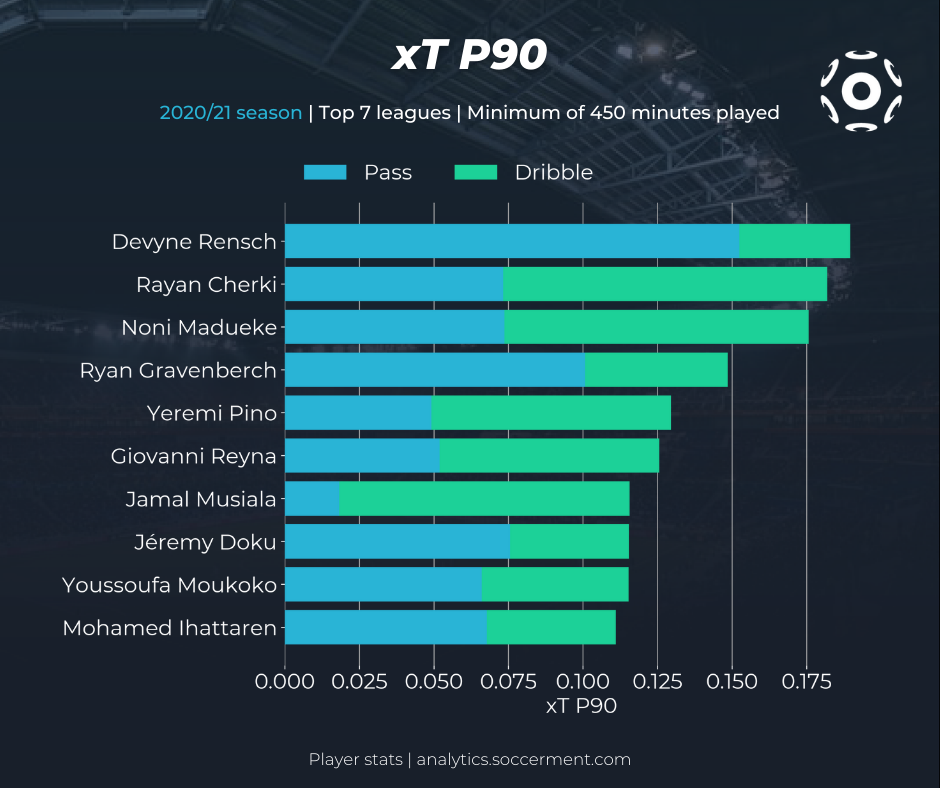
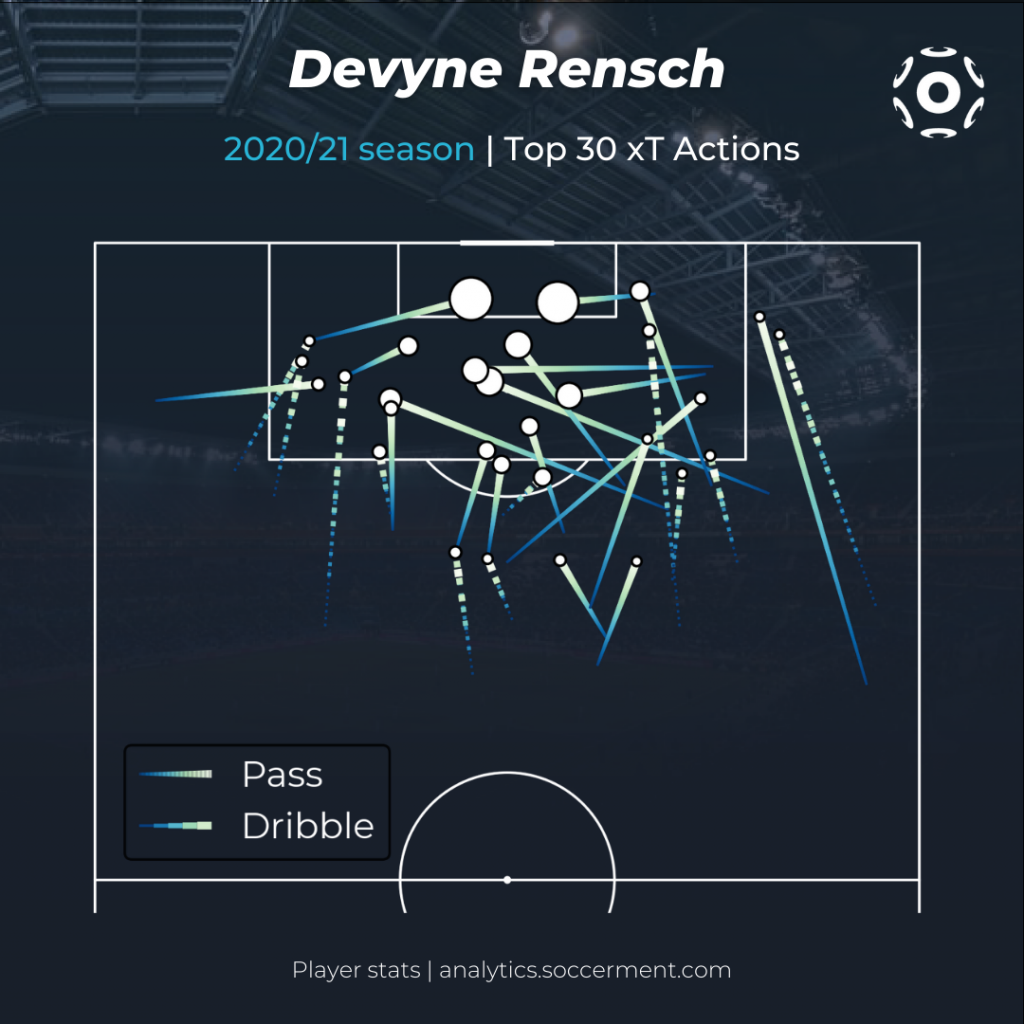
Young threats
By selecting players born after 1 January 2002 we can identify the most "threatening" young talents in elite football, using last season's data. Once again, we see that xT is able to credit players who contribute more to the buildup and ball progression phase than finishing, such as full-back Devyne Rensch or central midfielder Ryan Gravenberch, both at Ajax.
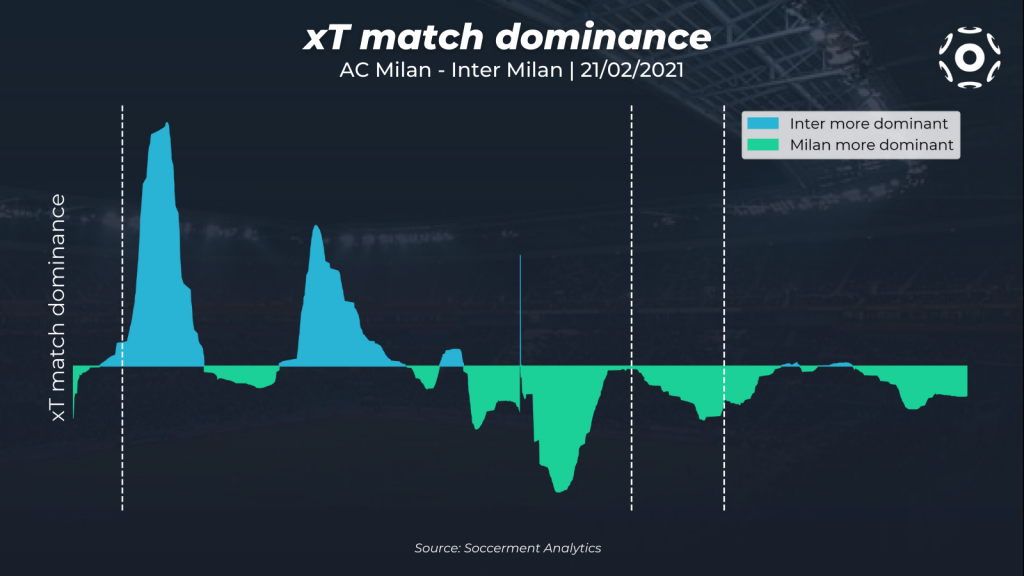
Timeline of xT-based match dominance
By its nature, xT lends itself to be used as a proxy of match dominance, because it shows when a team is able to move the ball into dangerous areas in the opponent's half, regardless of whether or not the possession results in a shot. In the following chart we show a moving average of actions' xT values for each team in the second Milan derby from last season, which Inter Milan won 3-0. The timeline shows that after pushing hard in the first half and getting ahead early, Inter Milan were able to let their rivals attack, withstand the pressure and net with two more goals with fast counter attacks.
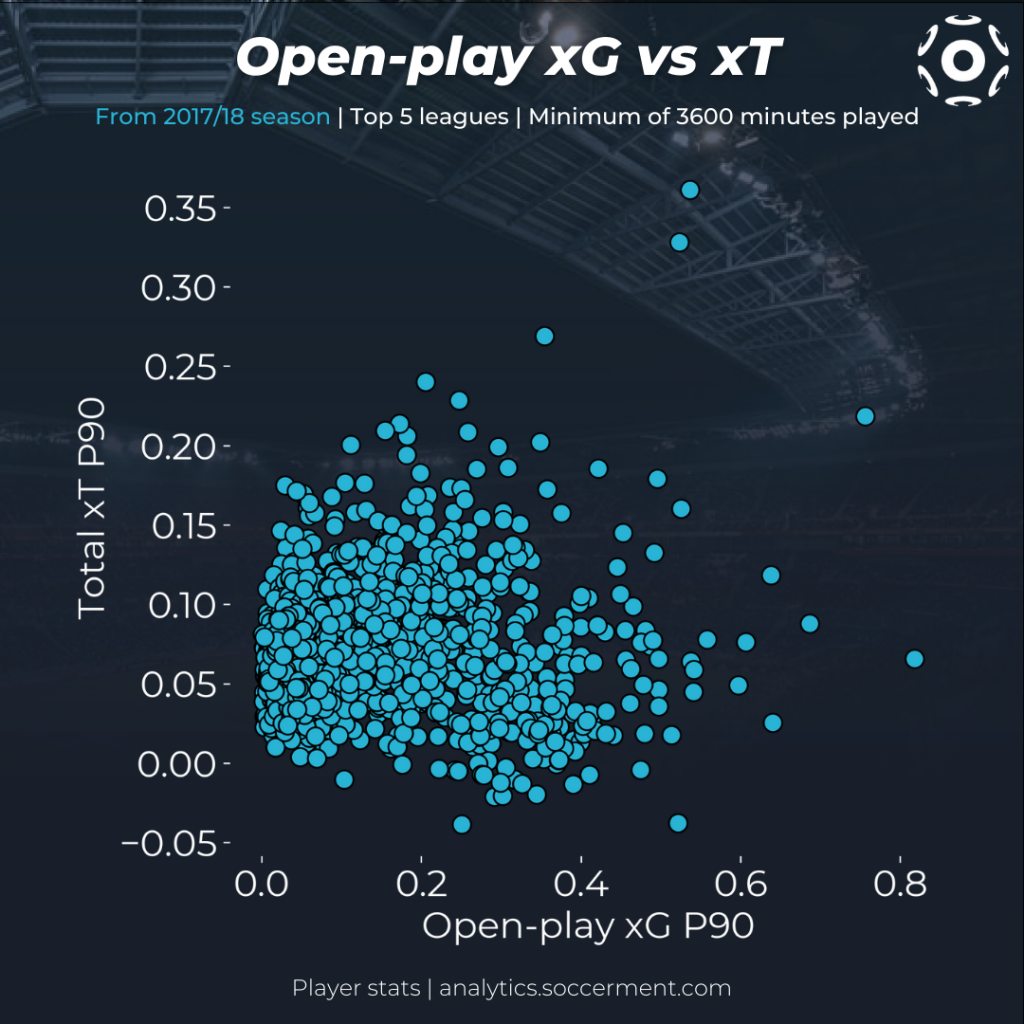
How does xT relate to other advanced metrics?
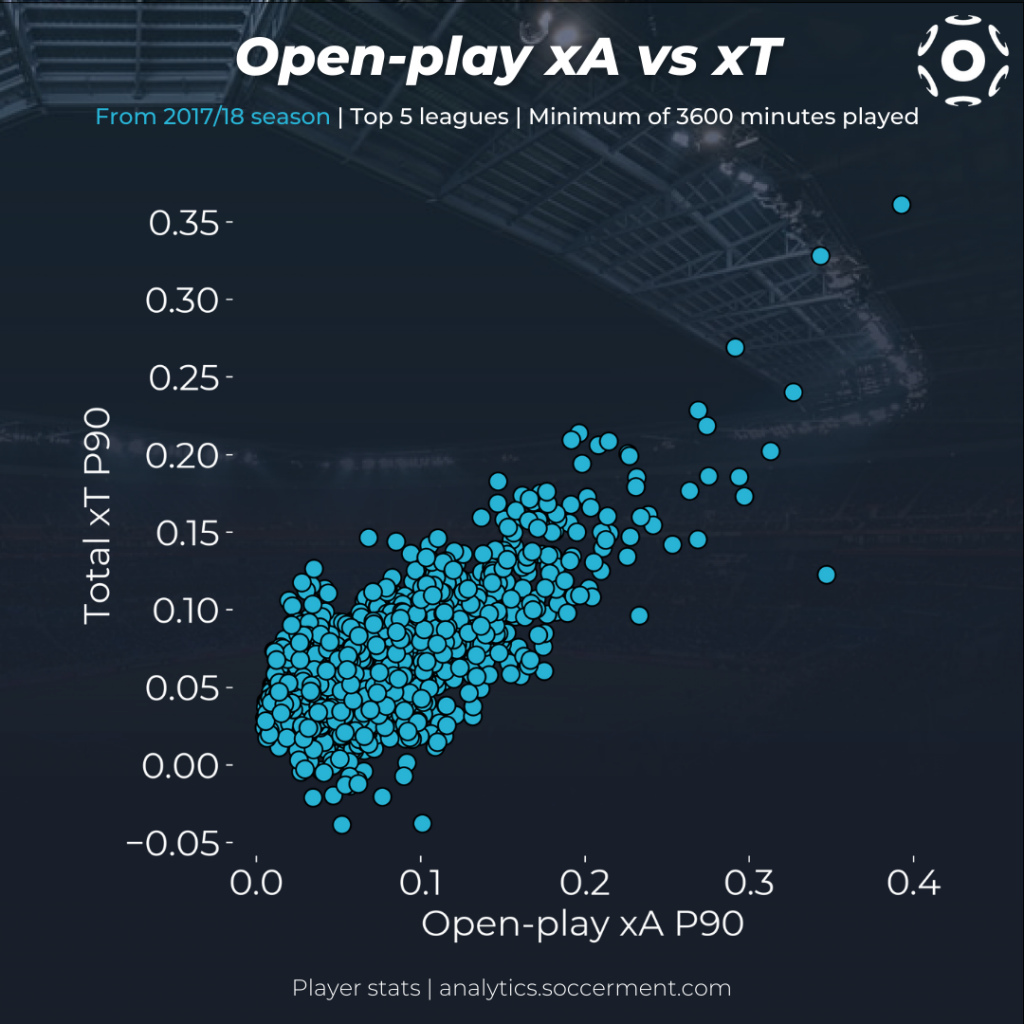
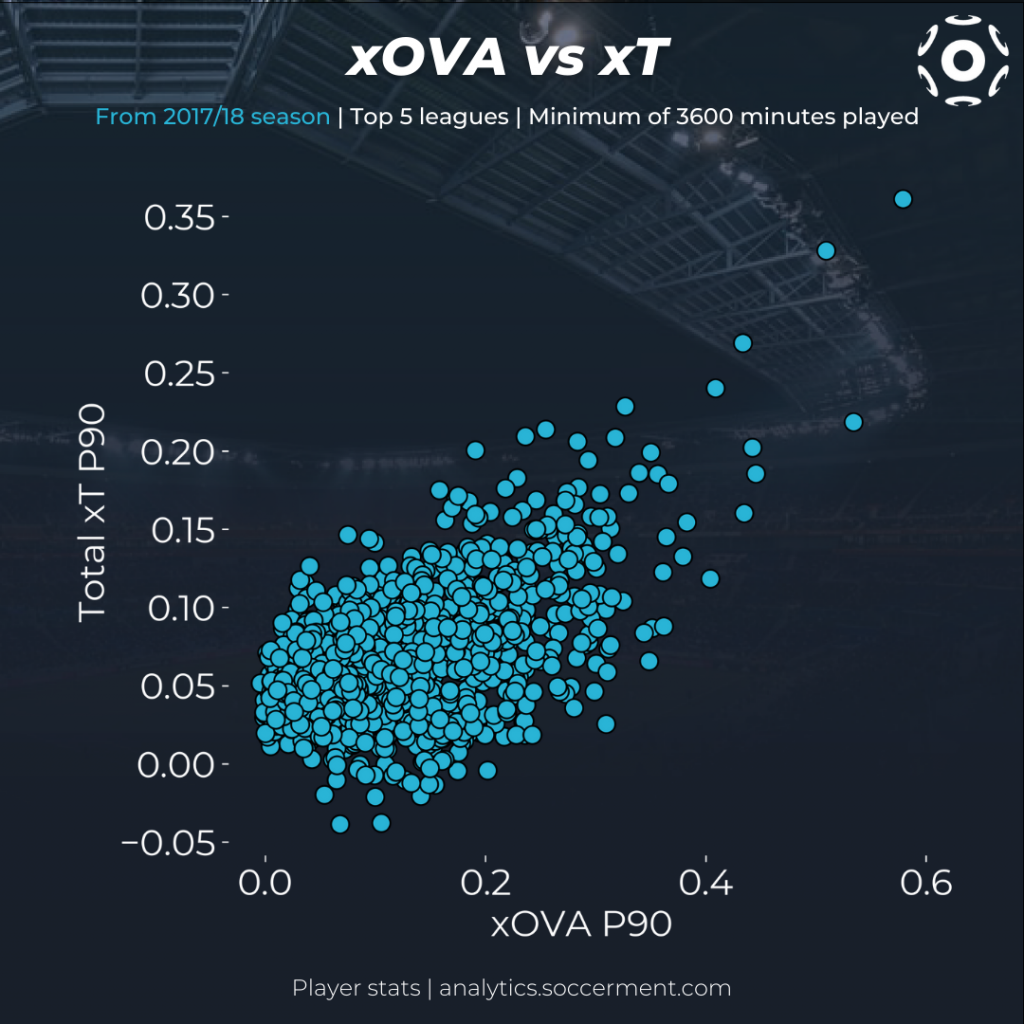
It is interesting to explore how xT relates to other advanced metrics, namely Expected Goals (xG), Expected Assists (xA) and Expected Offensive Value Added (xOVA). For more information regarding our modes, please refer to this post ('Soccerment’s Advanced Metrics', 11 Aug 2021). In the charts below we show scatter plots of total xT with open-play xG, xA and xOVA, using aggregate data from seasons 2017/18 to 2020/21 in the top 5 leagues. It is no surprise to find that xT correlates weakly with xG (r2 = 0.009), while it has a decent correlation with xOVA (r2 = 0.31) and an even better one with xA (r2=0.51). This can be readily explained by the fact that xT is a proxy for skills related to passing and ball progression, rather than shooting.
Given that xOVA is also a way to quantify how much a player increases their team's chances of scoring, it is useful to look at how xT and xOVA are different:
- xT is purely based on the start and end location of passes and dribbles, while the xG and xA models that make up xOVA take into account much more contextual information.
- Through its components, xOVA quantifies direct offensive contributions via expected goals and assists, while xT is able to assign credit to passes and ball carries that may facilitate goals and assists in a less direct way, and does not account for shots.
- xOVA penalizes players for losing the ball after receiving a valuable pass (in the form of xA received) from a teammate, while xT only penalizes actions which move the ball further away from the goal.
For any comment, request or query, please write us to research@soccerment.com.