

Key Insights
- Attacking and defensive trends: How have the offensive and defensive metrics evolved across the Premier League, Serie A, La Liga, Bundesliga, and Ligue 1?
- Offensive efficiency: Which leagues and teams have improved their goal-scoring output, shot quality, and chance creation?
- Defensive solidity: Which teams have tightened their defensive structures, reduced expected goals conceded, and improved pressing intensity?
- Tactical shifts: Understanding how strategic adjustments have influenced teams’ performances.
Introduction
The ever-evolving landscape of European football offers an intriguing opportunity to analyze how teams adapt, evolve, and shift their tactical priorities from one season to the next. With the 2024/25 season heading into its final third, it is time to take a data-driven deep dive into the Premier League, Serie A, La Liga, Bundesliga, and Ligue 1, comparing key metrics from last season to the current one.
Through a series of scatter plots, we will explore critical team performance metrics for each league:
- Attacking metrics, highlighting shifts in shot volume and quality with Expected Goals (xG), as well as territorial dominance (field tilt) and opposition box touches
- Defensive metrics, examining changes in the volume and quality of shots conceded with Expected Goals against (xGA), as well as present intensity (PPDA) and efficiency (BDP)
By identifying statistical trends, emerging patterns, and standout teams, we can uncover the tactical and strategic transformations shaping European football’s elite leagues. Which teams have taken a step forward? Which ones have regressed? Let’s explore the data and uncover the key insights behind the numbers.
PREMIER LEAGUE: OFFENSIVE PHASE
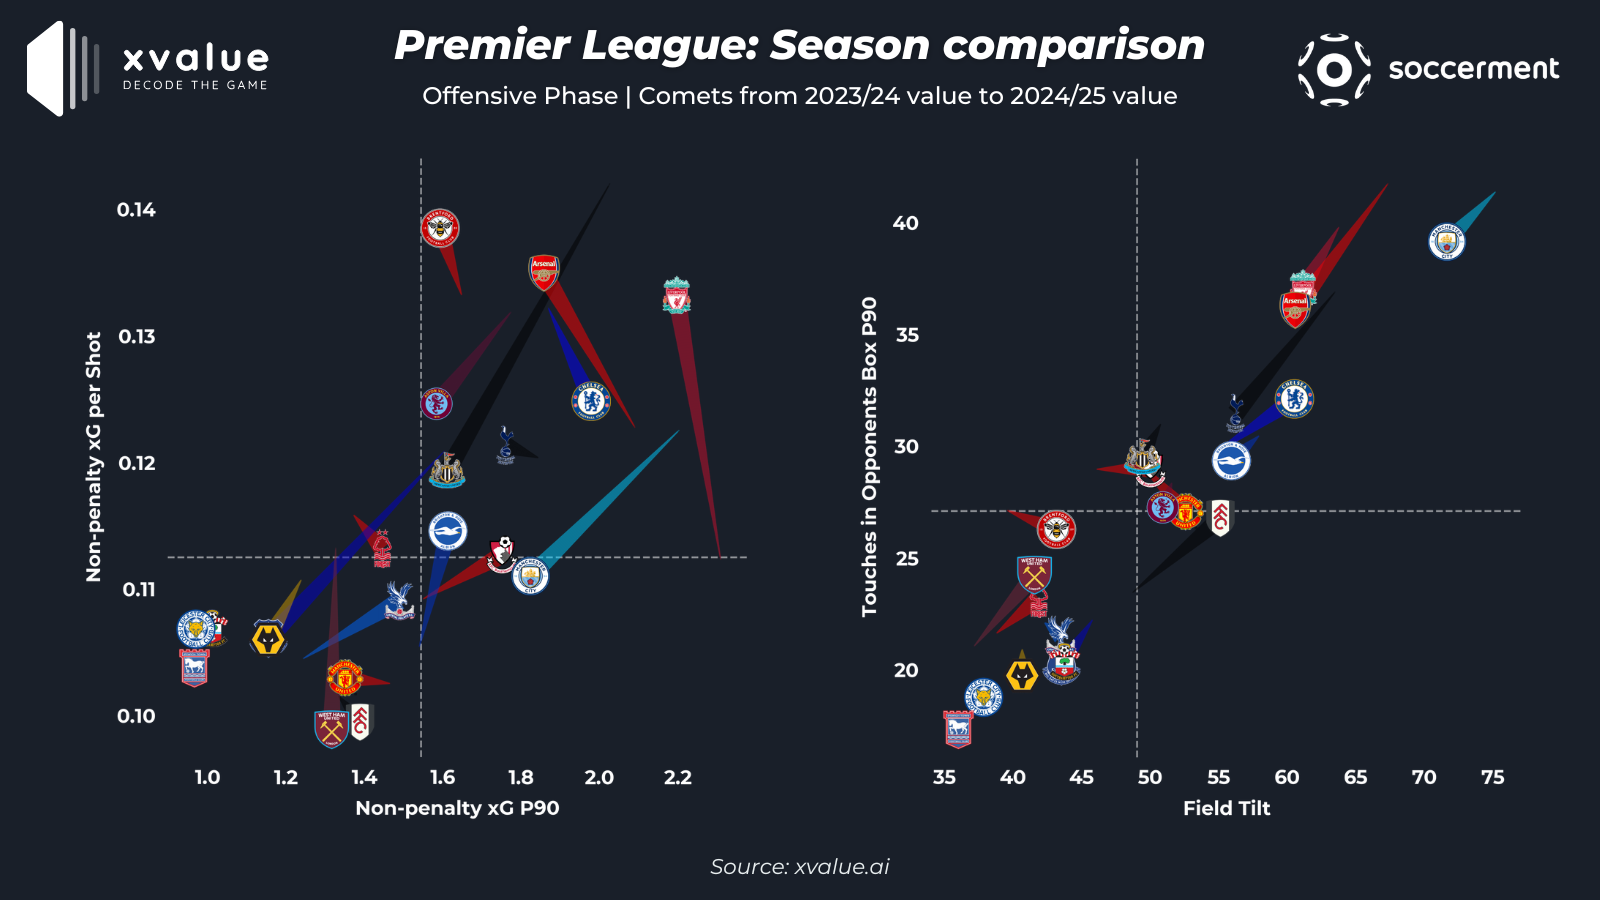
1° – npxG P90 vs npxG per Shot:
In the first scatter plot, we analyze offensive threat through non-penalty Expected Goals (npxG) per 90 minutes and non-penalty Expected Goals per shot.
One of the most striking changes comes from Liverpool and Arsenal, both of whom have significantly increased their npxG per shot. Arsenal has improved from just over 0.12 to a value 0.13, indicating that they are now creating higher-quality shooting opportunities. Liverpool’s increase is even more pronounced, jumping from just above 0.11 to over 0.13, showcasing their improved shot selection and ability to generate dangerous scoring chances. Both Liverpool and Arsenal are, at the same time, taking fewer shots, so that their total xG produced have decreased, marginally for the Reds, and more significantly for the Gunners.
On the other hand, Newcastle, Manchester City, Everton, and Aston Villa have all declined in both metrics, becoming less threatening in front of goal in both quantity and quality. Newcastle has seen the most drastic drop, going from leading the league in npxG per shot last season to a mid-table position this year, a significant regression in their attacking efficiency.
Meanwhile, Manchester City-currently enduring their most challenging season under Pep Guardiola-have experienced a clear decline in offensive effectiveness. Their npxG per shot have dropped from 0.12 to 0.11, and their overall npxG per 90 have fallen from 2.2 to 1.8, suggesting a less dominant attacking output compared to last season.
Another key observation is the evolution of Chelsea under Enzo Maresca. While the Blues have slightly decreased their npxG per shot, they have increased their overall npxG per 90 minutes, now sitting second behind Liverpool in this category. This suggests a shift toward a more volume-based approach in attack, possibly reflecting Maresca’s tactical influence.
2° – Field Tilt vs Touches in Opponent Box P90
The second scatter plot examines possession dominance and attacking territory control, using Field Tilt and Touches in the Opponent’s Box per 90 minutes.
A key trend emerging this season is the decline in both metrics for last year’s top four teams: Manchester City, Liverpool, Arsenal, and Tottenham. While these teams remain among the league’s most dominant, their Field Tilt and box touches have dropped compared to the 2023/24 season.
A notable exception is Chelsea, who have overtaken Tottenham in these categories, climbing into the top four in terms of possession control and attacking presence in the opponent’s box. This shift suggests a growing tactical emphasis on territorial dominance under Maresca, reinforcing their attacking intent and structured buildup play.
Further down the table, Fulham and West Ham have shown significant improvements in both metrics, suggesting a more proactive approach in possession and increased attacking presence compared to last season. These shifts indicate potential tactical adjustments that have made them more competitive in sustaining possession and creating opportunities in advanced areas.
PREMIER LEAGUE: DEFENSIVE PHASE
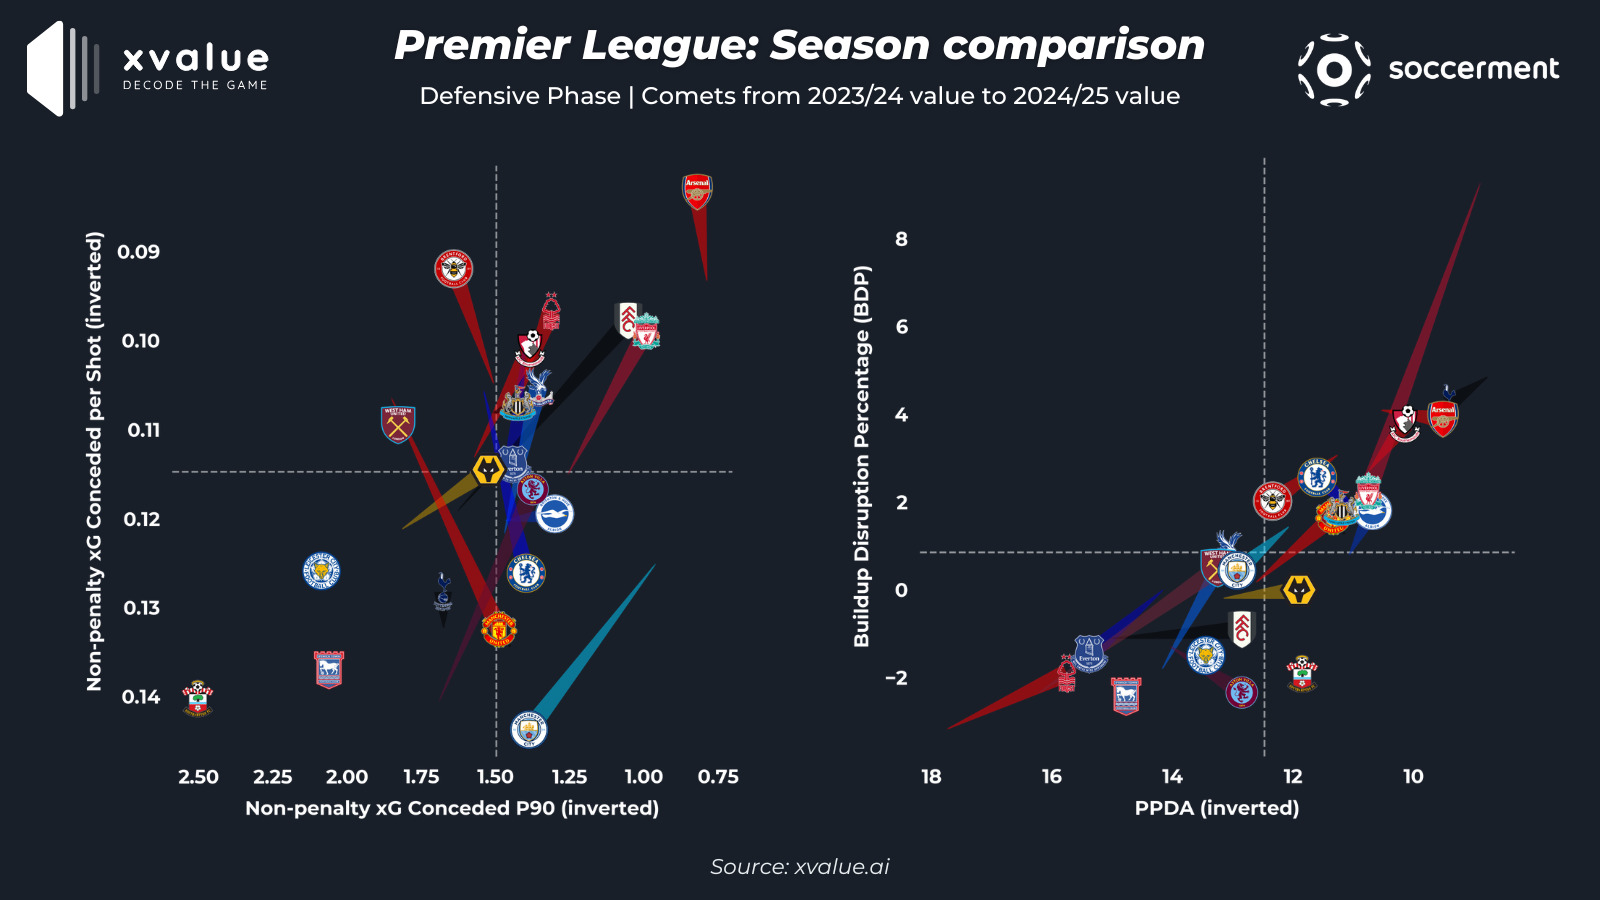
3° – npxGA P90 vs npxGA per Shot
Switching to defensive performance, the third scatter plot evaluates defensive vulnerability, using non-penalty Expected Goals Against (npxGA) per 90 minutes and npxGA per shot.
Arsenal continue to lead the league in defensive solidity, having been the best team in this category last season and further improving this year, particularly in limiting high-quality chances per shot conceded. This highlights Mikel Arteta’s structured defensive approach, which has made the Gunners even more resilient at the back.
Another team that has shown improvement is Brentford, who have reduced their npxGA per shot, though their overall npxGA per 90 has slightly worsened.
Positive defensive developments are also evident for Liverpool, Fulham, Nottingham Forest, and Aston Villa, all of whom have improved in both metrics, indicating greater defensive compactness and reduced vulnerability to high-quality opposition chances.
Conversely, both Manchester clubs have seen defensive declines. Manchester United have dramatically worsened in npxGA per shot, meaning they are conceding higher-quality chances per attempt, although they have shown some improvement in overall npxGA per 90 minutes.
Manchester City, however, have regressed in both metrics, further confirming the struggles of Guardiola’s side this season. Their defensive decline-combined with their attacking inefficiencies-suggests broader structural issues affecting the team’s overall performance.
4° – PPDA vs BDP
The fourth and final scatter plot focuses on defensive style and pressing intensity, comparing Passes per Defensive Action (PPDA) and Build-Up Disruption Percentage (BDP) to assess pressing efficiency.
One of the most striking observations is Liverpool’s reduced pressing intensity following the managerial transition from Jürgen Klopp to Arne Slot. Liverpool had the most aggressive and effective press in the league during most of Klopp’s tenure. However, with a clear shift in tactical approach, their pressing frequency has noticeably declined, though their overall defensive performances remain strong.
Several teams have increased their pressing intensity, with notable improvements from:
- Nottingham Forest, who, despite still ranking last in these metrics, have significantly closed the gap with other teams compared to last season.
- West Ham, who have moved closer to mid-table in pressing intensity, suggesting a shift toward more aggressive defensive engagement.
- Manchester United, who appear more proactive and efficient in their pressing, indicating a potential tactical adaptation aimed at regaining control in defensive transitions.
LA LIGA: OFFENSIVE PHASE
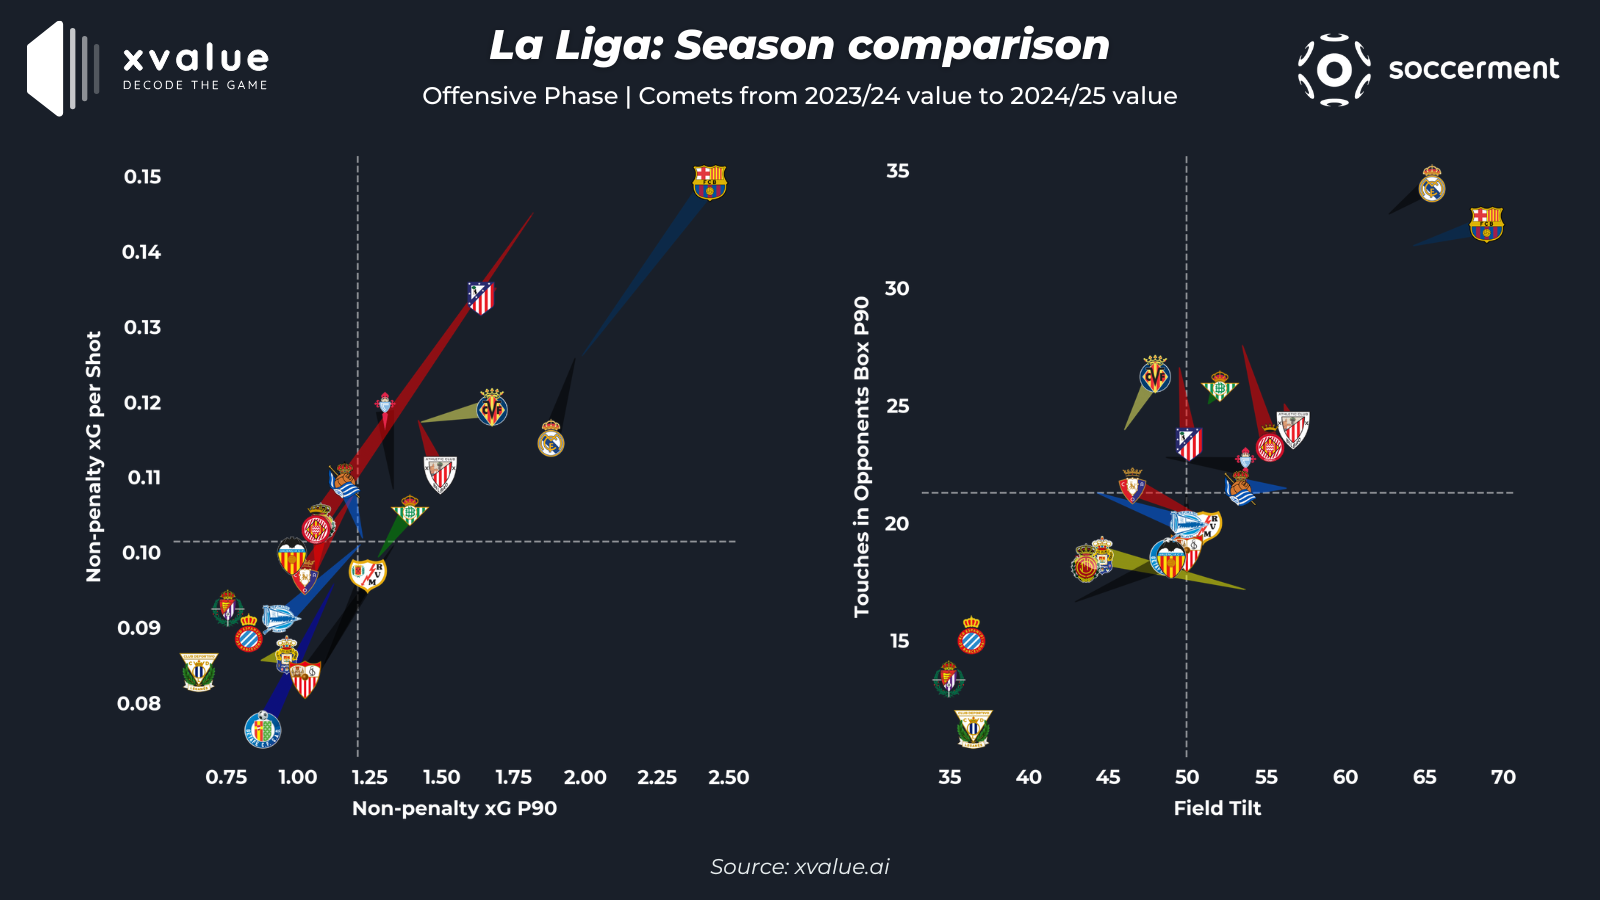
1° – npxG P90 vs npxG per Shot:
Analyzing offensive effectiveness through the first scatter plot, one of the most striking takeaways is Barcelona’s remarkable improvement under Hansi Flick. The Catalan side now leads La Liga in both npxG per shot and npxG per 90 minutes, showing a significant step forward in their attacking efficiency.
Barcelona’s npxG per shot has increased from just under 0.13 to 0.15, while their npxG per 90 has surged from 1.80 to an impressive 2.50. These numbers reflect a more dangerous and well-structured attacking unit, likely influenced by Flick’s tactical adjustments, which have optimized Barcelona’s shot selection and overall offensive output.
On the opposite end of the spectrum, Girona have suffered a dramatic decline in attacking potency. Last season, Girona topped the league in npxG per shot, but this year, they have dropped to a mid-table position in the same category. Similarly, their npxG per 90 has fallen from third place to a mid-table ranking, indicating a significant decrease in offensive effectiveness. This decline could be attributed to tactical shifts, player departures, or a general regression in their attacking play.
2° – Field Tilt vs Touches in Opponent Box P90
The second scatter plot provides insights into possession dominance and attacking territory control by analyzing Field Tilt and Touches in the Opponent’s Box per 90 minutes.
One of the key takeaways is that not much has changed at the top compared to last season. Real Madrid and Barcelona continue to dominate these metrics, further consolidating their territorial control and attacking presence. Both teams have even slightly improved in these areas, increasing their ability to dictate play and maintain pressure in the final third.
Conversely, Girona’s decline is again evident. While they have shown a slight improvement in Field Tilt, their Touches in the Opponent’s Box per 90 minutes have decreased, suggesting a less effective penetration in attacking areas. This reinforces the idea that Girona’s overall attacking threat has diminished compared to last season.
A notable tactical shift is observed with Las Palmas, who have experienced a significant drop in Field Tilt, falling from 55% to 45%. This suggests a more defensive and reactive approach, potentially reflecting a shift in tactical priorities aimed at conserving defensive solidity rather than maintaining possession dominance.
LA LIGA: DEFENSIVE PHASE
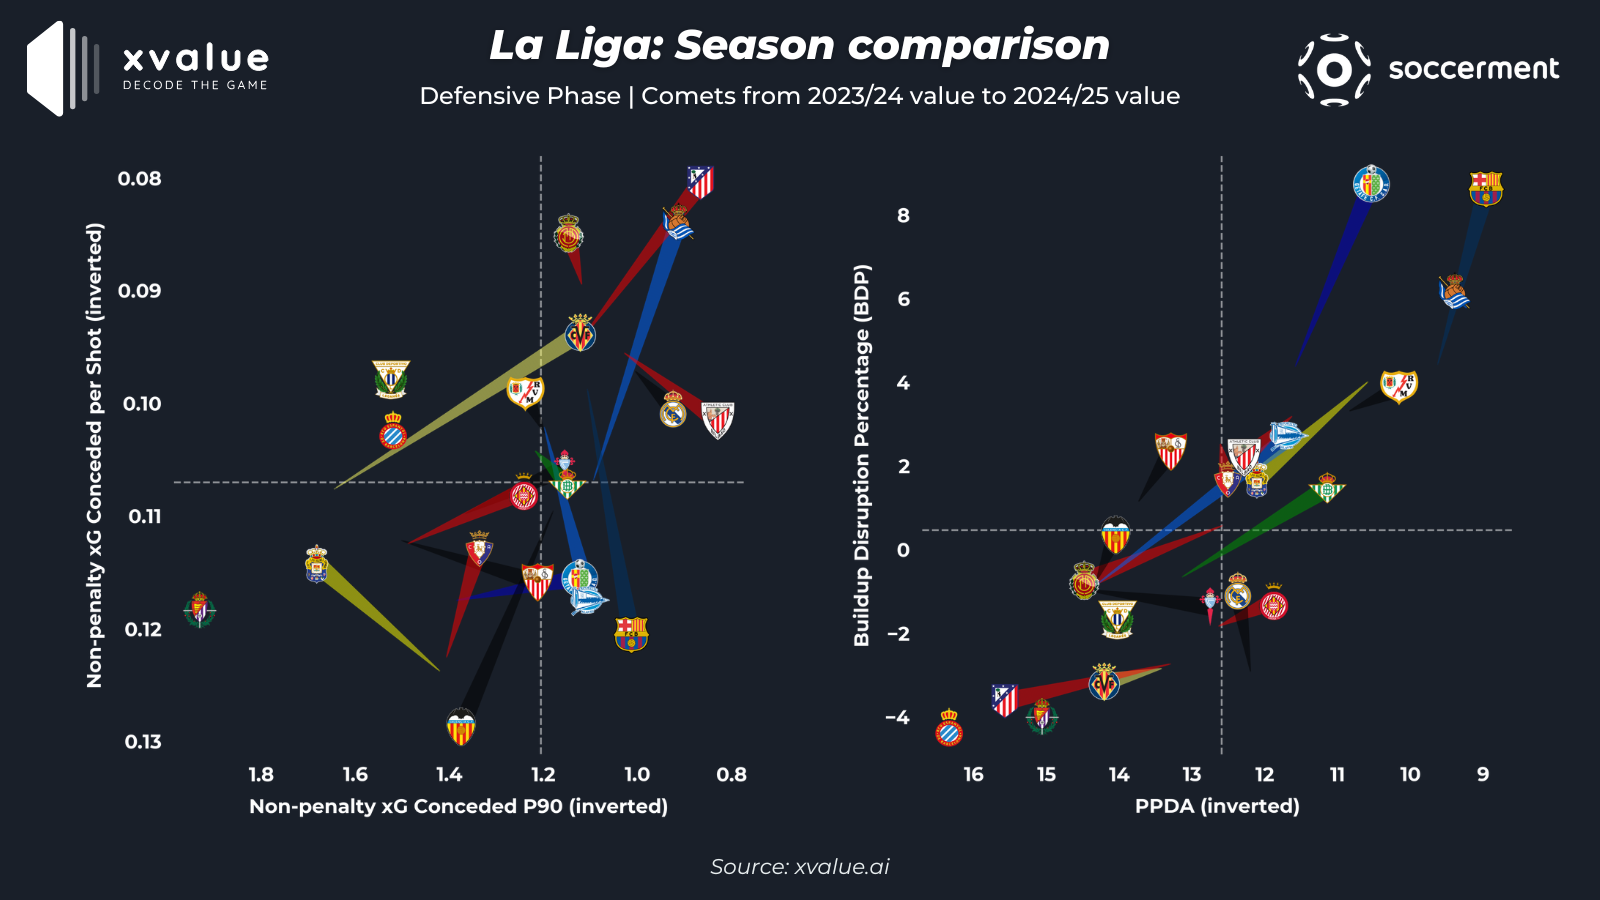
3° – npxGA P90 vs npxGA per Shot
The third scatter plot shifts the focus to defensive vulnerability, evaluating non-penalty Expected Goals Against (npxGA) per 90 minutes and npxGA per shot.
One of the most notable improvements comes from Atlético Madrid, who now lead the league in npxGA per shot, showcasing significant defensive enhancements compared to last season. Diego Simeone’s side has further reinforced its defensive compactness, limiting opponents to lower-quality chances per shot conceded.
Similarly, Real Sociedad and Villarreal have also made significant strides in defensive stability, reducing their vulnerability and limiting opponents’ high-quality scoring opportunities. Villarreal, in particular, has achieved a substantial improvement in overall npxGA per 90 minutes, dropping from 1.7 last season to just above 1 this season.
On the other hand, Barcelona’s defensive performance has taken a step back. While excelling in attack, they have regressed in npxGA per shot, ranking among the worst-performing teams in this category. This suggests a potential trade-off between attacking dominance and defensive stability, as their aggressive offensive style might be exposing them more to dangerous counterattacks.
Similarly, Valencia have seen a drastic decline in defensive performance, struggling in both npxGA per 90 and npxGA per shot. This defensive fragility is likely one of the key reasons behind their disappointing season so far. Their struggles highlight potential structural or tactical deficiencies that have left them increasingly vulnerable.
4° – PPDA vs BDP
The final scatter plot focuses on pressing intensity and defensive disruption, analyzing Passes per Defensive Action (PPDA) and Build-Up Disruption Percentage (BDP) to assess teams’ pressing effectiveness.
A major positive shift is observed in Barcelona and Getafe, both of whom have become more aggressive and effective in high pressing. Their improvement in pressing intensity and efficiency indicates a more proactive defensive approach, aimed at winning possession higher up the pitch and limiting opposition build-up play.
Conversely, Atlético Madrid have become increasingly conservative, as evidenced by a higher PPDA (indicating less pressing intensity). This tactical adjustment suggests a more structured and deeper defensive approach, prioritizing compactness over aggressive ball-winning high up the field. However, this shift has not necessarily translated into greater pressing effectiveness, as their overall pressing efficiency has slightly declined. This could mean that while they are pressing less frequently, they are not necessarily pressing more effectively when they do engage.
SERIE A: OFFENSIVE PHASE
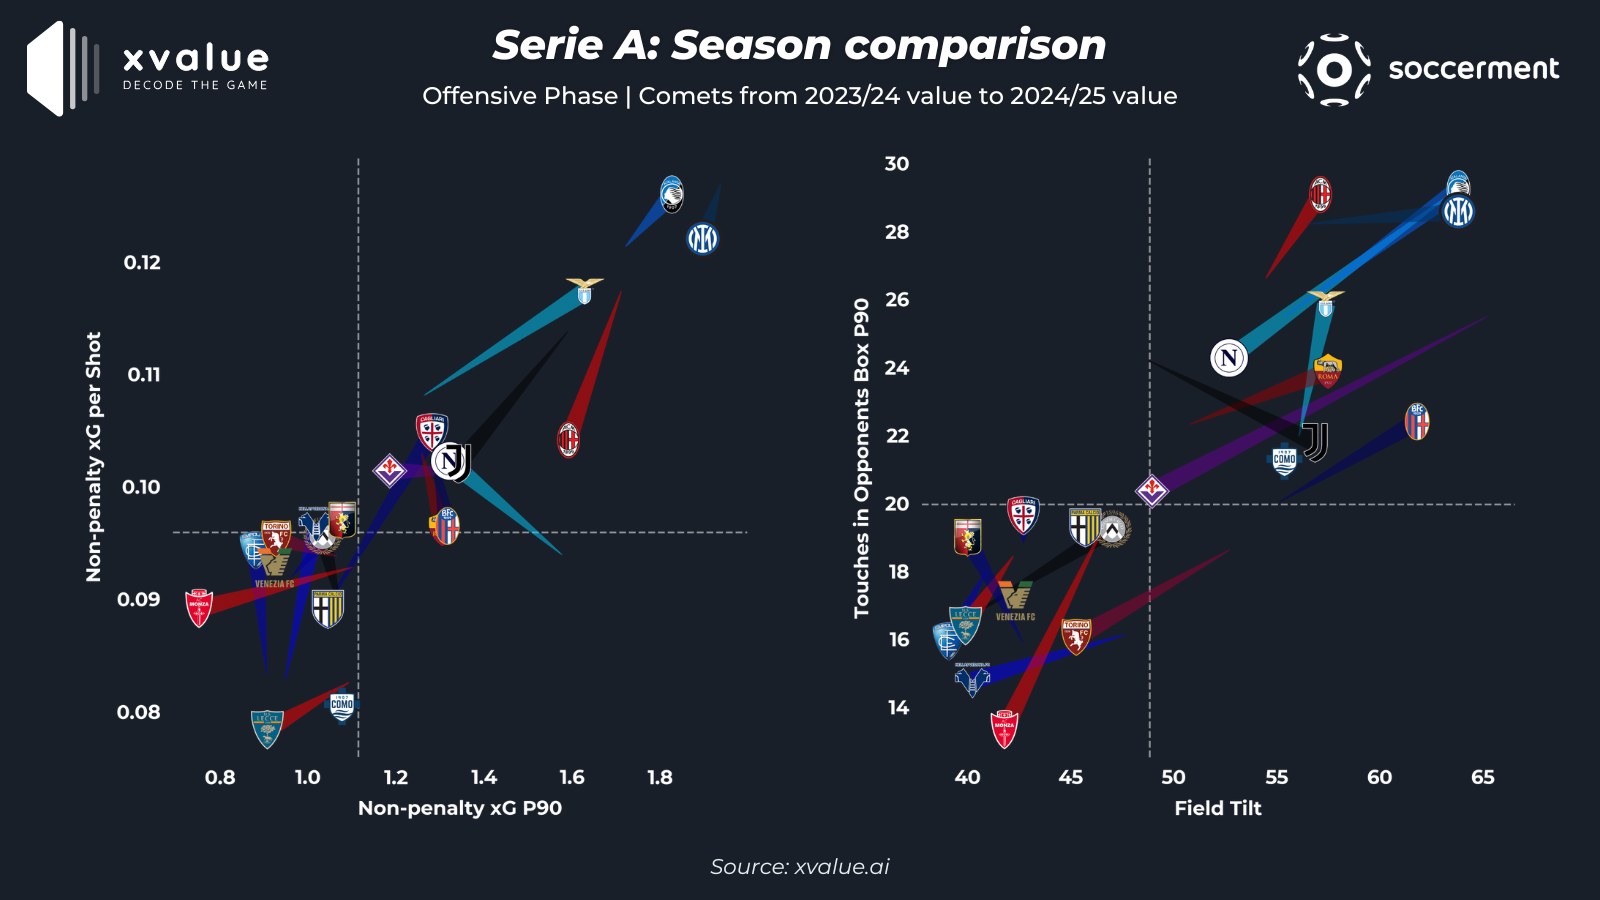
1° – npxG P90 vs npxG per Shot:
Moving on to Serie A, the first scatter plot analyzes offensive threat using the non-penalty Expected Goals (npxG) per 90 minutes and npxG per shot metrics. The top two positions remain unchanged from last season, with Atalanta and Inter leading the rankings. However, while Inter has seen a slight decline in its offensive efficiency, Atalanta have improved marginally, further strengthening its attacking system under Gasperini’s management.
One of the biggest surprises this season is Lazio, which have climbed to third place in both metrics. Baroni’s arrival has significantly enhanced the team’s attacking effectiveness, reflecting a more productive and incisive offensive approach. On the other hand, Juventus and Milan have both declined in these metrics, likely due to managerial changes that have disrupted their tactical continuity. Milan, in particular, have faced two coaching transitions this season, inevitably affecting its overall performance.
Napoli present a mixed picture. On the one hand, they have improved in terms of npxG per shot, indicating better shot selection. However, they have slightly declined in npxG per 90 minutes, suggesting a lower overall volume of goal-scoring opportunities despite greater efficiency in finishing.
2° – Field Tilt vs Touches in Opponent Box P90
The second scatter plot examines playing style by analyzing Field Tilt and touches in the opponent’s box per 90 minutes. Compared to last season, significant differences emerge, largely influenced by the many managerial changes across teams.
One of the most notable declines involves Fiorentina, which have suffered a sharp drop in both metrics following Vincenzo Italiano’s departure and Raffaele Palladino’s arrival. In contrast, Bologna have made a significant leap forward thanks to Italiano’s more proactive approach, improving both in controlling the game and in creating more touches in the opposition’s penalty area.
Napoli have also seen a decline in territorial dominance under Antonio Conte, who has prioritized a more structured and compact system with less emphasis on ball possession. Meanwhile, Atalanta continue to grow, ranking among the top teams in both metrics and confirming its aggressive and attacking playing style. Juventus, despite improving its Field Tilt, have seen a reduction in touches inside the opponent’s box, indicating less attacking penetration.
SERIE A: DEFENSIVE PHASE
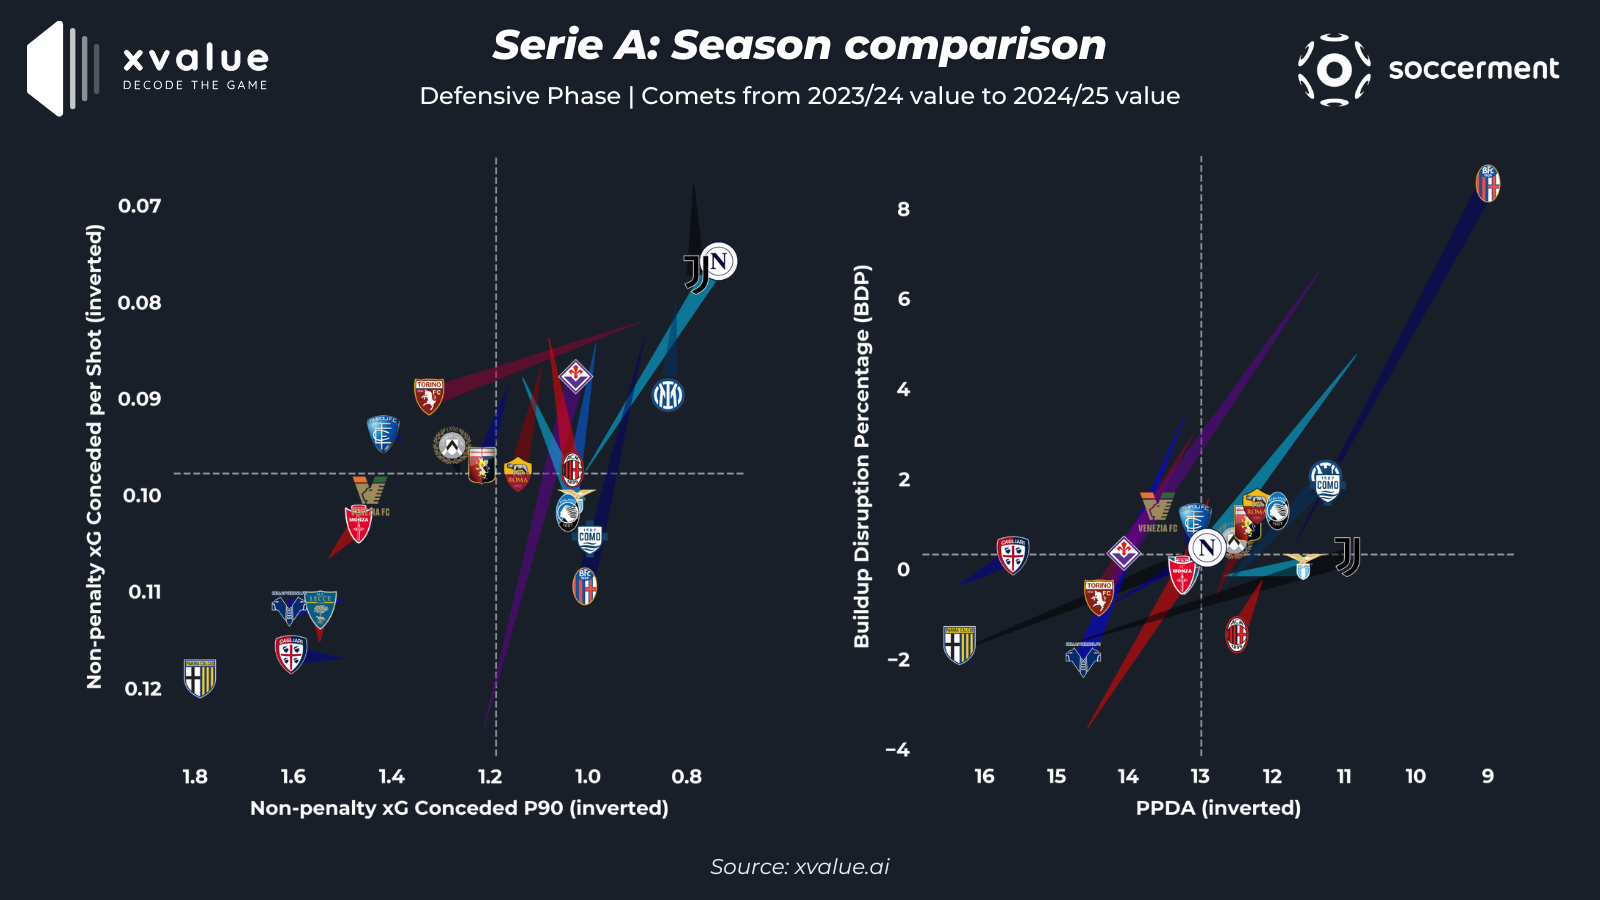
3° – npxGA P90 vs npxGA per Shot
Shifting to defensive performance, the third scatter plot highlights changes in team vulnerability through the non-penalty Expected Goals Against (npxGA) per 90 minutes and npxGA per shot metrics. Two of the most improved teams are Napoli and Fiorentina, both significantly reducing their defensive fragility under new leadership. Napoli, under Conte, have reinforced its defensive compactness and organization, while Fiorentina, now managed by Palladino, have found greater stability compared to the previous season.
Conversely, several teams have shown a decline in defensive solidity. Torino under Paolo Vanoli and Bologna under Italiano have suffered notable drops, likely due to a more aggressive playing style that leaves them more exposed. Milan and Lazio have also become more vulnerable, worsening in terms of the quality of chances conceded, although both have slightly improved their overall npxGA per 90 minutes by allowing fewer total shots. Atalanta, however, have worsened in both metrics, conceding more chances and of higher quality compared to last season.
4° – PPDA vs BDP
Finally, the fourth scatter plot evaluates defensive style through the PPDA and BDP metrics, which measure pressing intensity and the ability to disrupt the opponent’s buildup. Bologna, under Vincenzo Italiano, have undergone the most drastic transformation, distancing itself significantly from the rest of Serie A with an extremely high and effective pressing strategy.
Juventus have also improved considerably, adopting a more aggressive defensive approach. Another team on the rise is Udinese, which have climbed from the lower rankings to a mid-table position in terms of pressing intensity.
On the other hand, some teams have experienced a sharp decline. Fiorentina, after Italiano’s departure, have lost its ultra-aggressive pressing identity, significantly reducing its defensive intensity. Napoli, under Conte, have also lowered its pressing intensity, favoring a more compact and conservative defensive strategy. Torino and Hellas Verona have both seen declines in these metrics, indicating a more cautious and less aggressive pressing approach.
BUNDESLIGA: OFFENSIVE PHASE
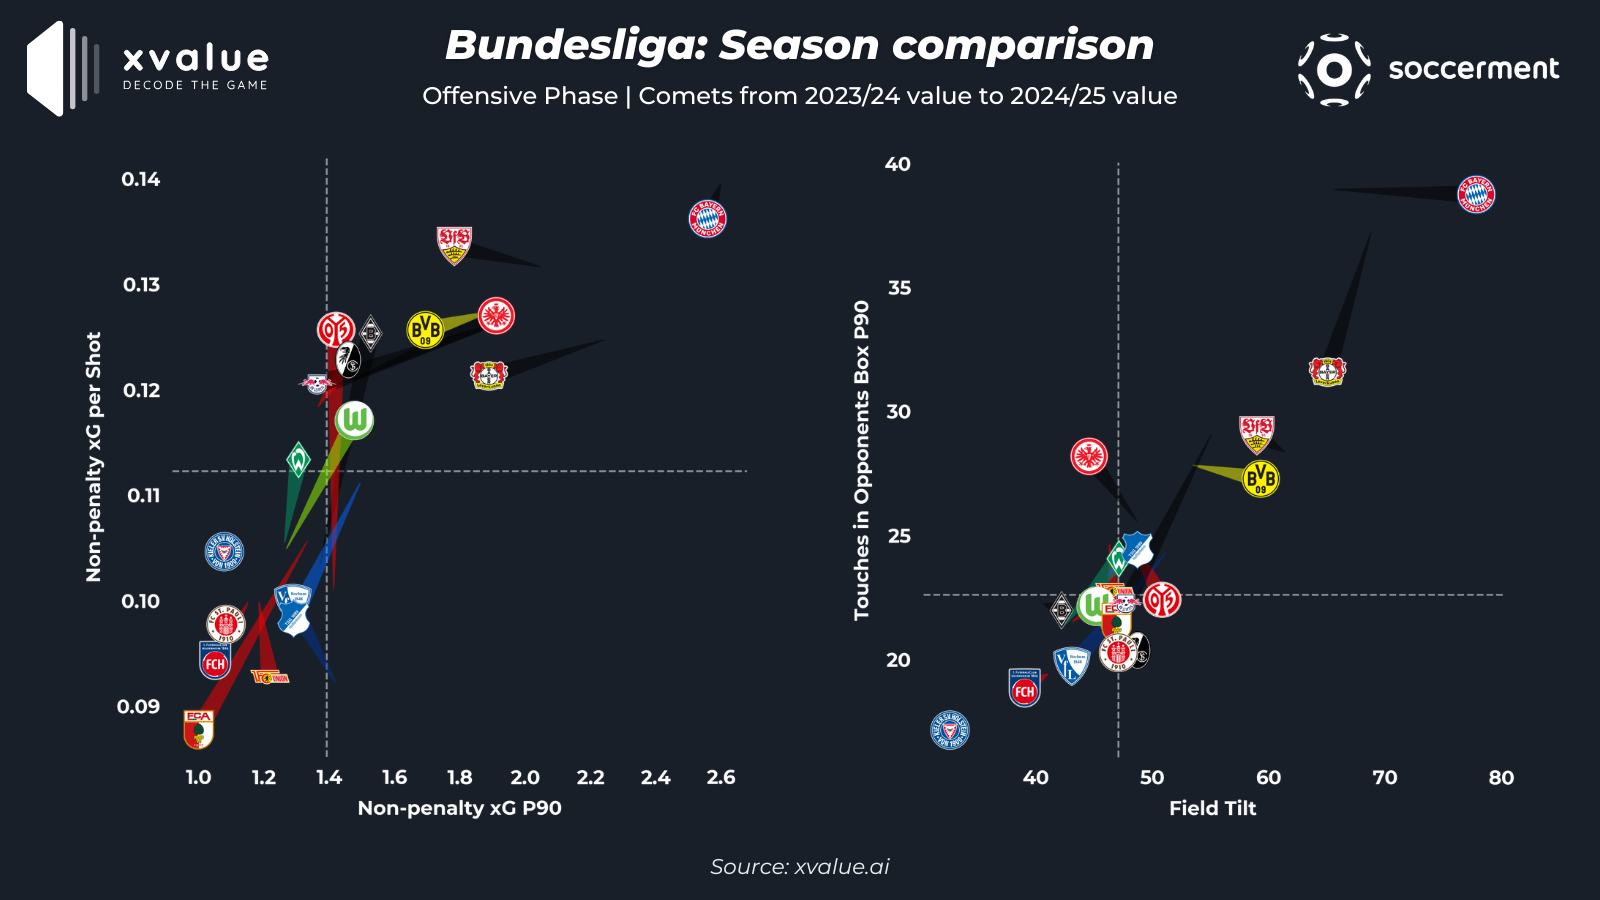
After witnessing Xabi Alonso’s Bayer Leverkusen triumph last season, the Bundesliga could hold exciting surprises this year, especially with managerial changes such as Vincent Kompany taking over at Bayern Munich.
1° – npxG P90 vs npxG per Shot:
Analyzing the first scatter plot, which evaluates offensive effectiveness through npxG per 90 minutes and npxG per shot, we immediately notice a decline among the league’s top teams. Bayern Munich, Bayer Leverkusen, Stuttgart, Borussia Dortmund, and RB Leipzig have all experienced a drop, particularly in their npxG per 90 minutes, indicating a decrease in overall goal-scoring opportunities.
On the other hand, teams like Wolfsburg, Mainz, and Borussia Mönchengladbach have improved in both metrics, showing increased attacking efficiency. However, one of the most concerning declines comes from Augsburg, which have fallen from mid-table last season to the bottom of the rankings in both npxG per shot and npxG per 90 minutes.
2° – Field Tilt vs Touches in Opponent Box P90
Moving to the second scatter plot, which examines changes in playing style through Field Tilt and touches in the opponent’s box per 90 minutes, one of the most striking developments is Bayern Munich’s evolution under Kompany. The team has significantly increased its Field Tilt, rising from 65% to nearly 80%, emphasizing a strong focus on controlling possession in the opponent’s half. However, Bayern remain at the same level as last season in terms of touches in the opposition’s penalty area, indicating that despite dominating possession, this has not necessarily translated into more penetration inside the box.
Bayer Leverkusen, on the other hand, have declined in both metrics, with a particularly notable drop in touches inside the opposition’s penalty area, falling from above 35 per 90 minutes to just over 30. Overall, there have been few major improvements across teams in these metrics, except for Eintracht Frankfurt, which have increased its touches in the opponent’s box per 90 minutes but have slightly declined in Field Tilt. This might suggest an increased proficiency in counter attacks and/or fast, direct attacks.
BUNDESLIGA: DEFENSIVE PHASE
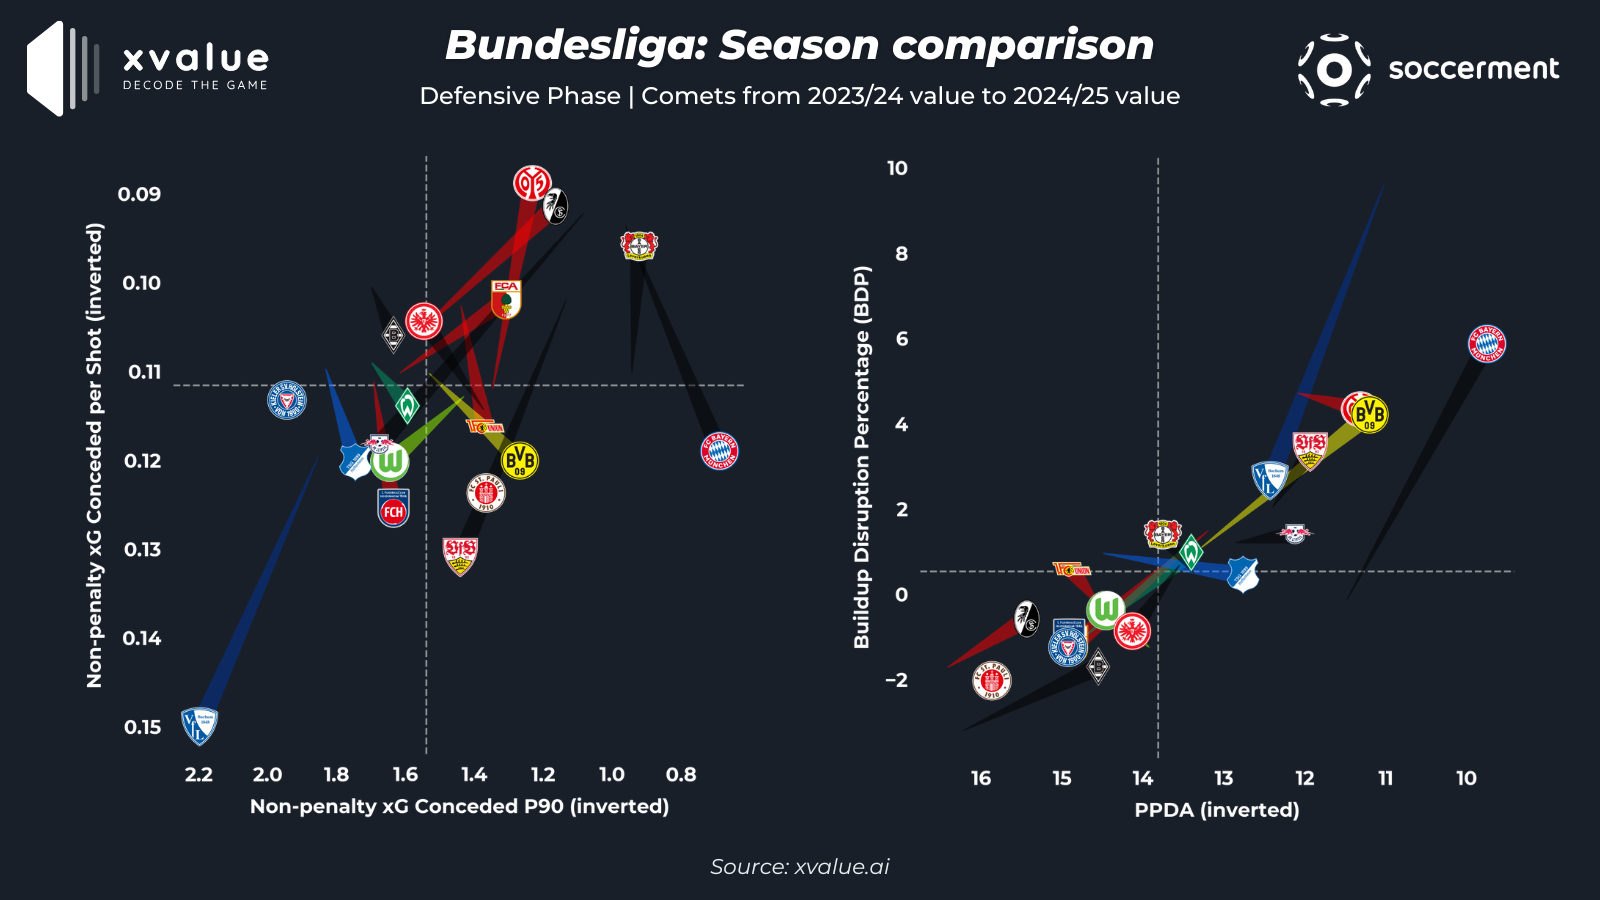
3° – npxGA P90 vs npxGA per Shot
Defensively, the third scatter plot evaluates team compactness and efficiency through npxGA per 90 minutes and npxGA per shot. Bayern Munich have shown a significant decline in npxGA per shot, meaning it is allowing higher-quality chances compared to last season. However, the overall number of expected goals conceded per 90 minutes has slightly improved, meaning they are conceding significantly fewer shots
Other teams that have seen defensive regressions in both metrics include Bochum, Stuttgart, and RB Leipzig. Borussia Dortmund follows a similar pattern to Bayern, showing an improvement in overall npxGA per 90 minutes but conceding higher-quality chances per shot. The most concerning situation is that of Bochum, which was already among the weakest defensive teams last season and has now fallen even further to the bottom of both metrics, widening the gap from the rest of the league.
On the positive side, Bayer Leverkusen have improved its npxGA per shot while maintaining last season’s numbers in npxGA per 90 minutes, signaling similar defensive efficiency despite allowing more shots. Mainz have also recorded significant progress, now ranking first in the league in npxGA per shot, indicating its ability to limit opponents to lower-quality opportunities.
4° – PPDA vs BDP
Finally, the fourth scatter plot evaluates pressing styles using PPDA and BDP metrics, highlighting how teams have adjusted their defensive strategies compared to last season.
One of the most drastic changes comes from Bochum, which, in addition to worsening in npxGA, have seen its pressing intensity drop dramatically. After leading the league in both PPDA and BDP last season, Bochum have now fallen to mid-table, showing a significant decline in pressing effectiveness.
Conversely, Bayern Munich have improved considerably in both metrics, now applying a higher and much more effective press under Kompany. Its BDP value has risen from just above 0 to 6, reflecting a stronger ability to disrupt opposition buildup. Borussia Dortmund have also seen a major improvement in pressing intensity, now ranking second in PPDA and third in BDP, signaling a more aggressive defensive approach compared to last season.
LIGUE 1: OFFENSIVE PHASE
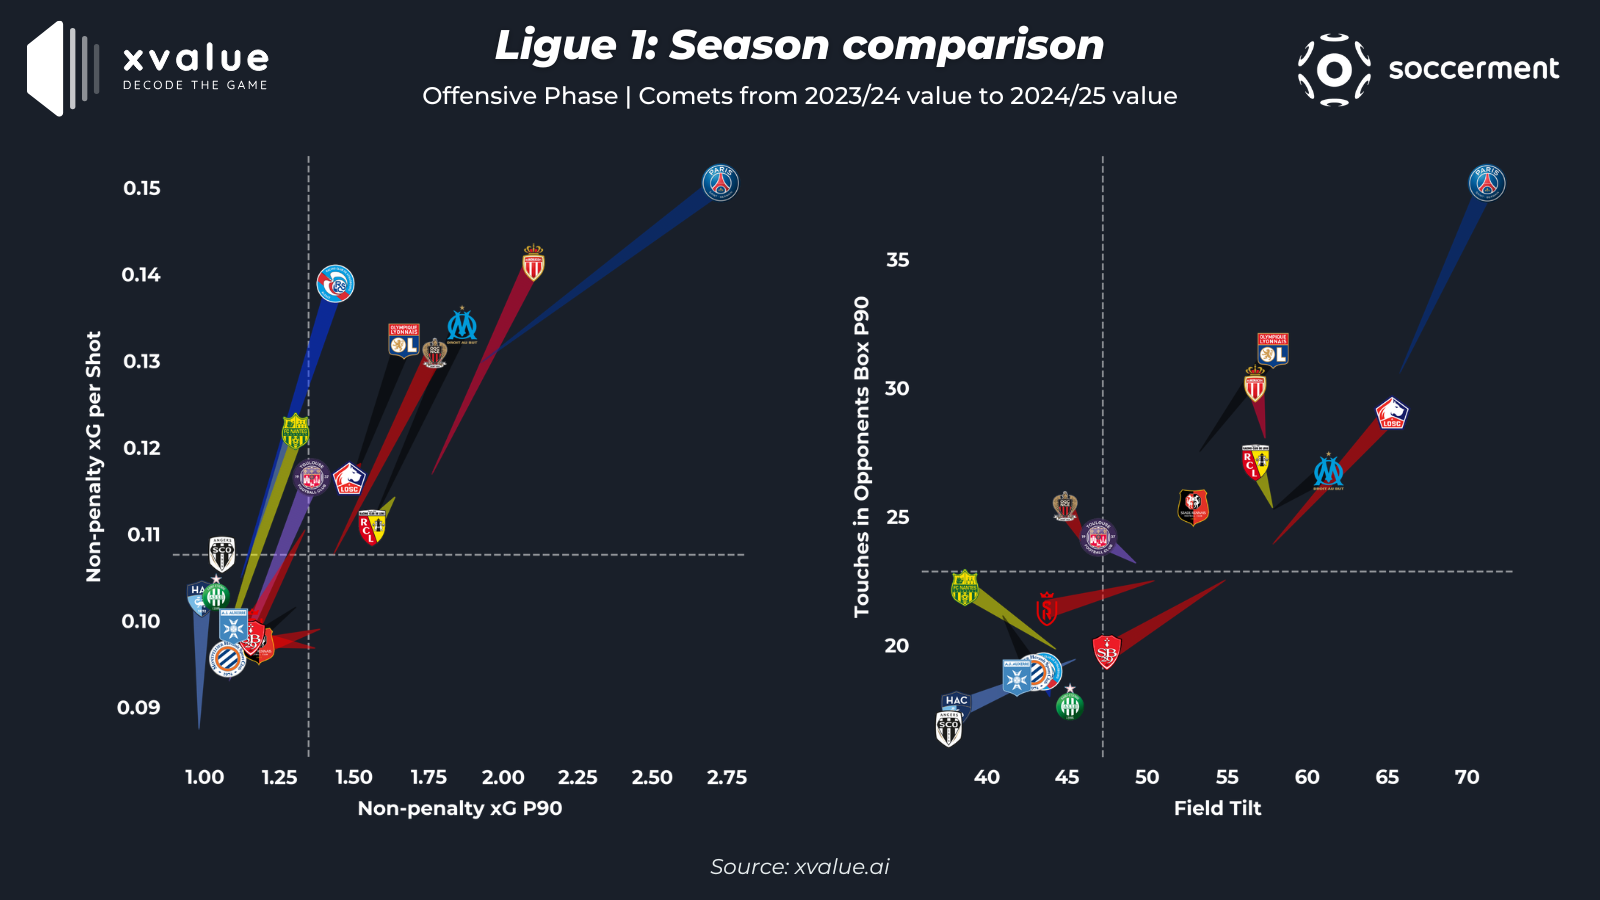
1° – npxG P90 vs npxG per Shot:
Moving on to the analysis of the final league among Europe’s top five, Ligue 1, the first scatter plot reveals several improvements in terms of offensive threat. Paris Saint-Germain have shown a remarkable increase in attacking efficiency, now leading both metrics and solidifying its reputation as a goal-scoring powerhouse with 2.75 expected goals per 90 minutes. However, PSG’s direct competitors have also made strides in this regard, as Monaco, Marseille, Nice, Lyon, and Strasbourg have all improved in both npxG per shot and npxG per 90 minutes.
Instances of decline in attacking effectiveness are rare, but Brest stand out as one of the teams that has regressed, now ranking among the lowest in these metrics compared to last season.
2° – Field Tilt vs Touches in Opponent Box P90
Examining the second scatter plot, which analyzes playing style through Field Tilt and touches in the opponent’s penalty area per 90 minutes, PSG once again emerge as the dominant force. The team has significantly improved in both metrics and is far ahead of the competition.
Other teams also displaying strong control of possession and attacking efficiency include Lille, which rank second in Field Tilt, Marseille in third, Lyon, which is second in touches in the opponent’s box per 90 minutes, and Monaco, which follows in third place. On the opposite end of the spectrum, Brest and Stade de Reims have recorded noticeable declines, dropping toward the lower rankings in both metrics.
LIGUE 1: DEFENSIVE PHASE
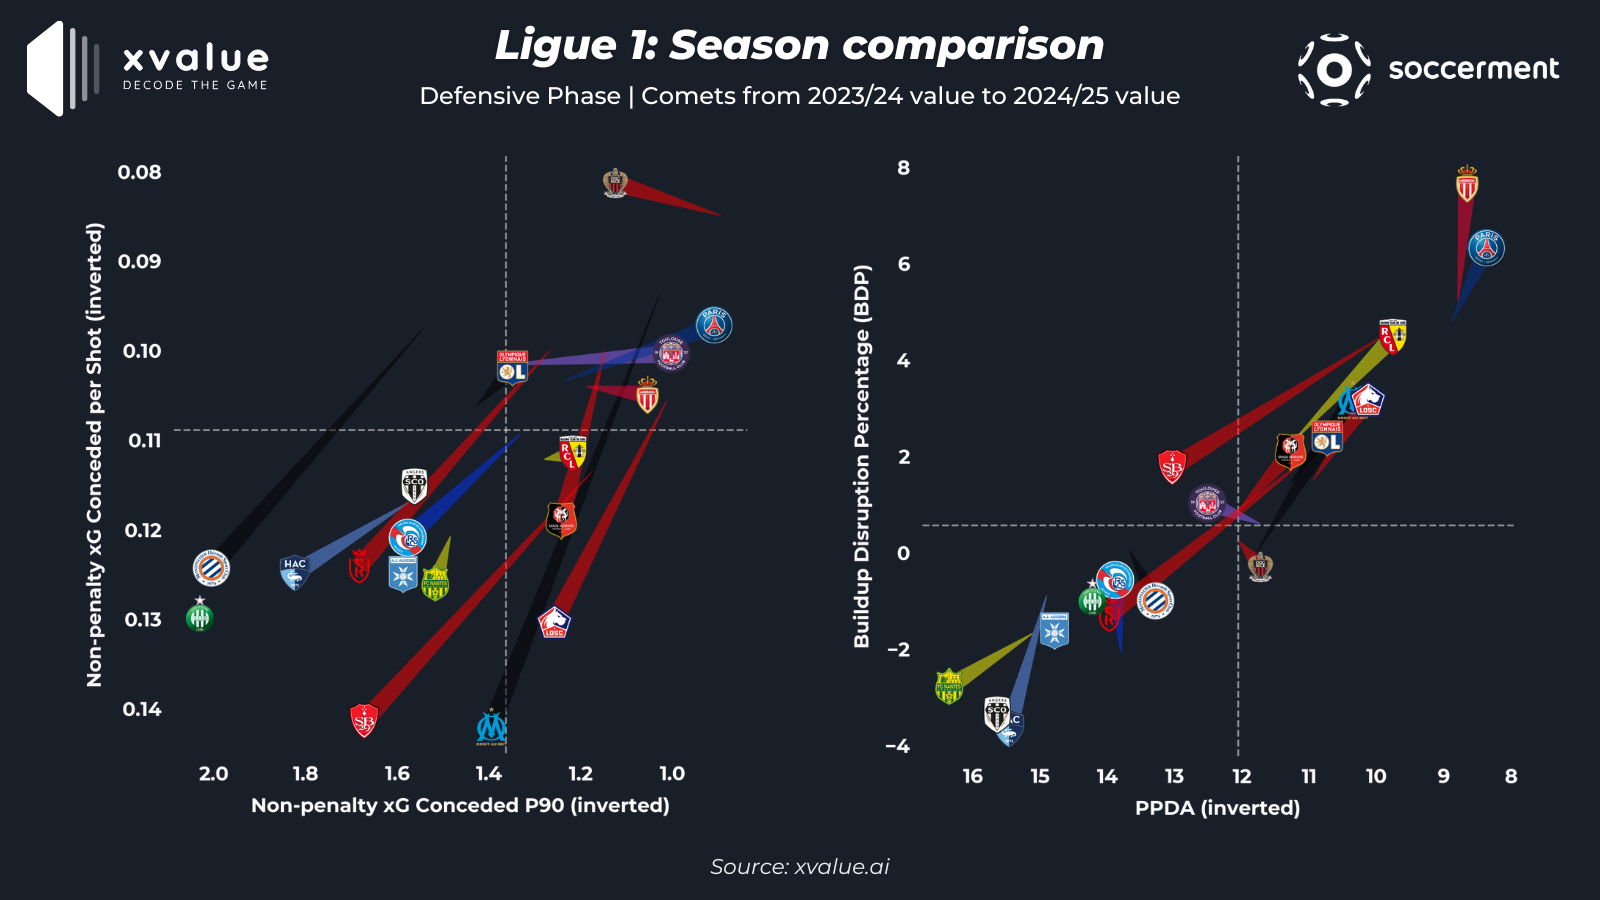
3° – npxGA P90 vs npxGA per Shot
Shifting focus to defensive performance, the third scatter plot highlights compactness and defensive effectiveness through npxGA per 90 minutes and npxGA per shot. Nice, which were already the league’s best defensive team last season in both metrics, has further improved its npxGA per shot but have slightly worsened in npxGA per 90 minutes. Nonetheless, they remain among the best defensive units in Ligue 1.
One of the most concerning declines comes from Marseille, who have experienced a dramatic collapse in defensive solidity. The team has fallen from second to last in npxGA per shot, marking a significant deterioration in its ability to prevent high-quality chances. Other teams suffering major defensive setbacks include Lille, Brest, Montpellier, and Stade de Reims, all of which have regressed considerably in these metrics.
4° – PPDA vs BDP
Lastly, the fourth scatter plot evaluates defensive styles through PPDA and BDP, offering insight into pressing intensity and effectiveness. Monaco and PSG, which were already among the most aggressive pressing teams last season, have further increased their intensity, improving in both metrics.
Lens, Marseille, Lyon, and Lille have also made notable progress, displaying a more aggressive and efficient pressing approach compared to last season. However, Brest and Stade de Reims have once again suffered a major decline, seeing their pressing effectiveness drop significantly in both PPDA and BDP.
Thanks!
Learn more about xvalue, the go-to analytics platform for scouting and match analysis 👉🏻 xvalue.ai
Stay tuned and don’t miss out on the latest updates and insights from Soccerment!
Leave a Reply