Introducing xValue
Advanced Metrics
A new metric that puts a number on every on-ball event, in attack and in defence: how much it changed the team's chances of scoring, minus its chances of conceding, over the next 30 seconds of play.
Top 5 leagues · Champions League · World Cup
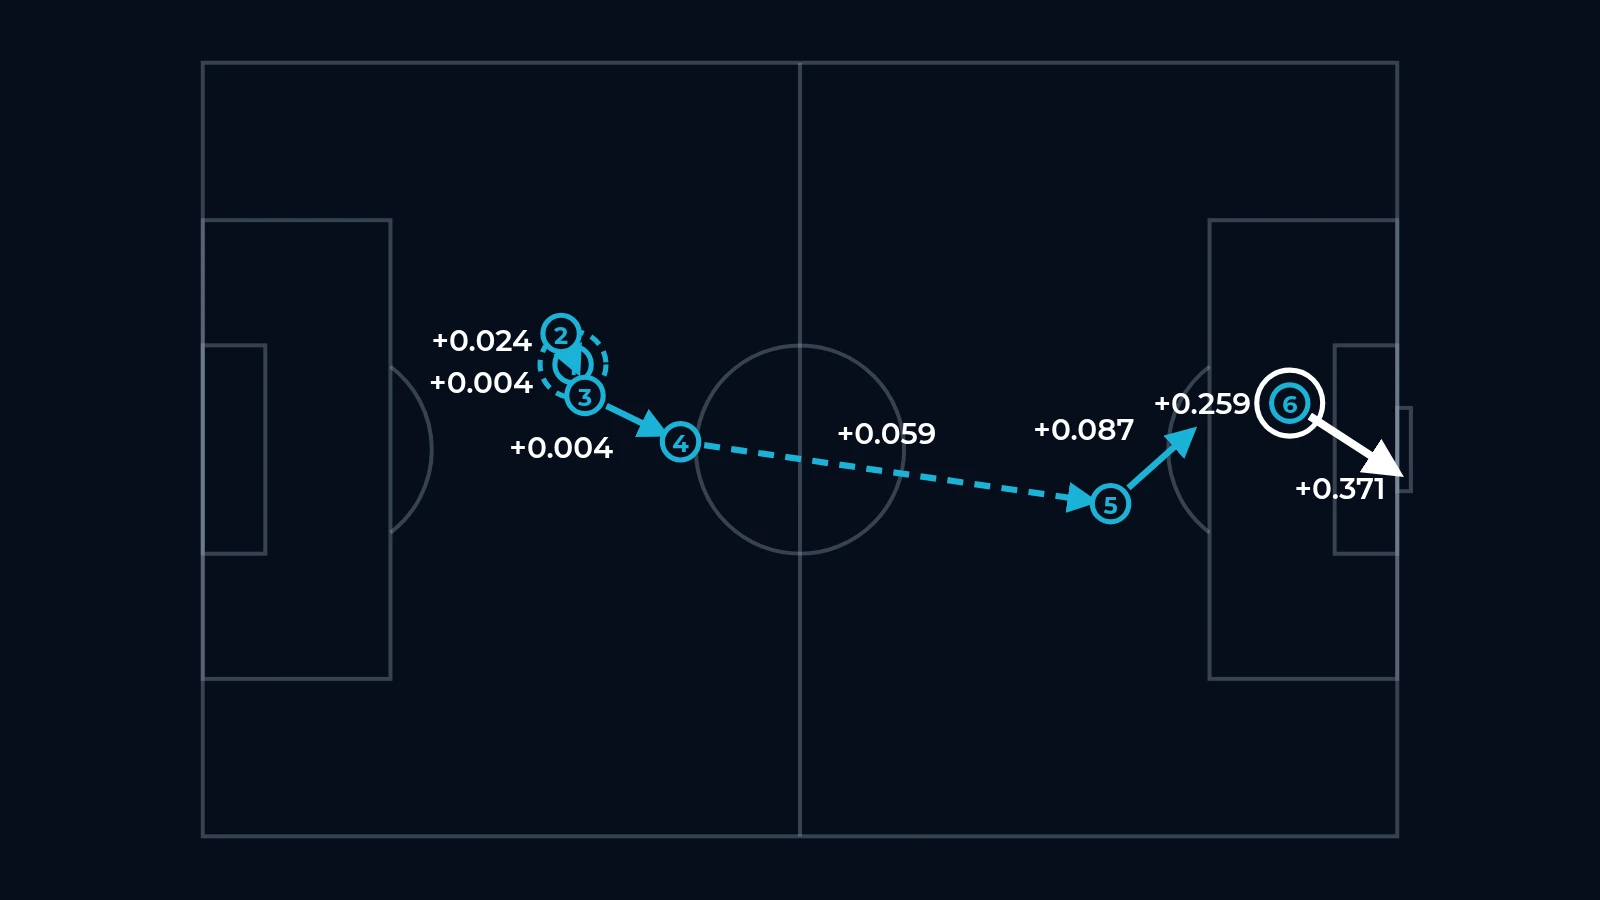
City attack left to right. Rodri wins the ball in his own half; two short passes, Reijnders' carry of nearly 40 metres and his through ball, and Haaland finishes from 10 metres. Each arrow is one event; the label is its xValue. This match is part of the test set: the model never saw it.
Six events, one goal
- 1Rodri, recoveryWins the ball in the City half+0.024
- 2Rodri, passShort, to Haaland+0.004
- 3Haaland, passLay-off to Reijnders+0.004
- 4Reijnders, carryNearly 40 metres through the middle+0.059
- 5Reijnders, through ballInto the box, for Haaland+0.087
- 6Haaland, shot: choiceFrom 10 m, central+0.259
- 7Haaland, shot: executionOn target, right of centre+0.371
The move starts from a state worth −0.015: Arsenal had the ball. Rodri's recovery alone is worth +0.024. The shot is valued in two steps: choosing to shoot from 10 metres (+0.259) and its execution, on target right of centre (+0.371). Whether it crossed the line is not part of either.
In this post we introduce xValue, Soccerment's new event-value metric. xValue measures how much each on-ball event changes a team's probability of scoring, minus its probability of conceding, in the next 30 seconds. Passes, carries, dribbles, tackles, interceptions, clearances, blocks, shots and saves all sit on the same scale, so a centre-back's interception and a winger's dribble can finally be compared. We trained the model on nearly 15,000 matches, tested it on two full seasons it had never seen, Serie A and the Premier League 2025/26, and then scored the whole 2025/26 season: the top five leagues, the Champions League and the 2026 World Cup. Over the season, Michael Olise (+34.6) produced the most value, ahead of Harry Kane and Lamine Yamal; Erling Haaland, with 42 goals, is 6th. We explain the three choices behind the metric, the different ways players produce value, and how it can find talent among the young defenders of the top five leagues.
Background
From Expected Threat to xValue
Goals and assists only tell us about the last two touches of an attack. Most of the work that makes a chance possible happens earlier, and a good metric should give it credit. This idea is at the base of Expected Threat (xT), which we covered in 2021: divide the pitch into a grid, assign each cell a probability of leading to a goal, and value passes and carries by the difference between where they start and where they end.
xT is simple and robust, but it only knows where the ball is. It cannot tell a pass that launches a counter-attack seconds after a turnover from the same pass in a slow build-up, it gives no value to defending, and an event that loses the ball costs nothing. With xOVA we then combined xG and xA to isolate a player's attacking output, again only on the attacking side.
xValue keeps the spirit of xT and moves it to a machine-learning model of the whole game state, in the family of event-value frameworks such as VAEP (Decroos et al., 2019). It adds the other half of the picture: the risk, and the defenders who remove it. Every event is valued by what it does to both ends of the pitch.
Definition
What is xValue?
At any moment of a match, the team in possession has some chance of scoring soon and some chance of conceding soon. We call the difference the value of the game state. An event moves the game from one state to the next, and its xValue is the change in state value from before the event to after it.
V(S) = P(score within 30 s | S) − P(concede within 30 s | S)
xValue(event) = V(state after) − V(state before)
Values are in goals. An event worth +0.05 added five hundredths of a goal to the team's net expected outcome. In the sequence above, Reijnders' through ball took V from 0.072 to 0.159, so it is worth +0.087.
Because both probabilities sit in the same number, attack and defence share one scale. Each state is valued once, from the side of the team in possession, and the other team's value is its exact opposite. So what one team gains, the other loses: a defensive event is valued on the same scale as the attack it stops, and every change of possession is valued exactly once.
Methodology
Three choices, and why we made them
Every event-value model has to answer the same three questions: what it learns from, how far ahead it looks, and what it does with a shot. Our answers are what make xValue different.
1. Goals, not expected goals
Goals are rare, and a model that learns from them has to cope with that noise. A common shortcut is to train on expected goals instead: every shot counts as its xG rather than as 1 or 0. Many possession-value models do this. It smooths the target, but it turns the metric into a model of a model: whatever the xG model does not see, the event-value model cannot learn either. It would also put shots and saves on a different footing from every other event: a shot would be worth its xG by construction, and where it is placed, or how good the save was, would leave no trace.
With nearly 15,000 matches and millions of game states, the noise of goals averages out, and we can check it does: on the test tournaments, when the model predicts a 38% chance of scoring, teams scored 37% of the time. Learning from goals does not mean rewarding luck, because of the third choice below: the outcome of a shot is not credited to the shooter.
2. Thirty seconds, not ten events
A common choice is to look at the next ten events. But events do not have a fixed length. In the top five leagues 2025/26, ten on-ball events took a median of 35 seconds on the clock, and the spread is wide:
Clock time covered by the next ten on-ball events.
A quick combination or a counter-attack.
Slow build-up, stoppages and restarts in between.
Windows of ten events that last more than 60 seconds.
Top five leagues 2025/26, 1,751 matches. On-ball events are passes, carries, shots, won duels, interceptions, clearances, blocks, fouls, bad touches and goalkeeper events; receptions are not counted.
A horizon in events therefore judges a counter-attack over twenty seconds and a patient build-up over more than a minute. A horizon in time puts them on the same footing: what matters is whether the team scores soon, however many touches it takes. Stoppages do not use up the window: a corner won now still counts if it is taken a minute later.
3. The shot in two steps
A shot contains two different decisions. The first is choosing to shoot from a given place and situation, which is what xG measures. The second is the execution: where the ball goes on goal, which is what xGoT measures. xValue values the two steps separately, as two moves that the event feed does not record on their own: from the state before the shot to the decision to shoot, and from the decision to the ball's path on goal, before the goalkeeper intervenes. With event data alone, what happens next cannot be reliably split between finishing skill, the goalkeeper and luck, so it is not credited to the shooter.
Why not give the shooter the outcome? Because a shot is unlike any other event. A pass or a tackle moves the value of the game a little; a shot that goes in moves it all the way to a goal. If the outcome were credited, the average goal would be worth about +0.83, as much as some 320 completed passes, and a missed chance would cost the shooter. Values would then follow who happened to score rather than who played well. We checked it on the top five leagues 2025/26, with a simplified version in which a missed shot leaves the team with nothing:
- Single matches would be ruled by goals. Of the 100 best individual performances of the season, 52 would contain a goal, against 29 with the split.
- Shooting would become noise. The shooting value a player earns in one half of the season would say nothing about the other half (correlation −0.02). With the split, the two halves agree (0.53), and the overall per-90 ranking is more stable too.
Splitting the shot does not hide that goals matter most: the average goal is still the most valuable event, +0.42 across choice and execution, as much as about 160 completed passes, because shots are what produce goals. What it removes is the part decided by the goalkeeper and by luck. Two more advantages follow:
- Goalkeepers are valued against the shot they face. A save on a shot heading for the top corner is worth much more than one straight at the body, and a goal conceded costs the keeper only the value the shot still had.
- Bad decisions stay visible, even when they work. Shooting from a worse position than the one a teammate had just created reads negative, even when the execution is good enough to score.
The model also leaves out the clock and the scoreline on purpose. A pass in the 5th minute at 0-0 and the same pass in the 90th at 2-1 are worth the same: xValue rates the event, not the moment of the match.
Methodology
Who gets the credit?
Football is full of events with two protagonists, and counting them carelessly gives credit twice or to the wrong player. These are the rules we apply. Next to each, the average value of the event in the top five leagues 2025/26.
Pass, carry
Valued from where it starts to where it ends.
Lost ball
A failed pass or a bad touch: the player who loses the ball takes the whole swing, to the state the opponent now has.
Interception, recovery, clearance
From the opponent's state to the state after the ball is won or cleared. An intercepted pass is one swing: +Δ to the interceptor, −Δ to the passer.
Duel
Valued once, from the start of the duel to its outcome: +Δ to the winner, −Δ to the loser.
Blocked shot
The shooter keeps the value of choosing to shoot; what the block takes away goes to the blocker.
Shot
Two steps, choice and execution. Whether the ball goes in is not credited to the shooter.
Goalkeeper
Saves are valued against the shot faced; a goal conceded costs the value the shot still had.
Foul
The fouled player receives what the foul cost the opponent, when that is positive.
Offside
Split in half between the runner and the passer.
Penalty, own goal
The one exception to the shot rule: a penalty is valued on its outcome, as a duel between taker and goalkeeper. From the spot there is no choice of position and the goalkeeper moves before the ball, so where it goes says little. An own goal is a terminal event.
Methodology
How do we calculate it?
We estimate the two probabilities with two gradient-boosted tree models (XGBoost), one for scoring and one for conceding. A single model covers every event type, so a tackle and a through ball are measured with the same ruler.
Each game state is described by 161 features, in six broad groups:
- The event. Its type, whether it succeeded, the body part, and the kind of pass: long ball, cross, set piece.
- Where it happens. Start and end point, distance and angle to goal, length and direction in metres, how much closer to goal it takes the ball, whether it enters the box.
- What came just before. The previous five events, with their type, outcome, team, location and the seconds between them.
- The phase of play. How the sequence started, from open play or a restart and from where, how long it has lasted, how many passes, duels and players it has involved, how far up the pitch it has gone and at what tempo.
- The transition. Where and how the ball was won, how long ago, and how fast the team has moved forward since.
- The shot and the save. For the decision to shoot, the kind of pass that set it up. For the execution, the information an xGoT model uses: the point where the ball crosses the goal line, across the goal and in height, its distance from the posts and the corners, whether it is on target and whether it was deflected. For a save, where the goalkeeper sends the ball.
Just as important is what the model never sees: anything that happens after the event (assists, how the sequence ended), the result of a shot, other models' expected goals, the minute and score of the match, and who is playing. No team, player or competition enters the model, so a pass by a Champions League winner and the same pass by a Serie C midfielder are worth the same. The model rates the event, not the reputation.
The model is trained on nearly 15,000 matches played since January 2024, from the top European leagues and their second divisions to the Americas.
Results
What is an event worth?
The average completed pass in open play is worth very little, +0.003. There are, however, more than 700 of them in a match. A carry is worth seven times more on average, and 99% of won dribbles add value. A recovery is worth +0.022, and there are about 50 in a match. On the defensive side, a clearance is worth as much as a won dribble, and an interception slightly more than a won tackle. The costly events are the ones that give the ball away: a bad touch costs −0.021, and so does a foul.
Results
Where events earn value
Location still matters most, as xT already told us. A completed pass is worth around +0.002 from the own half and climbs steeply in the last 15 metres: one that starts inside the opponent's box is worth +0.035 on average and up to +0.09 right in front of goal, and a pass that reaches the box from outside +0.045, positive 96% of the time. Carries follow the same gradient and peak at the edge of the box: +0.054 on average there, up to +0.09 in its central zones.
Defensive events are the mirror image: an interception is worth +0.012 in the own box and +0.003 in the opponent's half, where little danger is removed. The exception is the recovery, worth most in the opponent's half (+0.024): the high turnover that starts an attack. Shooting from outside the box is close to a coin flip (+0.008, positive 66% of the time), from inside the box it is worth +0.050, and from the six-yard box +0.115.
Results
Highest-rated players: the 2025/26 season
To compare players across Europe we add up every event of the 2025/26 season in the top five leagues, the Champions League and the 2026 World Cup. By season total, Michael Olise produced the most value (+34.6), ahead of Harry Kane (+30.1), Lamine Yamal (+29.4), Vinícius Júnior (+27.6) and Kylian Mbappé (+24.1).
A season total rewards players who are decisive and play a lot. Next to the forwards, it lists two midfielders with more than 5,000 minutes, Enzo Fernández (9th) and Declan Rice (11th), and two goalkeepers, Barcelona's Joan García (12th) and Atalanta's Marco Carnesecchi (18th), on the same scale as everyone else.
| # | Player | Role | Minutes | Goals | League | UCL | World Cup | Total | Per 90 |
|---|---|---|---|---|---|---|---|---|---|
| 1 | M. OliseBayern Munich | W | 4,448 | 20 | +23.7 | +8.3 | +2.6 | +0.700 | |
| 2 | H. KaneBayern Munich | ST | 4,470 | 56 | +19.0 | +8.7 | +2.3 | +0.606 | |
| 3 | Lamine YamalBarcelona | W | 4,130 | 23 | +16.7 | +7.2 | +5.6 | +0.641 | |
| 4 | Vinícius JúniorReal Madrid | W | 4,817 | 25 | +18.5 | +5.1 | +4.0 | +0.516 | |
| 5 | K. MbappéReal Madrid | ST | 4,585 | 50 | +11.3 | +7.2 | +5.6 | +0.474 | |
| 6 | E. HaalandManchester City | ST | 4,583 | 42 | +13.7 | +3.6 | +4.2 | +0.422 | |
| 7 | Y. DiomandeRB Leipzig | W | 3,030 | 12 | +18.8 | – | +2.3 | +0.625 | |
| 8 | L. DíazBayern Munich | W | 4,296 | 23 | +12.1 | +6.3 | +1.6 | +0.420 | |
| 9 | E. FernándezChelsea | CM | 5,033 | 15 | +15.2 | +3.1 | +1.4 | +0.351 | |
| 10 | K. KvaratskheliaParis Saint-Germain | W | 2,810 | 18 | +9.1 | +10.5 | – | +0.625 | |
| 11 | D. RiceArsenal | CM | 5,218 | 6 | +11.9 | +4.3 | +2.5 | +0.323 | |
| 12 | Joan GarcíaBarcelona | GK | 3,844 | 0 | +15.4 | +3.0 | – | +0.431 | |
| 13 | C. De KetelaereAtalanta | AM | 3,307 | 8 | +13.1 | +4.1 | +1.2 | +0.498 | |
| 14 | J. DokuManchester City | W | 2,944 | 6 | +13.7 | +3.8 | +0.6 | +0.556 | |
| 15 | VitinhaParis Saint-Germain | CM | 4,387 | 7 | +8.9 | +7.7 | +0.9 | +0.361 | |
| 16 | F. WirtzLiverpool | W | 3,910 | 6 | +10.1 | +5.7 | +1.7 | +0.403 | |
| 17 | F. ValverdeReal Madrid | CM | 4,534 | 8 | +11.6 | +4.4 | +1.5 | +0.347 | |
| 18 | M. CarnesecchiAtalanta | GK | 4,566 | 0 | +14.2 | +2.9 | – | +0.337 | |
| 19 | J. BellinghamReal Madrid | CM | 3,434 | 15 | +9.1 | +2.9 | +5.0 | +0.446 | |
| 20 | M. LocatelliJuventus | CM | 3,902 | 2 | +14.0 | +2.7 | – | +0.384 |
Results
Different ways of producing xValue
Splitting each player's value by type of event shows how differently they get there. Olise is the most complete: the best passer of all outfield players, and a shooter and carrier as well. Yamal and Diomande combine passing and carrying. Kvaratskhelia, Doku and Vinícius earn theirs carrying the ball and shooting, with little from passing. Kane gets four fifths of his value from shots. De Ketelaere is first and foremost a passer, and Dimarco the crosser of the group, second among all outfield players. Senesi barely shoots and rises through defending and passing. Losing the ball costs everyone something: the median player gives back −0.022 per 90, the great dribblers about three times as much.
| Player | Total | Passes | Crosses | Carries & dribbles | Shots | Fouls won | Defending | Ball losses |
|---|---|---|---|---|---|---|---|---|
| OliseBayern Munich · W | +0.700 | |||||||
| Lamine YamalBarcelona · W | +0.641 | |||||||
| DiomandeRB Leipzig · W | +0.625 | |||||||
| KvaratskheliaParis Saint-Germain · W | +0.625 | |||||||
| KaneBayern Munich · ST | +0.606 | |||||||
| DokuManchester City · W | +0.556 | |||||||
| Vinícius JúniorReal Madrid · W | +0.516 | |||||||
| De KetelaereAtalanta · AM | +0.498 | |||||||
| MbappéReal Madrid · ST | +0.474 | |||||||
| HaalandManchester City · ST | +0.422 | |||||||
| SenesiBournemouth · CB | +0.390 | |||||||
| DimarcoInter · WB | +0.365 | |||||||
| Median player1,013 outfield players | +0.172 |
Because every area is on the same scale, each has its own leaderboard. Some are familiar (Haaland for the positions he shoots from, Kane for how he finishes); others are the kind of thing only a model like xValue can show, like the centre-backs who remove the most danger, or the goalkeepers who save the most against the quality of the shots they face.
Open-play passing
- 1M. OliseBayern Munich+0.218
- 2M. LocatelliJuventus+0.203
- 3Y. DiomandeRB Leipzig+0.202
Dribbling & carries
- 1Y. DiomandeRB Leipzig+0.195
- 2K. KvaratskheliaParis Saint-Germain+0.189
- 3Vinícius JúniorReal Madrid+0.182
Shot choice
- 1E. HaalandManchester City+0.259
- 2Ferran TorresBarcelona+0.231
- 3N. KrstovićAtalanta+0.222
The quality of the positions a player shoots from.
Shot execution
- 1H. KaneBayern Munich+0.266
- 2E. DemirovićStuttgart+0.242
- 3Ferran JutglàCelta Vigo+0.219
Where the ball goes, given the position. Noisy over one season.
Defending
- 1MurilloNottingham Forest+0.263
- 2J. BahNice+0.255
- 3T. YegbeMetz+0.244
Interceptions, clearances, blocks, recoveries and defensive duels, per 90 played.
Shot stopping
- 1D. BatzMainz+0.395
- 2H. KoffiAngers+0.288
- 3Joan GarcíaBarcelona+0.243
Goalkeepers only: saves minus goals conceded, against the value of each shot.
Leaders by area, 2025/26 season, top five leagues with Champions League and World Cup, xValue per 90 (minimum 1,800 minutes and 15 events in the area).
Results
The Haaland case
Erling Haaland scored 42 goals across the Premier League, the Champions League and the World Cup, more than anyone except Harry Kane (56) and Kylian Mbappé (50). By season total he is 6th; per 90 minutes he is 20th of the 1,109 players with at least 1,800 minutes, at +0.422. Almost all of it, +0.386, comes from shooting: nobody shoots from better positions (+0.259 per 90 for shot choice, first of all players), while his passing adds nothing. This is the design working as intended. xValue credits a striker for getting into great positions and for putting the ball on target in hard places. Whether it then beats the goalkeeper is left out: with event data alone it cannot be reliably separated into finishing skill, goalkeeping and luck, and over a season it is the least stable part of a shot's value.
Kane is the mirror image. He is 5th per 90 with +0.483 from shots, and he leads the shot-execution area (+0.266 per 90): where Haaland earns his value before the shot, Kane earns it with the execution.
The same choice explains the bottom of the rankings. Target strikers such as Fulham's Rodrigo Muniz (−0.227 per 90 over 1,104 minutes) play many aerial duels and back-to-goal balls, and every lost duel costs value. Rankings by area tell a fairer story about these profiles than the global total.
Penalties as a duel
Because a penalty is the one shot valued on its outcome, as a duel between taker and goalkeeper, perfect records stand out: Christopher Nkunku scored 5 out of 5 for +1.06, while Nico Paz missed both of his for −1.62. Hellas Verona's Lorenzo Montipò saved 3 of 5 penalties, worth +2.03, the best mark of any goalkeeper. Over his full season, though, he is third from the bottom in Serie A at −0.112 per 90. Penalties alone do not make a season.
Scouting
Talent the usual numbers miss
The model never sees who is playing, so it rates a 19-year-old and an established international with the same ruler, and it can be applied to any league in our data. That makes it a scouting tool. It measures value produced, not ability adjusted for the level of play, so it works as a first filter to be read with the context. Here we look at the young centre-backs and wing-backs of the top five leagues: born after 30 June 2003, with at least 1,500 minutes in club matches over the last twelve months, from 26 October 2025 to 25 October 2026. Leagues and European cups count, including spells on loan in other leagues; national-team matches do not, because the model does not know the level of the opponent.
The best young defenders
The two names at the top now play in the Premier League. On the 2025/26 league season alone, xValue already ranked Luka Vušković, then at Hamburg, first among the young centre-backs of the top five leagues, and Jérémy Jacquet, then at Rennes, fifth. Today Vušković, 19, plays for Brighton and Jacquet, 21, for Liverpool. Over the last twelve months Jacquet leads the group: his defensive events are the most valuable of all, yet he is only 9th for recoveries and interceptions. Vušković is second, and the one a classic count would find too, since he is first for recoveries and interceptions.
The cases that only xValue brings out are the ones the counts miss. Rennes' Abdelhamid Aït Boudlal, 20, is third by xValue and fourth for the value of his defensive events, but 13th for recoveries and interceptions, 28th for progressive passes and 34th for xT: no classic statistic puts him near the top. Freiburg's Bruno Ogbus, 20, is second for the value of his defensive events but 41st for recoveries and interceptions. Both intervene less often than others, but where it matters. Dean Huijsen shows the opposite: first for progressive passes, 9th by xValue.
| # | Player | Role | Born | Minutes | xValue per 90 | Defending per 90 | Rank, recoveries + interceptions | Rank, progressive passes | Rank, xT |
|---|---|---|---|---|---|---|---|---|---|
| 1 | J. JacquetLiverpool | CB | 2005 | 1,666 | +0.418 | +0.263 | 9 | 9 | 22 |
| 2 | L. VuškovićBrighton | CB | 2007 | 2,806 | +0.346 | +0.178 | 1 | 30 | 37 |
| 3 | A. Aït BoudlalRennes | CB | 2006 | 1,787 | +0.306 | +0.197 | 13 | 28 | 34 |
| 4 | G. ScalviniAtalanta | WCB | 2003 | 2,348 | +0.293 | +0.164 | 11 | 14 | 14 |
| 5 | Jacobo RamónComo | CB | 2005 | 3,171 | +0.255 | +0.085 | 40 | 3 | 12 |
| 6 | O. DiomandeNottingham Forest | CB | 2003 | 2,401 | +0.234 | +0.137 | 48 | 22 | 39 |
| 7 | L. HøgsbergStrasbourg | CB | 2006 | 2,192 | +0.232 | +0.187 | 49 | 5 | 25 |
| 8 | I. GaniouLens | WCB | 2005 | 2,608 | +0.231 | +0.111 | 5 | 10 | 19 |
| 9 | D. HuijsenReal Madrid | CB | 2005 | 2,889 | +0.229 | +0.111 | 26 | 1 | 16 |
| 10 | A. KhalailiCrystal Palace | WB | 2004 | 3,584 | +0.226 | +0.106 | 34 | 35 | 5 |
| 11 | B. OgbusFreiburg | CB | 2005 | 1,634 | +0.225 | +0.209 | 41 | 60 | 55 |
| 12 | L. QuerfeldUnion Berlin | CB | 2003 | 2,506 | +0.225 | +0.125 | 4 | 32 | 23 |
| 13 | Pau CubarsíBarcelona | CB | 2007 | 3,499 | +0.223 | +0.130 | 29 | 11 | 21 |
| 14 | L. HerringtonHull City | WCB | 2007 | 2,004 | +0.220 | +0.178 | 43 | 7 | 35 |
| 15 | M. DiazTroyes | CB | 2003 | 1,796 | +0.216 | +0.182 | 37 | 53 | 43 |
Validation
How good is the model?
We measured the models on the 760 held-out matches against a baseline that predicts the same probability for every state. Confidence intervals come from resampling whole matches.
vs the constant baseline (95% CI −15.5% to −14.5%).
On shots: 0.771 when the shot is taken, 0.932 once we know where it is going.
Predicted and observed scoring rate alike, in states the model rates above 50%.
Goals conceded within 30 s happen in 0.36% of states and are harder to predict.
The scoring side is well calibrated across its whole range: in the 30–50% band, for example, the model predicts 38.4% and the observed rate is 37.2%. The conceding side is the weaker of the two, and we discuss what this means below.
Scope
What xValue measures, and what it leaves to others
- On the ball, by design. xValue is built on event data, which exists for every competition we cover. Runs, pressing and positioning are rewarded through the events they produce, such as the interception or the recovery. Tracking data, where it exists, is the natural next layer.
- Conceding is rarer than scoring. A goal conceded within 30 seconds happens in fewer than four game states in a thousand, so the defensive side of the model carries less signal than the attacking side, and defensive rankings need larger samples.
- Finishing is left out on purpose. Elite finishers can sit lower in the global total than their goals suggest. Their skill shows in the shot-execution ranking, where Kane leads.
- Values need minutes. Per-90 values settle after about 1,500 minutes, and some areas, such as shot execution, saves and fouls, need more than one season to separate skill from luck.
- Value produced, not ability. xValue measures the value a player's events produce. It does not adjust for the level of the league or the opponent, or for the team around a player, so comparisons across leagues of different level are a starting point for scouting, not a verdict.
Conclusions
Conclusions
With xValue we have introduced a single scale for every on-ball event, built on the change in a team's probability of scoring minus its probability of conceding over the next 30 seconds of play.
- Three choices set it apart: it learns from goals rather than from another model's expected goals, it looks 30 seconds ahead rather than a fixed number of events, and it splits the shot into choice and execution, so finishing luck is never credited to the shooter.
- Over the 2025/26 season, top five leagues, Champions League and World Cup together, Olise, Kane and Lamine Yamal produced the most value, and two goalkeepers, Joan García and Carnesecchi, make the top 20.
- Players reach the top in very different ways: through passing like Olise and De Ketelaere, through carries and dribbles like Vinícius, through crosses like Dimarco, or through defending like Senesi.
- Because shot outcomes are not credited to the shooter, Haaland's 42 goals translate into 20th place per 90, while Kane's finishing takes him to 5th: the metric rewards the quality of the chance and of its execution.
- As a scouting tool, xValue spots young defenders early and finds the ones that counts miss. On 2025/26 alone it ranked Vušković and Jacquet among the best young centre-backs, and both now play in the Premier League; Abdelhamid Aït Boudlal and Bruno Ogbus are among the most valuable over the last twelve months, while no classic statistic puts them near the top.
For any comment, request or query, please write to us at research@soccerment.com.
References: K. Singh, “Introducing Expected Threat (xT)”, 2018. T. Decroos, L. Bransen, J. Van Haaren, J. Davis, “Actions Speak Louder than Goals: Valuing Player Actions in Soccer”, KDD 2019. Soccerment Research, “Expected Threat”, 2021, and “The Very Exclusive xOVA Club”, 2022.