New Benches, New Ideas: Iraola's Liverpool Meet Maresca's City
Introduction
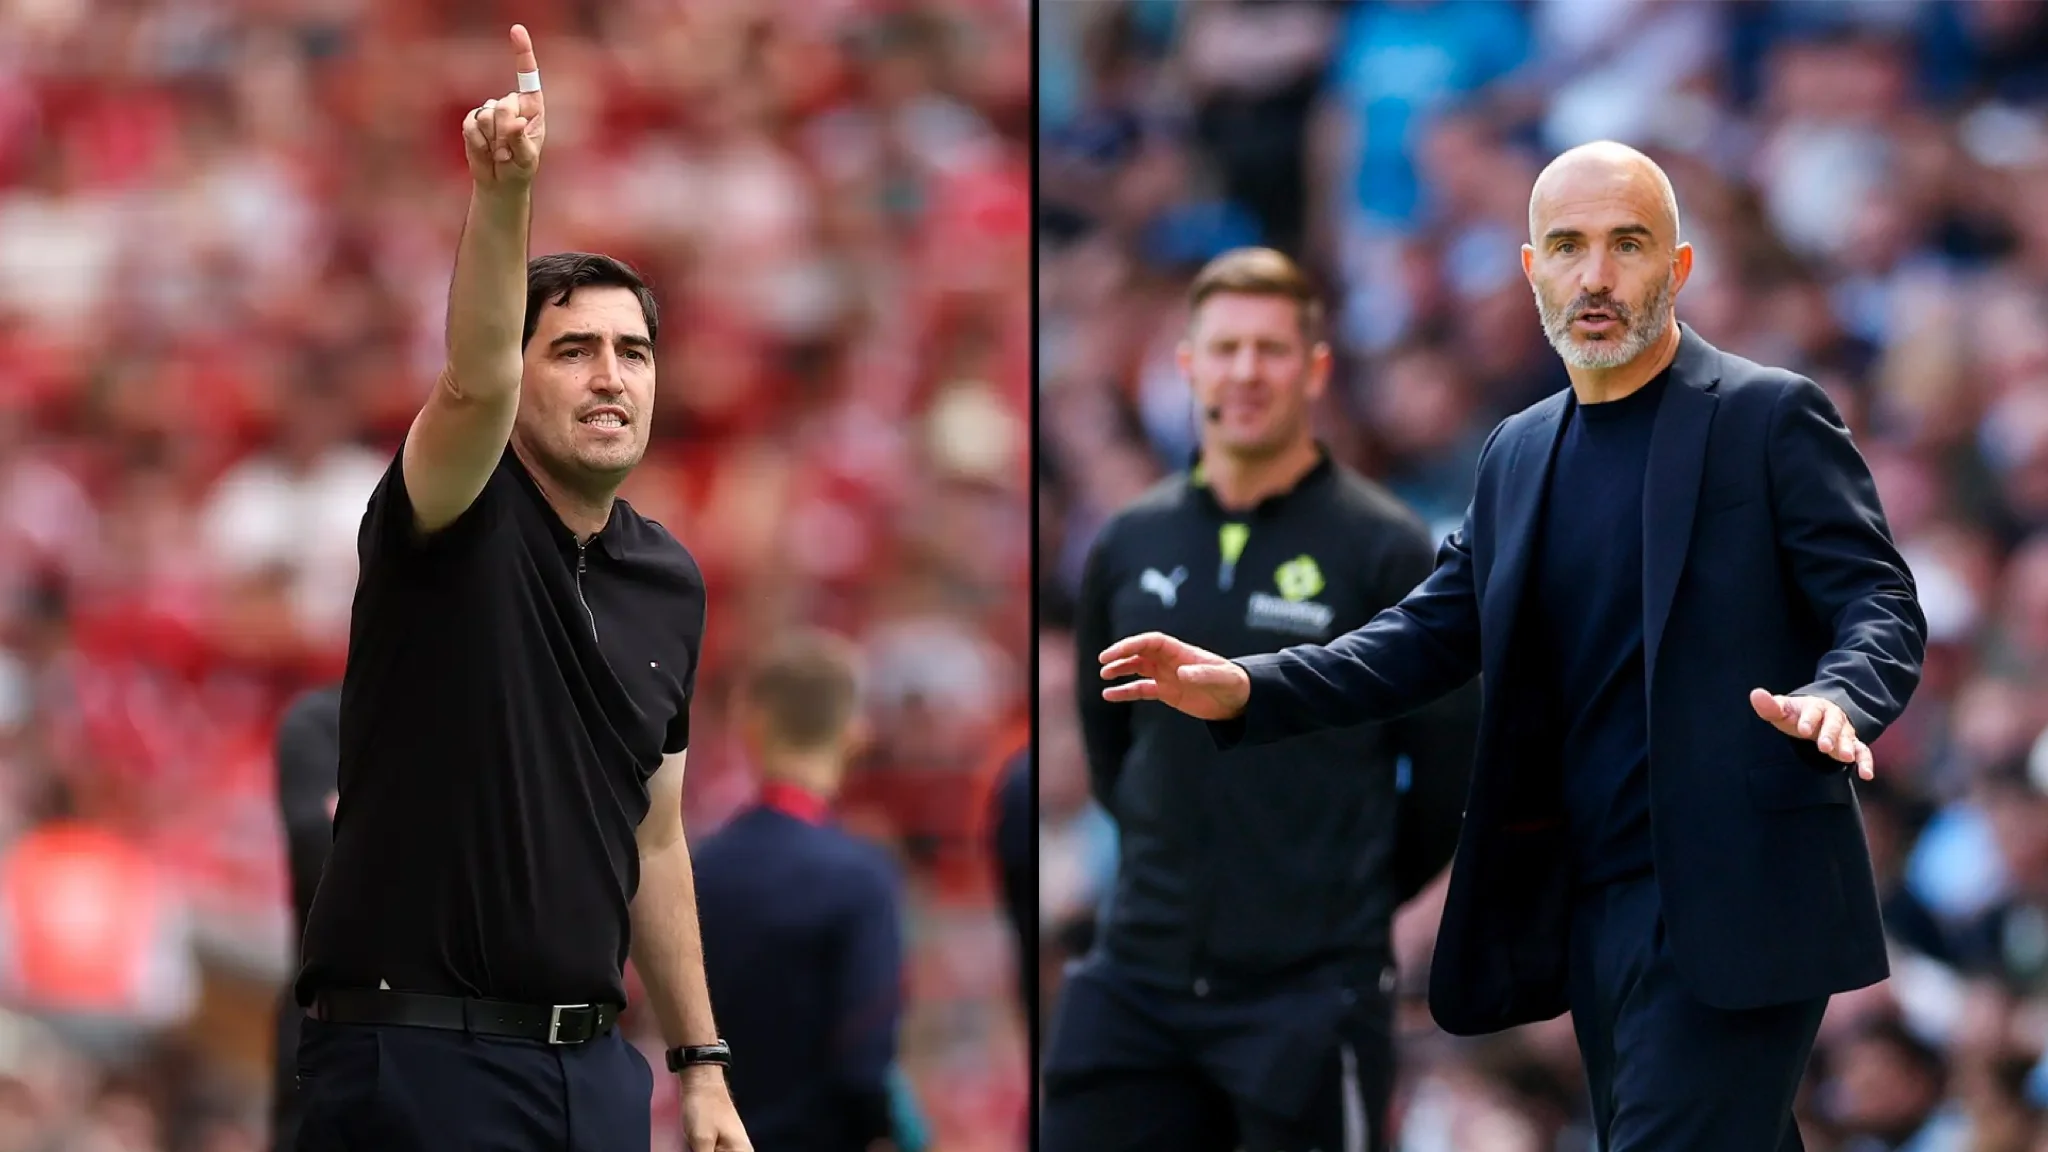
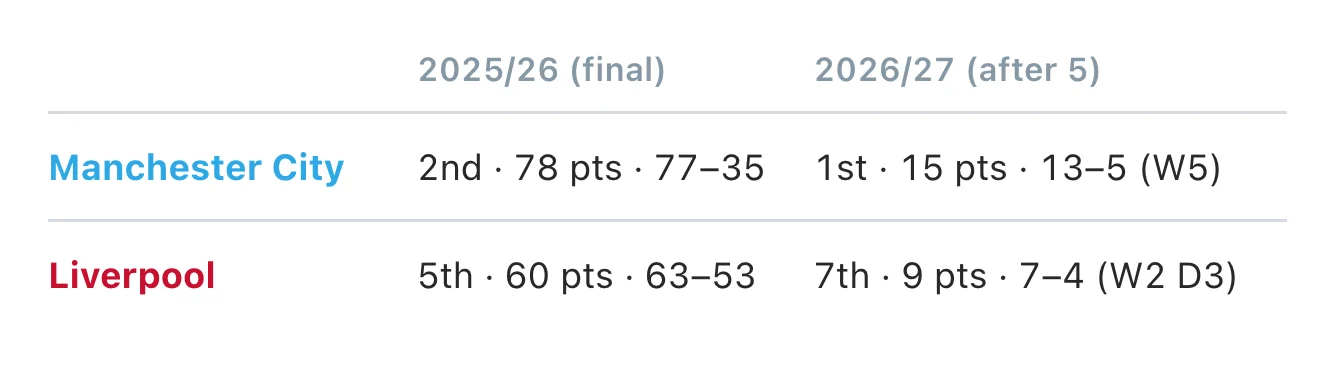
Liverpool host Manchester City at Anfield on Sunday 11 October, the first Premier League fixture after the international break. It is also the first meeting between the two clubs since both changed manager. The match comes days after the Premier League confirmed that an independent commission has found Manchester City guilty of almost all of the 115 charges of financial wrongdoing it faced. City said it will be "relentless" as it pursues avenues to appeal. Our focus here is on the pitch.
Andoni Iraola replaced Arne Slot at Liverpool after three seasons at Bournemouth. Enzo Maresca took over from Pep Guardiola, who left City after ten seasons. Five Premier League matchdays are a small sample, so we'll be careful. Still, some of the shifts are already too large to put down to noise, and they point in opposite directions.
Alongside this analysis, we're sharing the full SICS Atlas Team Reports for both clubs, covering their Premier League matches under the new managers. You'll find the links at the end of this edition.
To keep this season and last comparable, every chart ranks each team against the other 19 clubs in the same season. A rank still makes sense when the league as a whole moves, or when a metric is measured slightly differently from one season to the next.
Liverpool: more vertical, more aggressive, more exposed
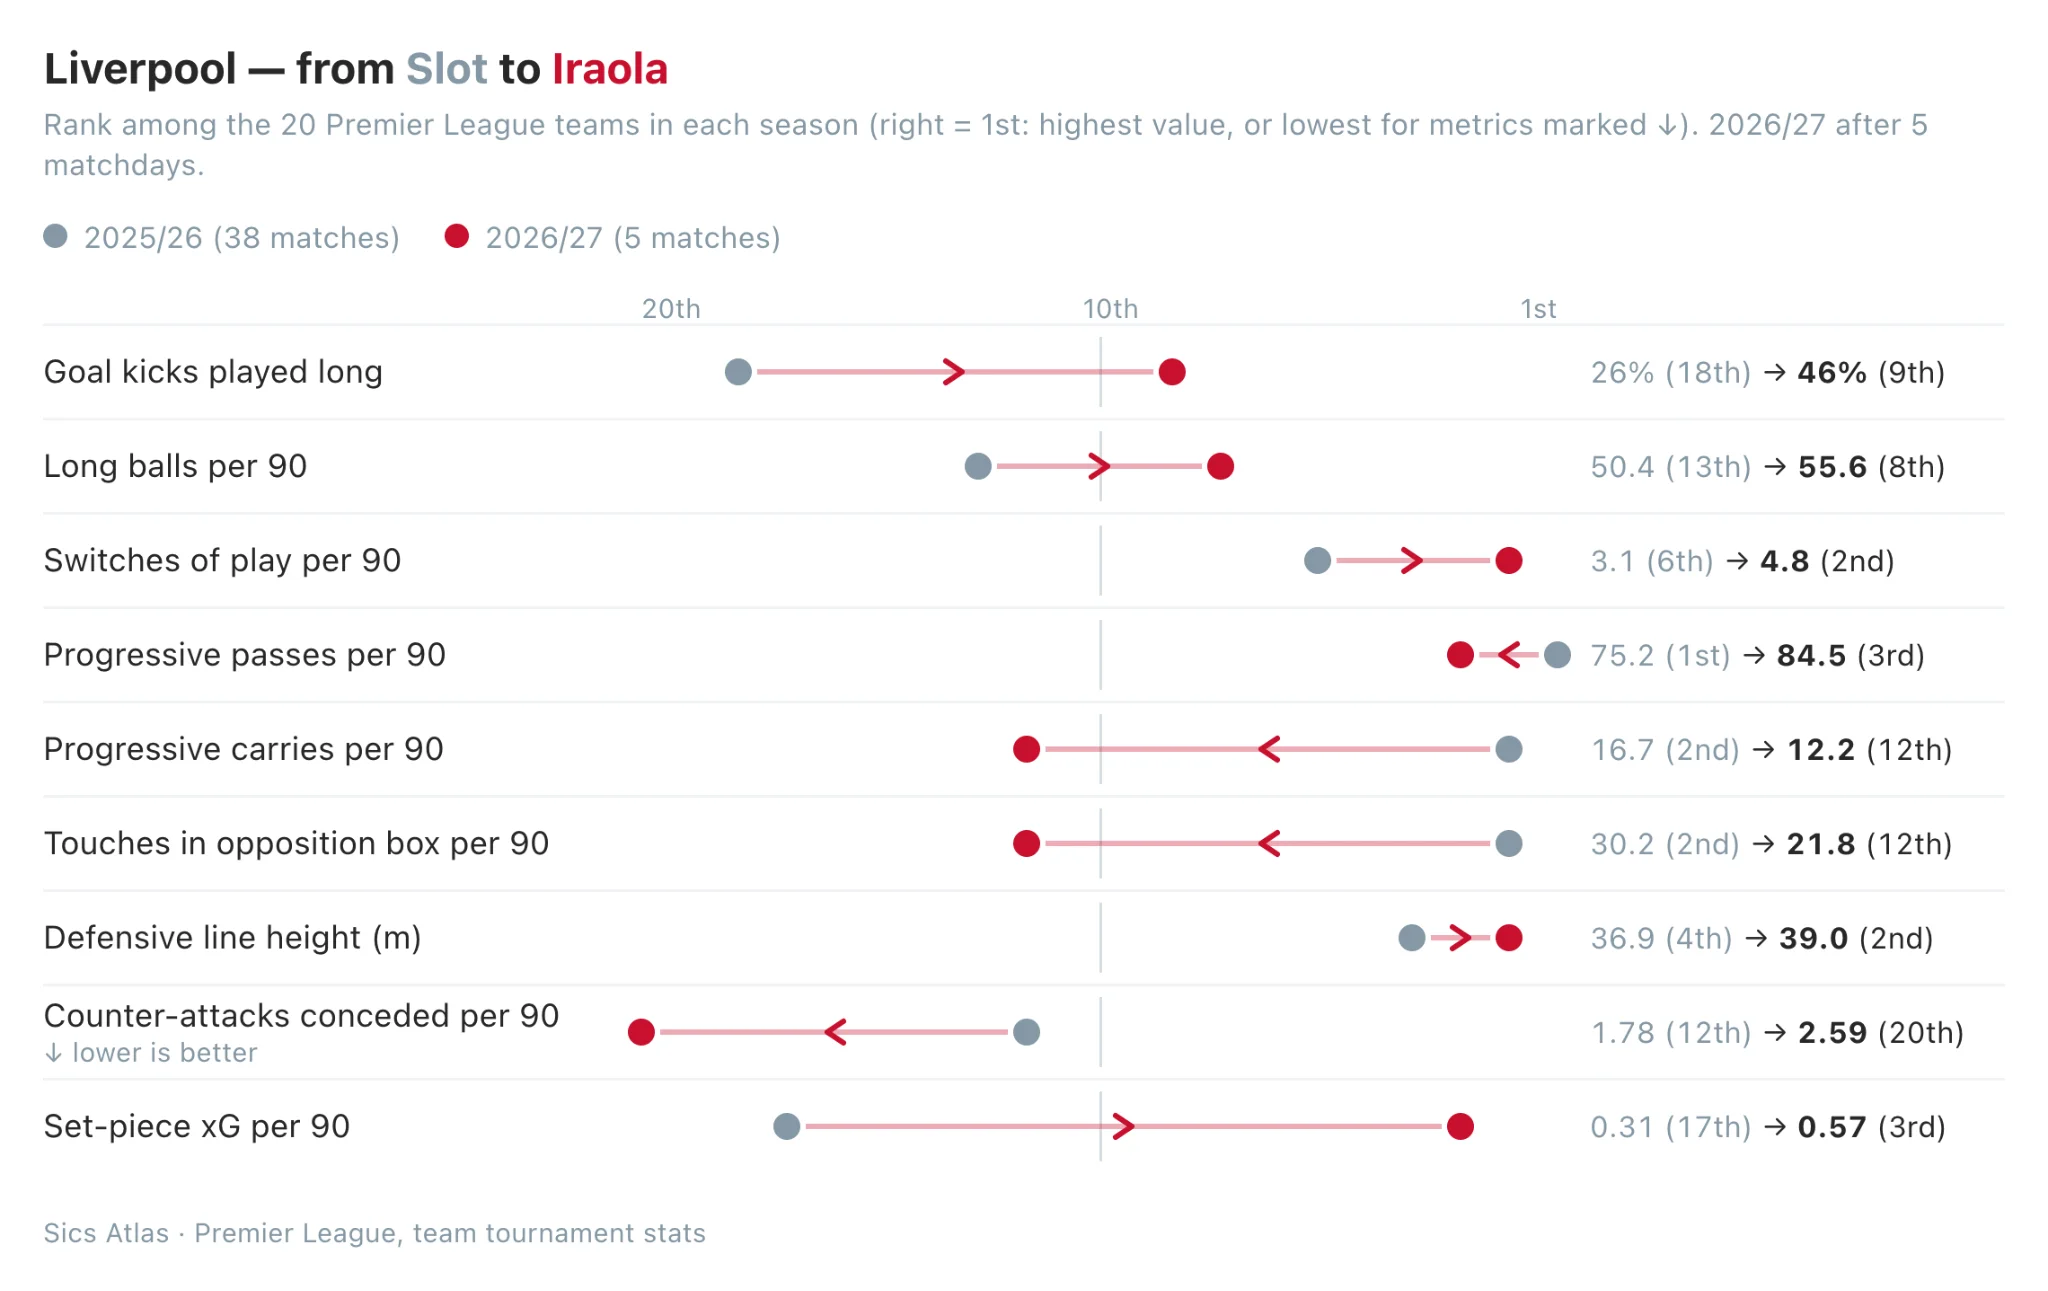
The biggest change is how Liverpool move the ball. Under Slot they progressed it by carrying: they ranked 2nd in the league for progressive carries. Under Iraola they pass it forward and long. Long goal kicks rose from 26% to 46%, so Liverpool went from one of the league's most patient sides on restarts to almost exactly the league average (49%). Long balls and switches of play are up too, with switches now 2nd in the league at 4.8 per 90. Progressive passes climbed from 75 to 84 per 90.
Possession hasn't changed: 55.6% in both seasons. What has changed is how long Liverpool keep the ball. They now average 7.0 passes per possession, down from 8.0, and each possession lasts 32 seconds instead of 36. The ball travels forward faster, but it arrives in the box less often. Liverpool's touches in the opposition box fell from 30 per 90 (2nd) to 22 (12th), and their average shot is now taken more than two metres further out (18.3 m, up from 16.1).
The more visible change is without the ball. Liverpool's defensive line is 2.1 m higher, the 2nd highest in the league. The cost of that line shows up straight away: Liverpool face 2.6 counter-attacks per 90, more than any other Premier League team.
So where does the improved defensive record come from? Liverpool have conceded 4 goals in 5 games with three clean sheets, but their xG conceded per 90 (1.17) is no better than last season's (1.06). Last year they conceded 53 goals from 45 xG. That gap has closed, rather than the defence actually tightening. One genuinely new weapon is set pieces: set-piece xG has almost doubled, from 17th in the league to 3rd.
Manchester City: more control, less chaos
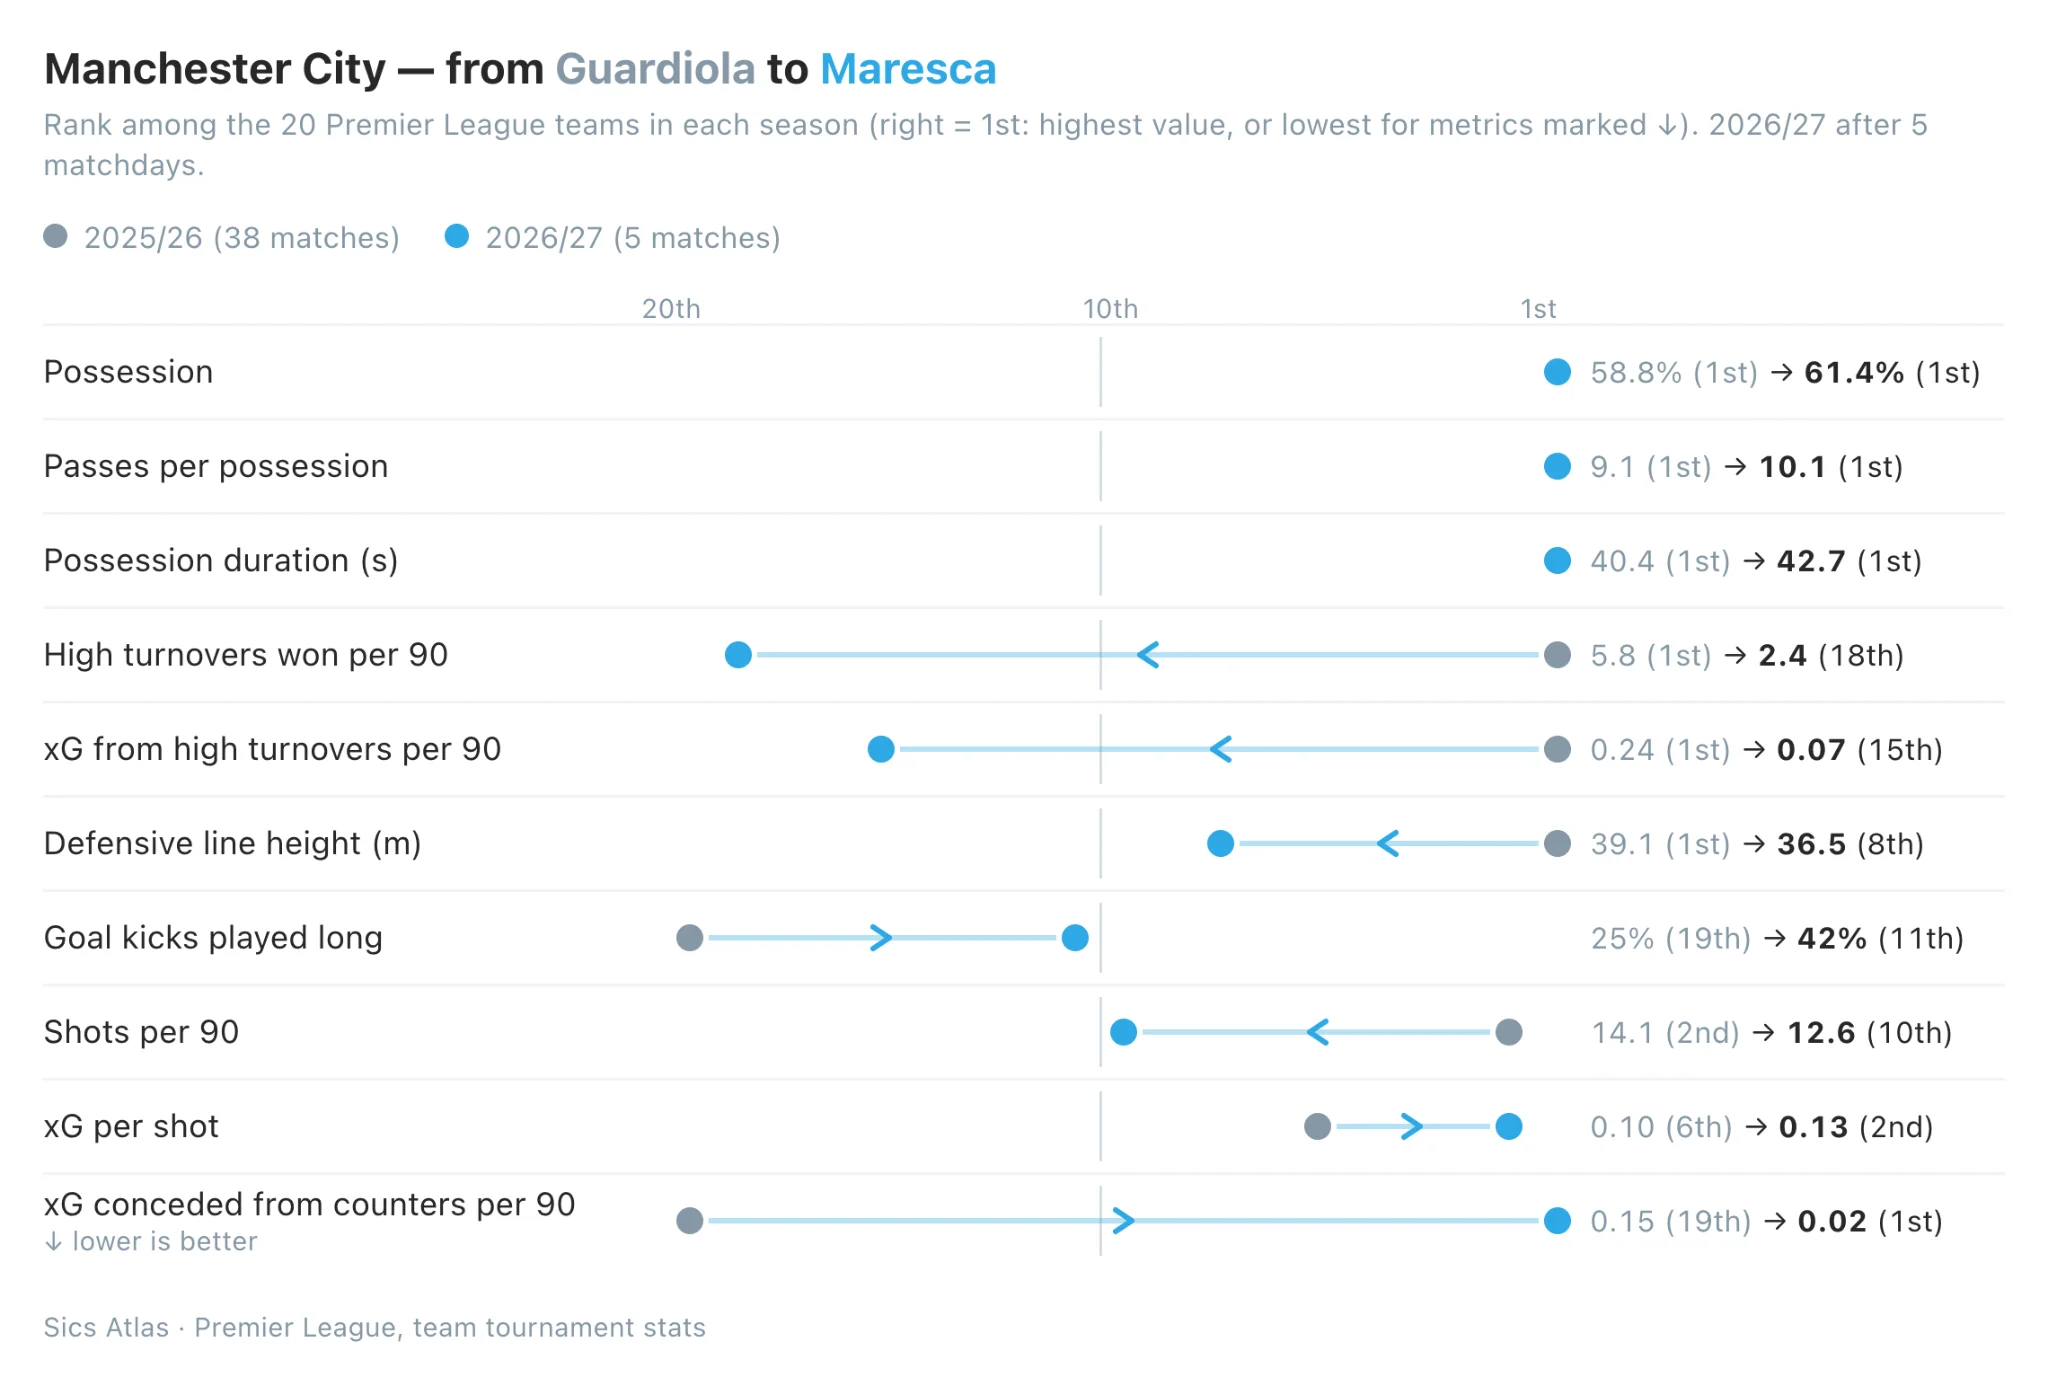
City were already the league's possession side. Under Maresca they are even more so: possession is up to 61.4%, passes per possession to 10.1 (the league average is 6.7), and possessions now last 42.7 seconds. They lead the league in all three. The structure has also become fixed. Last season City used nine different formations, with the 4-1-4-1 (31% of minutes) the most common. This season they have played every minute in a 4-2-3-1.
What City have given up is winning the ball high. Last season they led the league in high turnovers (5.8 per 90) and in xG from them (0.24 per 90). This season they are 18th and 15th. The defensive line has dropped from the league's highest to 8th. City now press less, defend a little deeper, and build again from their own half. They also play long more often from goal kicks: 42% now, against 25% last season.
The trade-off pays off in two places. City take fewer shots (12.6 per 90 against 14.1), but those shots are better: 0.13 xG per shot, 2nd in the league, and the shortest average shot distance of all 20 teams. And with that much of the ball, their rest defence has barely been tested. City concede 0.02 xG per 90 from counter-attacks, the lowest figure in the league. Five straight wins also flatter the underlying numbers: 13 goals from 9.4 xG.
The preview: the possession side against the vertical one
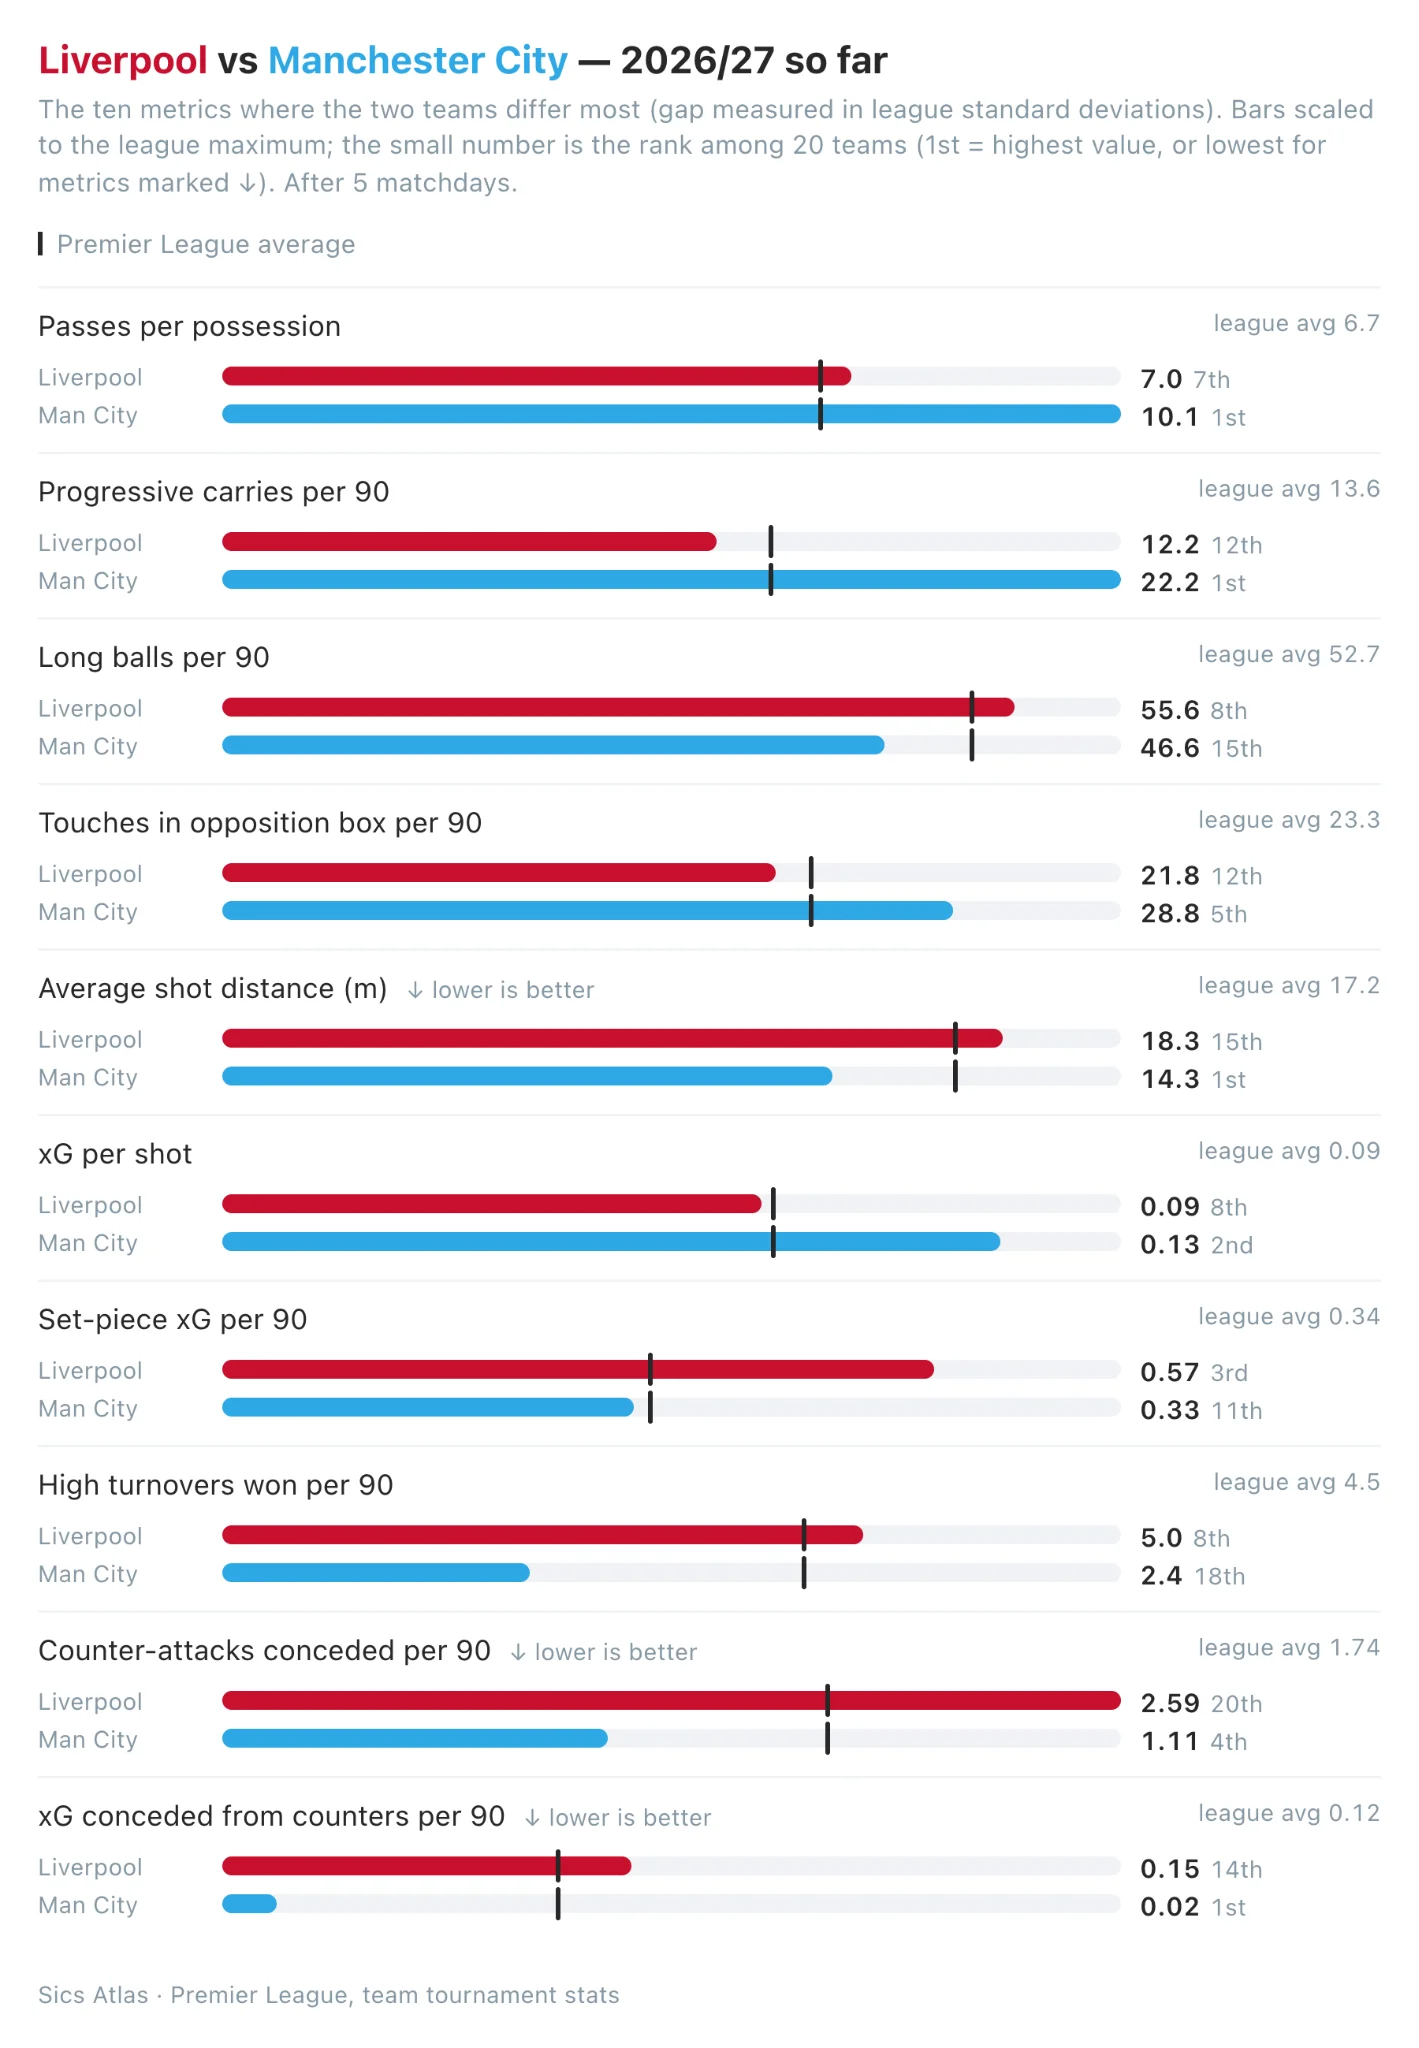
The two teams have nearly identical attacking output: 1.63 xG per 90 for Liverpool and 1.73 for City. The chart shows the ten metrics where they are furthest apart, and they all point the same way. The two sides produce their chances in opposite ways.
City carry, Liverpool kick. City keep the ball longer than anyone (10.1 passes per possession) and lead the league in progressive carries (22.2 per 90, against Liverpool's 12.2). Liverpool go long more often: 55.6 long balls per 90 against City's 46.6.
City get closer. City take their shots from 14.3 m on average, the shortest distance in the league, at 0.13 xG per shot. Liverpool shoot from 18.3 m (0.09 xG per shot) and touch the ball in the box far less (21.8 against 28.8 per 90).
The press against the build-up. Liverpool win the ball high twice as often as City (5.0 against 2.4 per 90). Their pressing will have to disrupt the league's most patient build-up.
Liverpool's high line is the key matchup. No team concedes more counter-attacks than Liverpool (2.59 per 90). City concede the fewest dangerous ones (0.02 xG per 90). City are not a counter-attacking side (1.1 counters per 90, 18th), but this is the one game where they may find space behind a line pushed up to 39 metres.
Set pieces as Liverpool's edge. Liverpool's 0.57 set-piece xG per 90 is 3rd in the league. City sit mid-table at 0.33.
The match should test both new managers. Iraola's Liverpool will want to make it fast and vertical, while Maresca's City will try to slow it down and keep the ball.
Our prediction: goals, and not all from open play
What should we expect, given how the two teams have played so far?
Goals, at both ends. If we put each side's chance creation (xG) against the other's chance prevention (xG conceded), both relative to the league average, the numbers point to about 3.1 expected goals. The Premier League average this season is 2.8 per match. On those rates, the chance of three or more goals is around 60%, and so is the chance that both teams score. The single most likely score is 1-1, but the balance tips towards City: 42% City win, 24% draw, 34% Liverpool win. Last season's full 38-game numbers give almost the same answer (2.9 goals, 45/24/31), so this isn't an artefact of a five-game sample.
A Liverpool goal from a set piece. This is Liverpool's clearest new weapon, and it is also where City look less secure than they did. Last season City allowed 2.2 set-piece shots per 90, the 2nd fewest in the league. This season the figure is 4.1, the 5th most. Those shots have mostly been low quality, at 0.30 xG per 90, below the league average. Still, a corner or free kick is Liverpool's most realistic route to a clean chance against a City side that lets opponents touch the ball in the box less than almost anyone.
Liverpool shooting from distance. Four in ten Liverpool shots come from outside the box (5.7 per 90, 4th in the league). City are the opposite: they take the fewest shots from range of any team (3.0 per 90). If City close the middle as usual, expect Liverpool to try their luck from 20 metres or more. That suits City, because those are the chances least likely to go in.
A City goal on the break? Liverpool's high line invites it. They concede the most counter-attacks in the league and have already let in two goals on the break, the 3rd highest total. Last season Guardiola's City scored 11 counter-attack goals, more than anyone. Maresca's City rarely play that way, though, with 0.55 counter-attack shots per 90 (15th). A counter-attack goal is the scenario Liverpool's structure allows, but it isn't City's first choice. Their more likely route is a long spell of possession that ends with a shot from close range.
Our call: Liverpool 1-2 Manchester City. On the numbers, 1-1 is the single most likely score, at around 11%. But when one side edges it, the model says City more often than Liverpool, so we're taking the next step: 1-2, at around 9%. Both teams score, there are goals in the game, and City win on chance quality. Liverpool's goal comes from a set piece or a shot from distance.
How we built this comparison
All the data in this edition comes from SICS Atlas. One of the tools that makes this kind of analysis faster is the renewed Team Report: a clear, in-depth overview of a team's playing style, broken down by phase and game situation, which can be downloaded for any team on the platform.
The report can now be filtered by competition, venue, number of matches and head coach. That means a team's matches can be split by the manager in charge, and a report generated for one coach, or for any combination of them.*
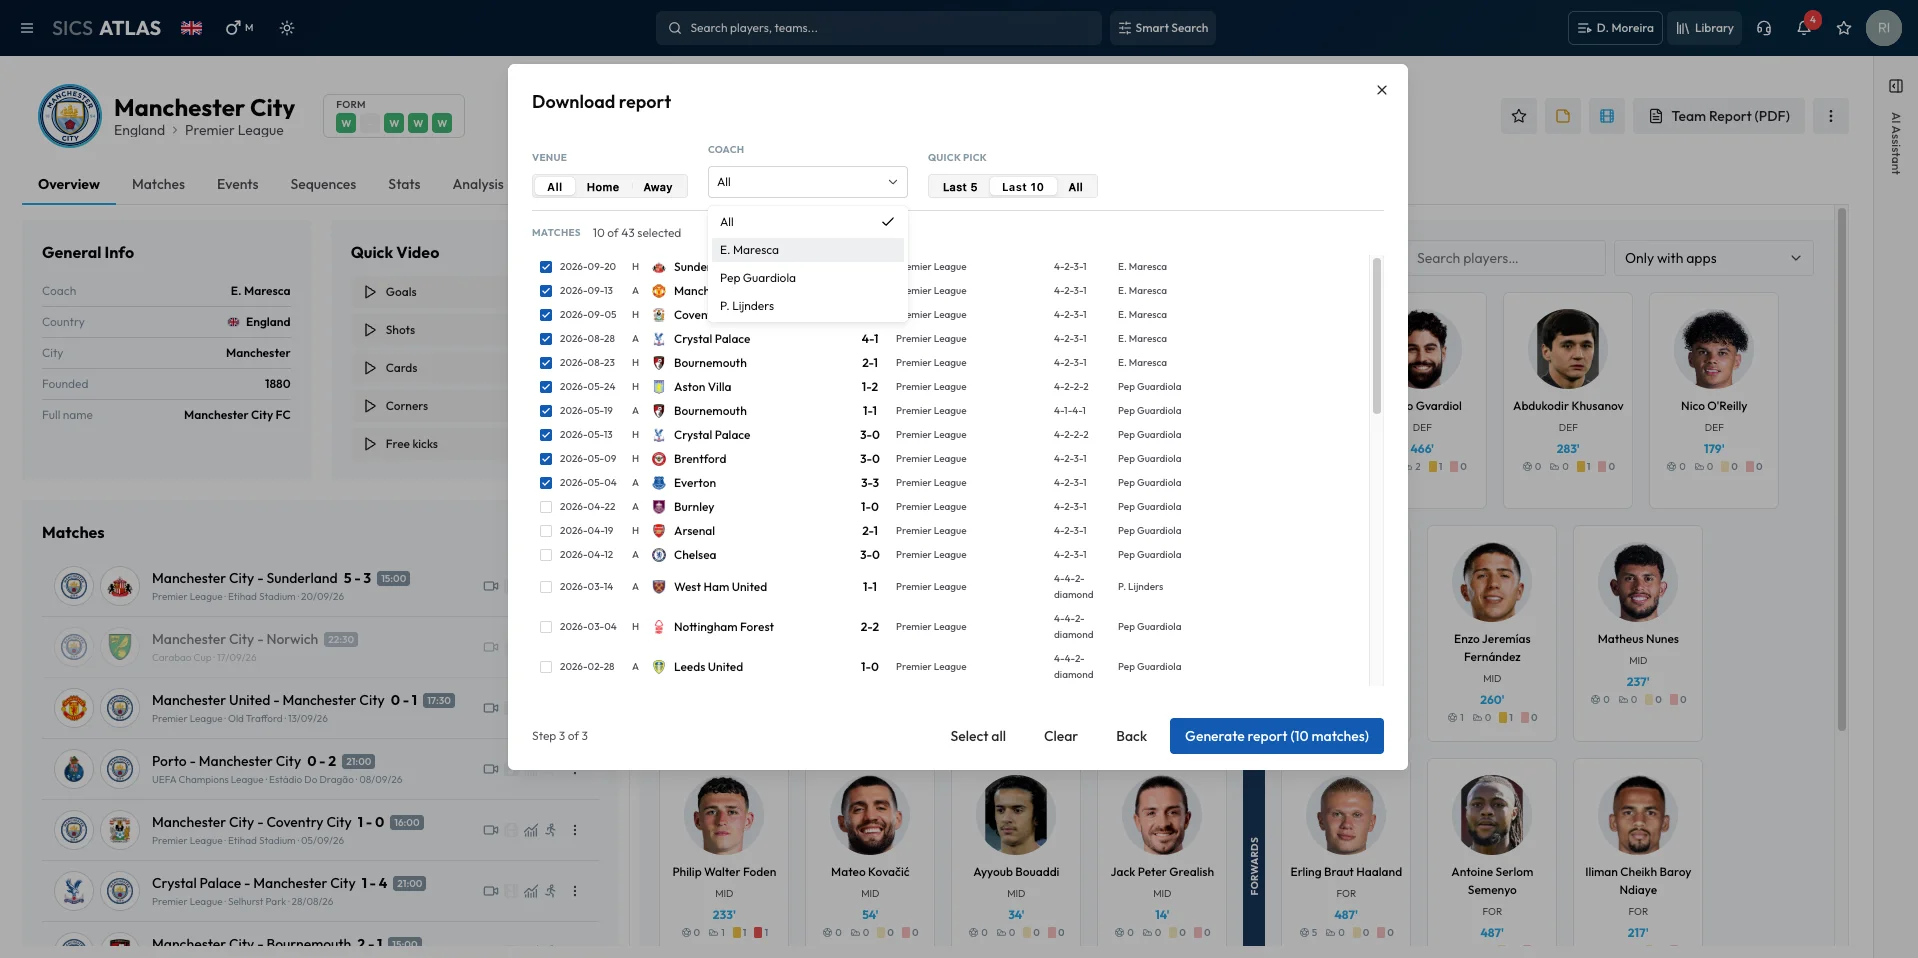
*The coach filter is most useful when a manager changes during the season. For Liverpool and City, both changes happened over the summer, so the split by coach also matches the split by season.
Download the Team Reports
Liverpool, Premier League 2026/27 under Andoni Iraola: Team Report Link
Manchester City, Premier League 2026/27 under Enzo Maresca: Team Report Link
Data: SICS Atlas, Premier League team tournament stats. 2026/27 figures after five matchdays (to 20 September 2026). Per-90 values use effective minutes, including stoppage time. The prediction uses a Poisson model built on each team's xG for and against per match, relative to the league average.