Reading the 2025/26 Season Through xPoints

What the Metric Measures
The five domestic leagues that matter most in European football have now concluded. Final tables are published and results are recorded, but the official standings capture only one dimension of how the season actually unfolded.
Expected Points (xPoints) provide an alternative read. The metric estimates how many points a team should have accumulated based on the quality of chances created and conceded across each match, rather than on the actual scoreline. The calculation builds on Expected Goals (xG): by modelling the xG values generated by both teams in a fixture, it becomes possible to assign a probability to each possible outcome, win, draw, or loss, and convert those probabilities into points. Summed over 38 matchdays, the result is an alternative league table.
One important baseline: a gap between actual points and xPoints is a structural feature of the model, not a signal of anomaly in itself. A team that wins a match earns exactly three points, but even the most dominant performance will rarely generate xPoints above 2.8 or 2.9. The meaningful signal is positional: when a team's place in the actual table diverges significantly from its xPoints ranking, particularly in ways that affect relegation, survival, or European qualification, there is something worth examining.
Serie A: The Juventus and Napoli Inversion
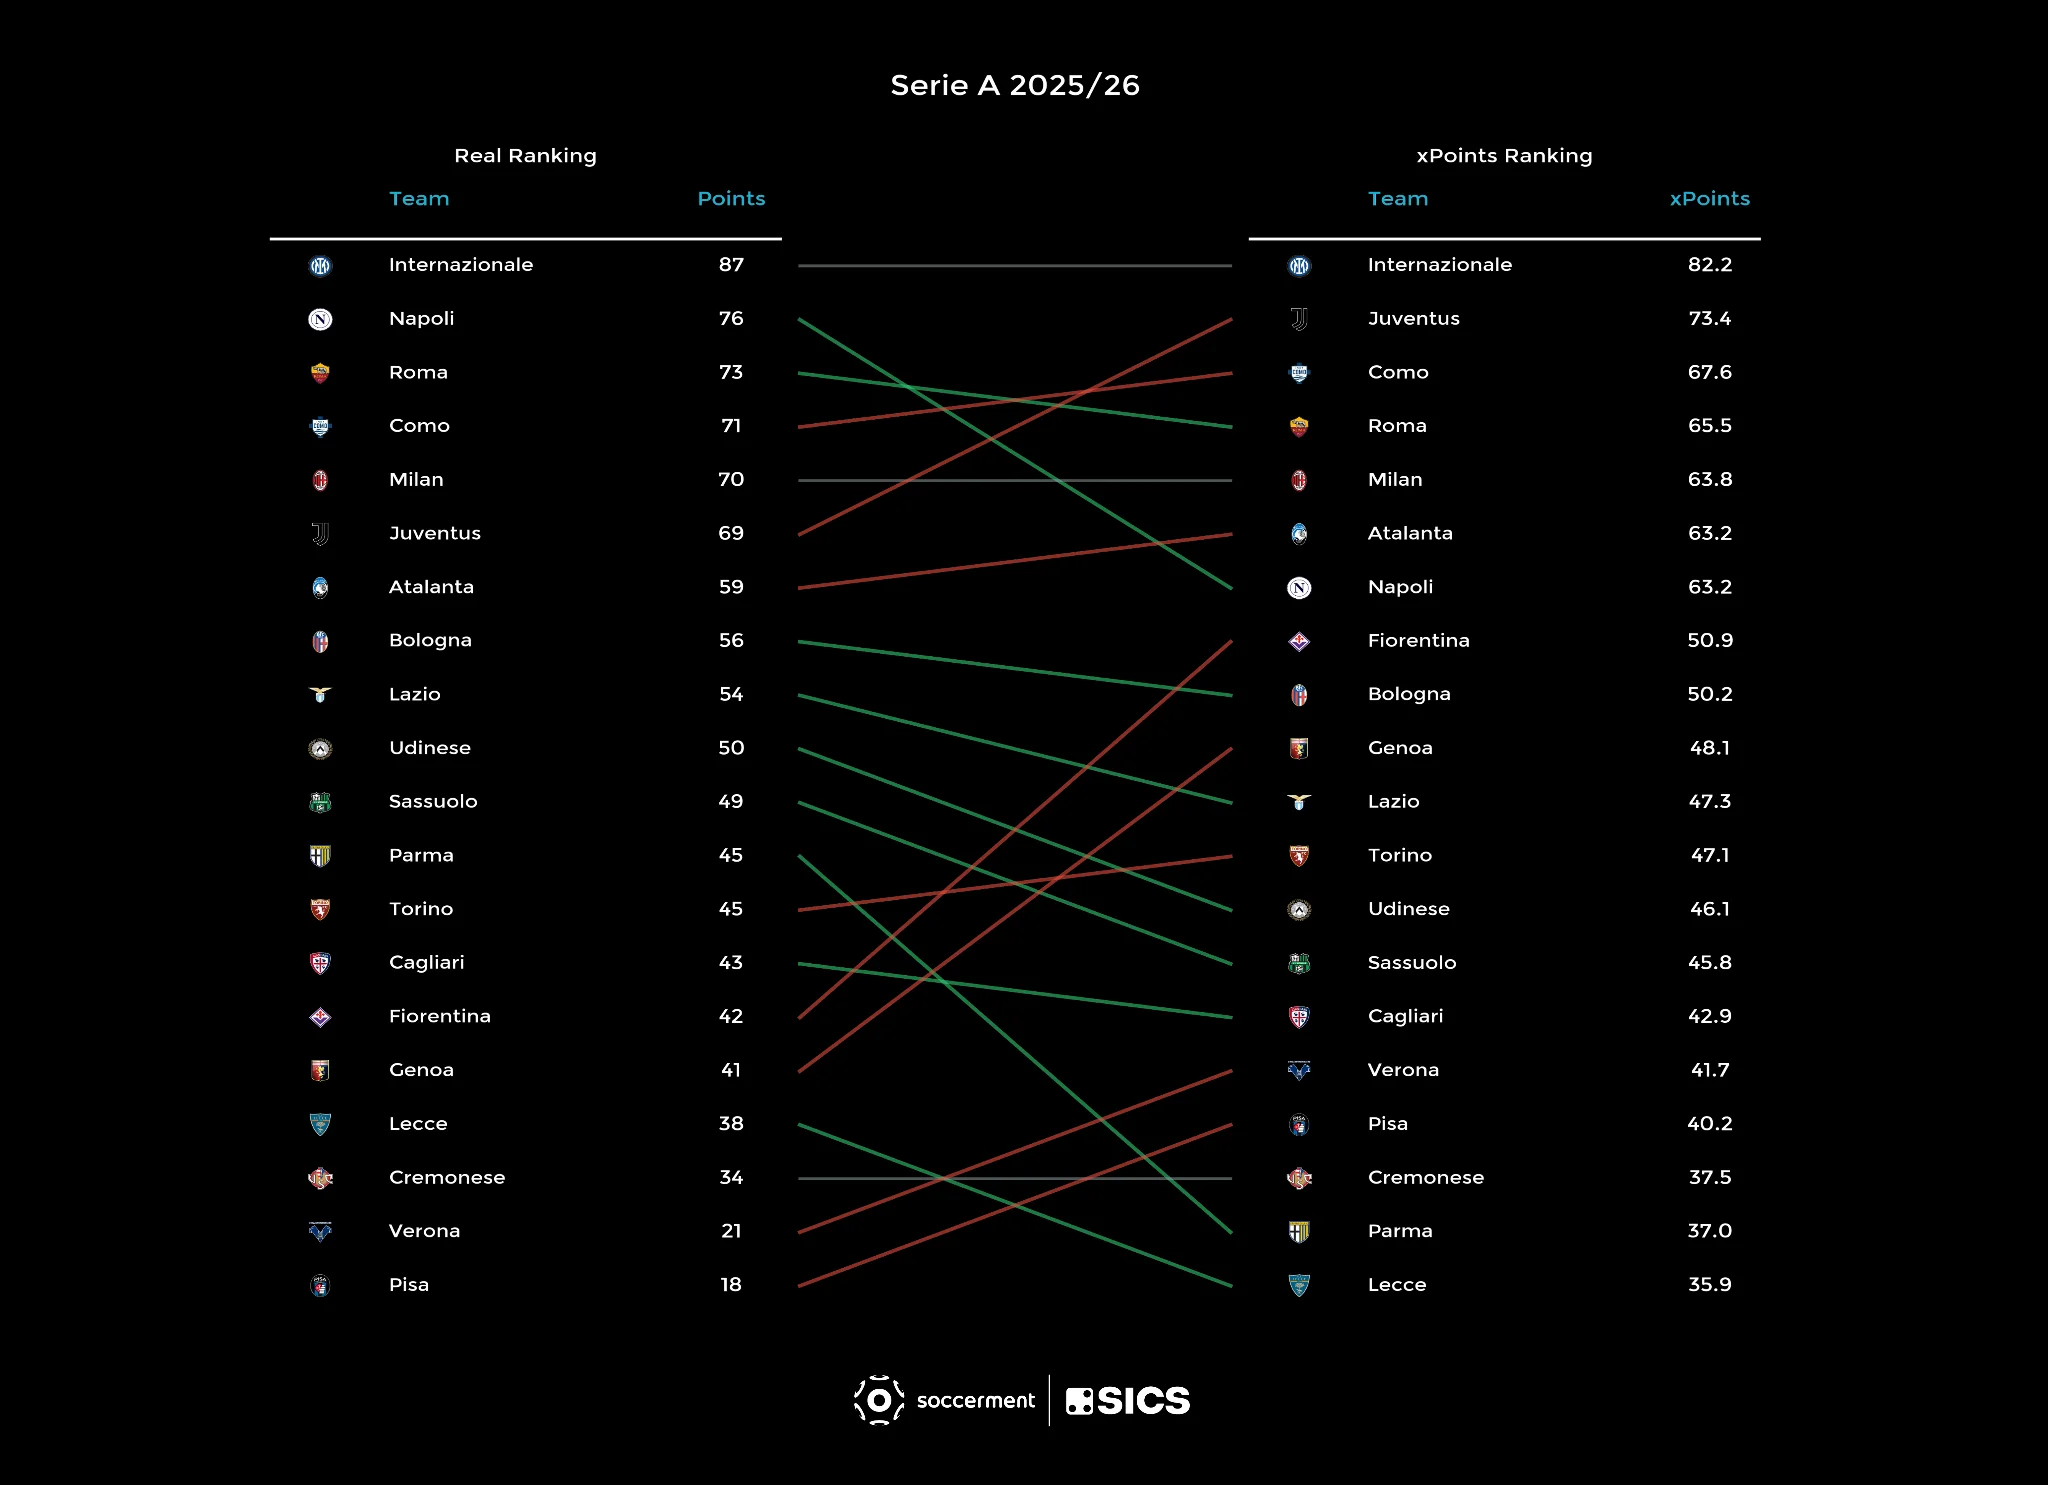
The title picture is clear: the team that won Serie A also led the xPoints table. The more interesting story sits lower.
The bottom three clubs by xPoints were Lecce, Parma and Cremonese. Of those, only Cremonese were actually relegated. Lecce and Parma both extracted more points from their situations than the underlying data would predict, a pattern consistent with efficient goalkeeping and variance in finishing at critical moments.
Verona and Pisa move in the opposite direction. Both recorded significantly fewer points than their xPoints totals, a result of poor conversion of chances created combined with conceding more than the quality of opportunities against them would suggest.
The most significant positional shift in the table involves Napoli and Juventus, whose positions are reversed in the xPoints comparison. Juventus scored 61 goals across the season against an xG of approximately 71, a ten-goal gap that reflects consistent offensive underperformance, compounded by costly goalkeeping errors at the back.
Premier League: Sunderland and Aston Villa
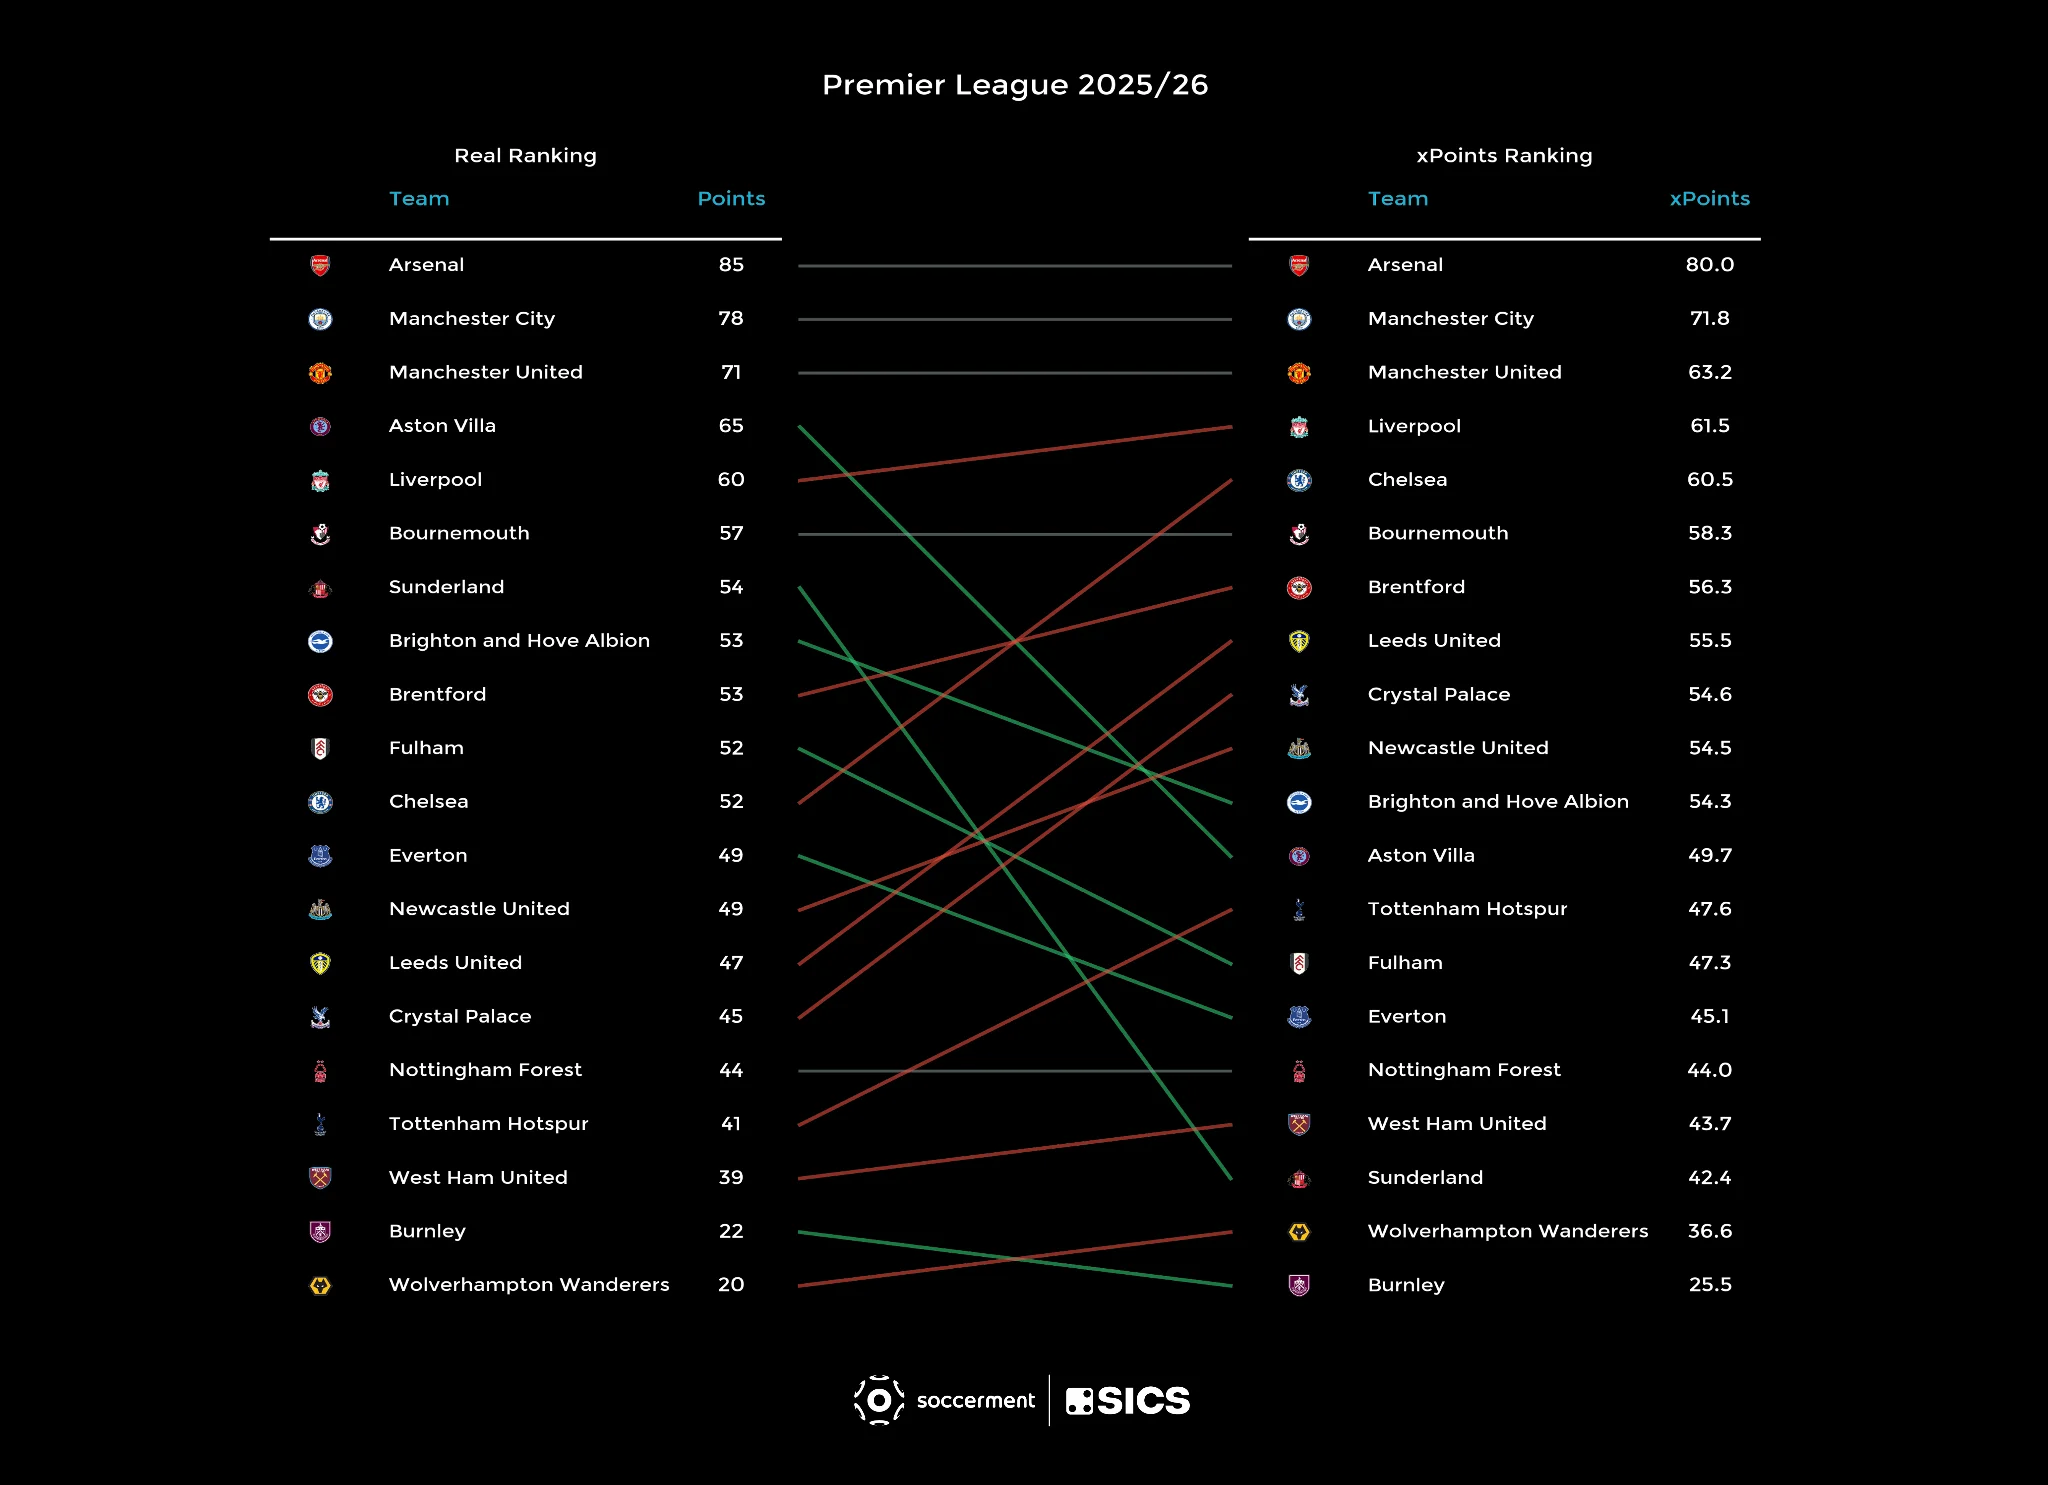
At the top, the Champions League picture holds in both tables. Arsenal, Manchester City, Manchester United and Liverpool occupy the same four positions in the actual standings and the xPoints ranking. At the bottom, Burnley and Wolves are last in both measures.
The divergences that matter are elsewhere. Aston Villa finished 4th, qualifying for the Champions League. Their xPoints ranking is 12th. The gap of eight positions is the largest positive divergence in the division, and reflects a season in which results consistently ran ahead of the underlying quality of chances produced and allowed.
Sunderland present an equally extreme case in different circumstances. They finished 7th, earning a place in next season's Europa League, a notable result for a recently promoted side. Their xPoints total, however, places them in the relegation zone. Across the full season, their actual results ran well ahead of what the chance data would predict, in both attack and defence.
La Liga: Getafe and the Relegation Picture
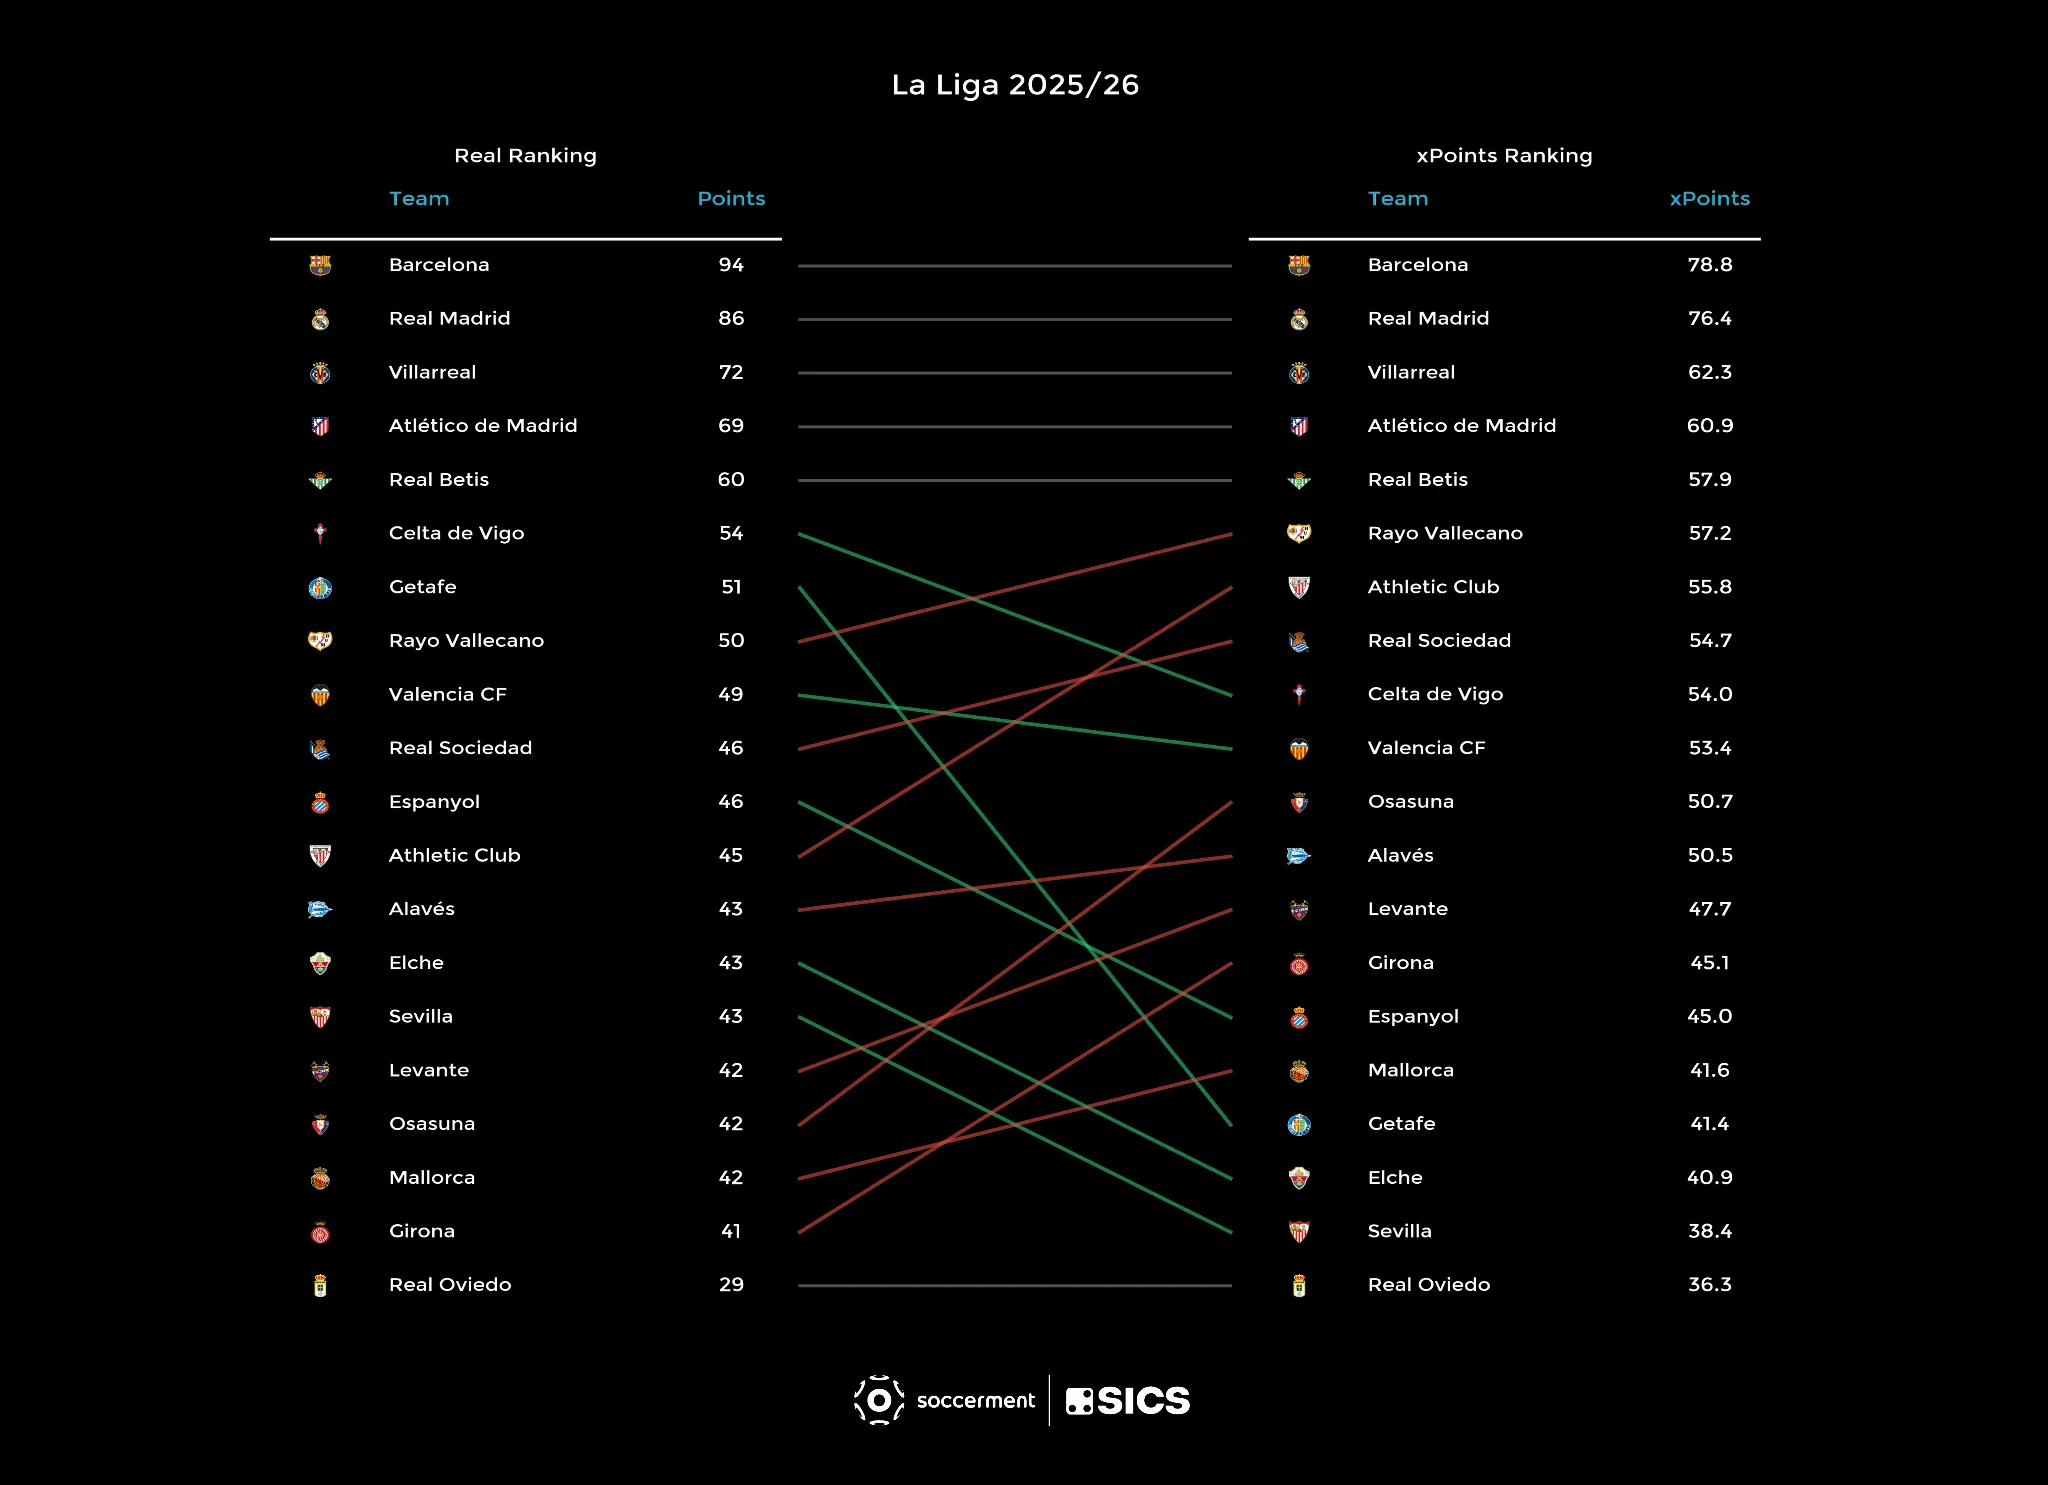
The top five positions in La Liga are identical in the actual table and the xPoints ranking. Below that, the picture shifts.
The clearest case is Getafe. They finished 7th and qualified for the Conference League, their best historical finish. Their xPoints position is in the zone just above relegation. The gap between the two is the most pronounced in the division.
In the relegation zone, the data points in a different direction from the official outcome. Girona and Mallorca were relegated. By xPoints, Sevilla and Elche would have gone down in their place. That said, the lower half of La Liga was tightly compressed throughout the season, and several clubs in that zone recorded very similar actual and xPoints totals. Small margins translated into large positional consequences when the table was that tight.
Bundesliga: A Coherent Season
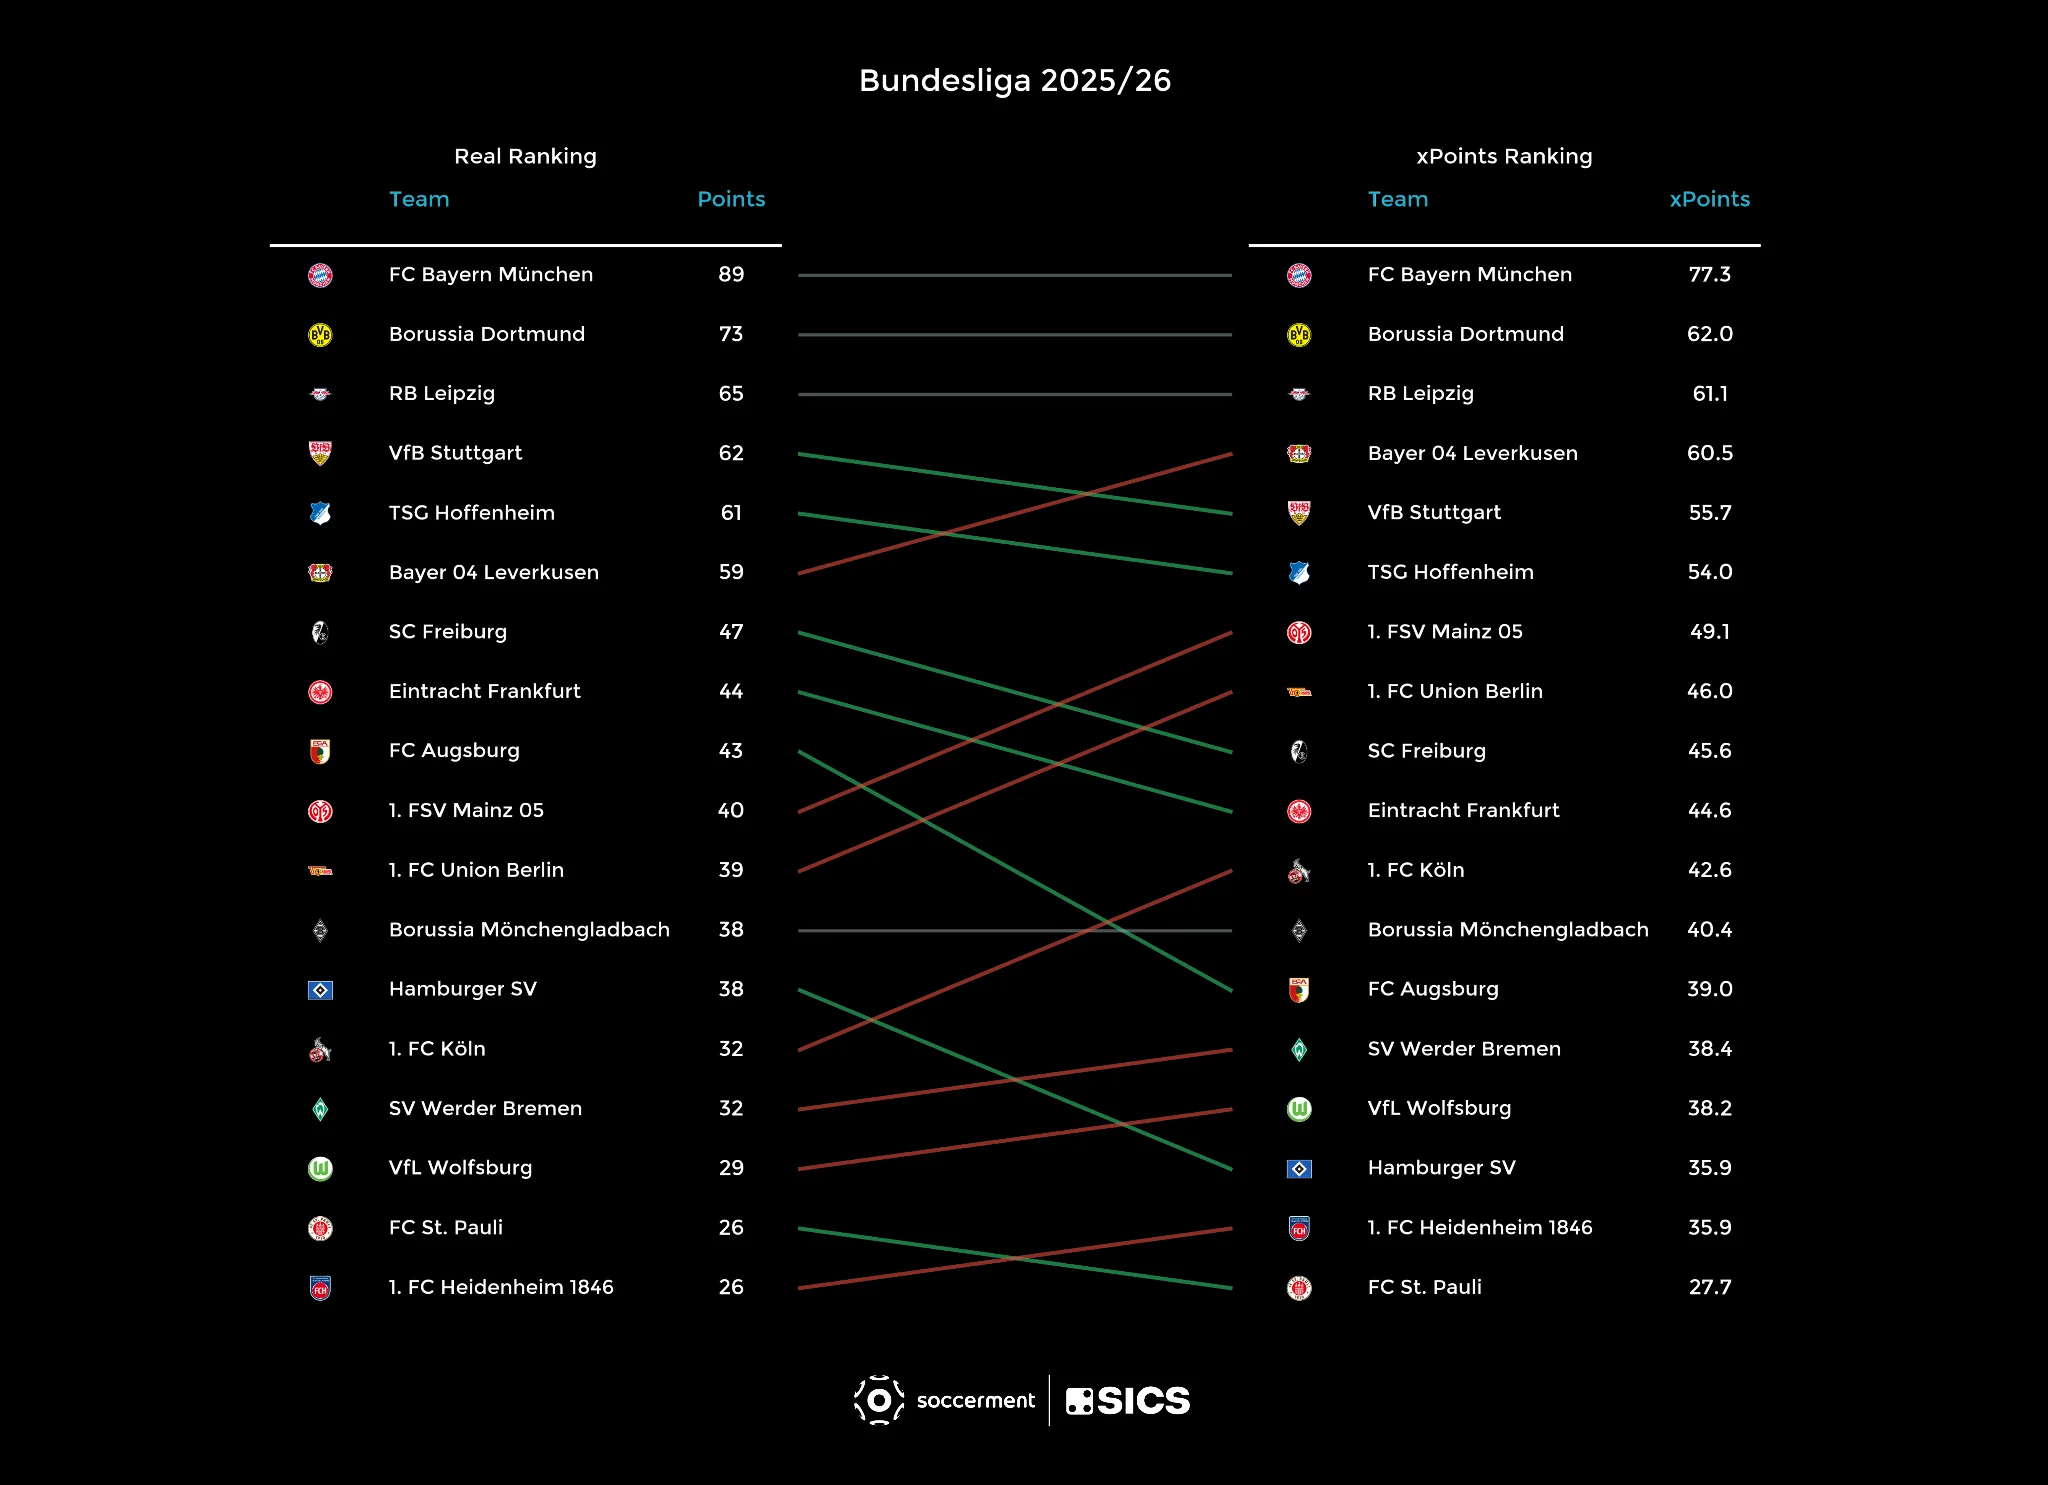
Bayern Munich, Borussia Dortmund and RB Leipzig occupy the same top three positions in the actual table and the xPoints ranking. Across the division as a whole, the Bundesliga is the most internally consistent of the five leagues on this measure, with no significant positional divergences in the relegation or European qualification zones that would alter the main narratives of the season.
Ligue 1: Angers, Lyon, and Rennes
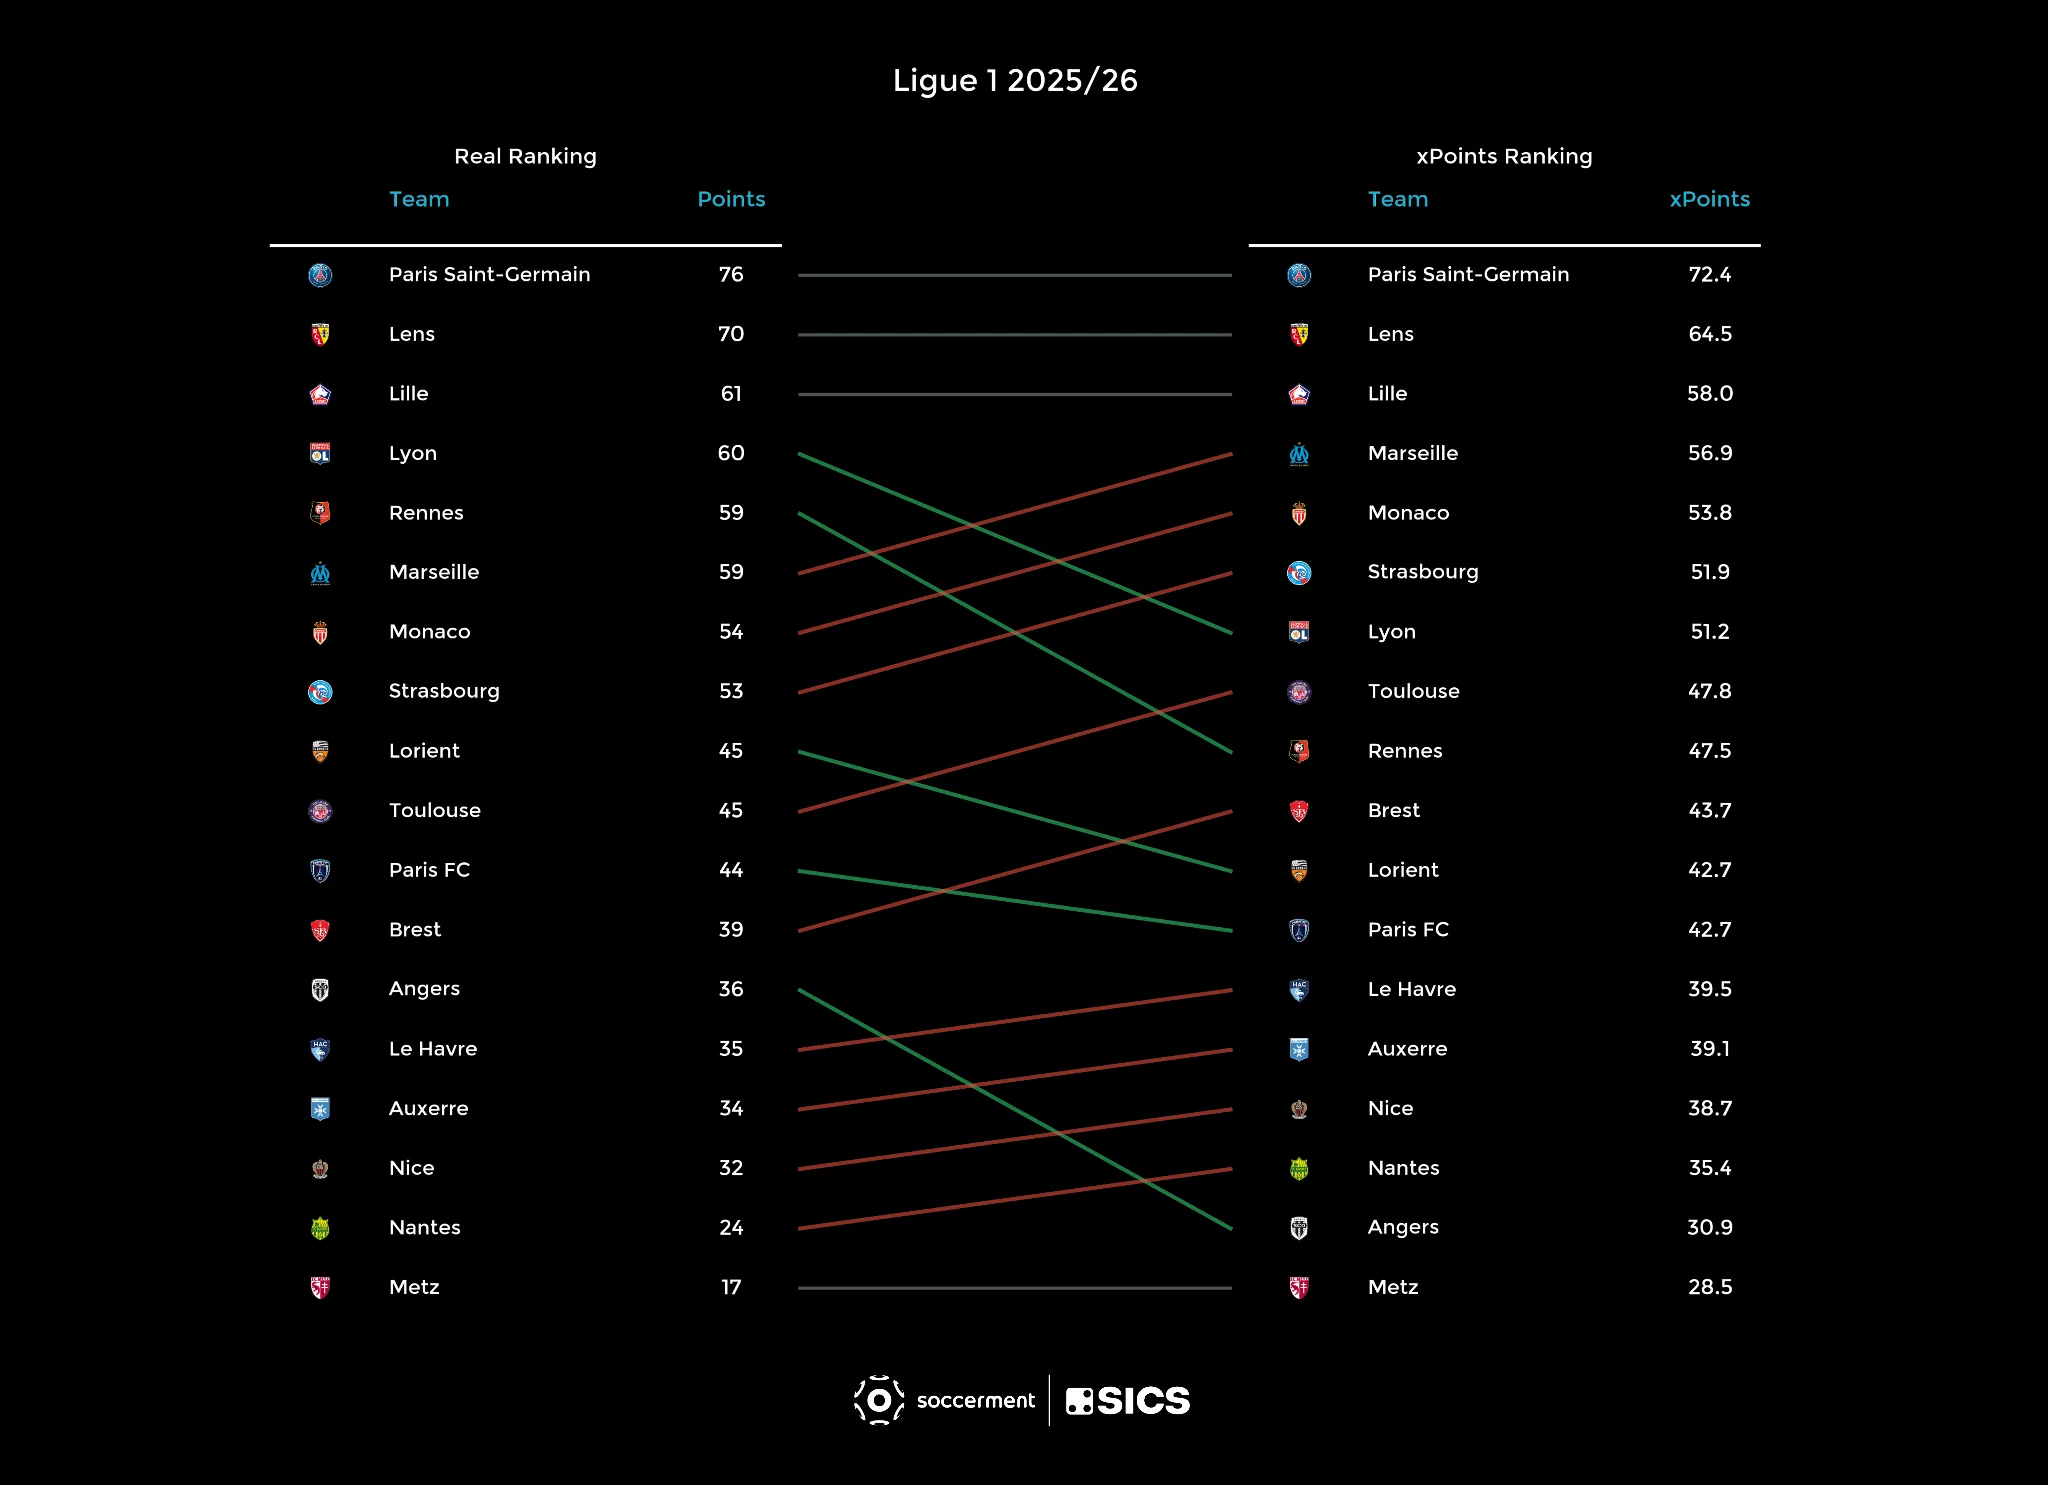
PSG, Lens and Lille hold the same top three positions in both tables.
The most significant anomaly in Ligue 1 is Angers. They finished 13th in the actual standings, comfortably clear of any danger. In the xPoints table they rank 17th, in the relegation zone. The data places them among the three weakest sides in the league by underlying performance across the season.
Among the clubs who finished in European qualification positions, Lyon and Rennes both recorded actual finishes that ran ahead of the xPoints data. Lyon finished 4th with 60 points; their xPoints total of 51.2 places them 7th. Rennes finished 5th with 59 points; their xPoints total of 47.5 places them 9th. Both clubs held European spots on the basis of results that the underlying chance data does not fully reflect.
Conclusion
Across five leagues, the xPoints tables confirm what the official standings suggest at the top: the champions earned their titles, and the table broadly reflects the quality of teams in the upper positions. The more productive lens is further down, in the mid-table, the European qualification places, and the relegation picture, where the gap between results and underlying performance can be substantial and where it carries real consequences.
In 2025/26, that gap produced a seventh-place club whose xPoints total placed it in the relegation zone (Sunderland in the Premier League), a fourth-place Champions League qualifier whose xPoints ranking was 12th (Aston Villa), and a Conference League qualifier whose xPoints position was barely above the drop (Getafe in La Liga). These are not arguments about fortune or misfortune. They are a different reading of the same season.
Technical Appendix: How Are xPoints Calculated?
The xPoints model transitions from individual shot probabilities (xG) to match outcome probabilities.
1. Goal Distribution Modelling
The core assumption of most baseline models is that the number of goals scored by a team follows a Poisson distribution, where the mean is equal to the team’s total xG in that match.
The probability of a team scoring exactly k goals, given an expected goals value (xG), is calculated using the Poisson formula:
P(G = k) = (e^(-xG) * xG^k) / k!
Where "e" is Euler's constant (~2.718) and "k!" is the factorial of the goals.
Concrete Example: From xG to Goal Probabilities
Let's say the Home Team finishes a match with a total of 1.7 xG. By plugging this value into the formula, we get the exact probability of them scoring a specific number of goals:
- 0 Goals: ~18.3%
- 1 Goal: ~31.1%
- 2 Goals: ~26.4%
- 3 Goals: ~15.0%
- 4+ Goals: ~9.2%
Using the respective xG values of the Home Team and the Away Team, we can construct two of these goal distributions.
2. Calculating Match Outcome Probabilities
Assuming independence between the two scoring processes, the probability of any specific scoreline is simply the product of the individual probabilities.
- Probability of a Draw: The sum of all symmetrical scorelines (0-0, 1-1, 2-2, etc.). For example, P(1-1) = P(Home scores 1) * P(Away scores 1).
- Probability of a Home Win: The sum of all scorelines where the home team scores more goals than the away team.
- Probability of an Away Win: The sum of all scorelines where the away team scores more goals than the home team.
Naturally, these three states cover all possible match outcomes:
P(Home Win) + P(Draw) + P(Away Win) = 1 (100%)
3. From Probabilities to Expected Points (xP)
Finally, we apply the traditional football scoring system (3 points for a win, 1 point for a draw). The Expected Points for the Home Team (xP) are calculated as:
xP = [3 * P(Home Win)] + P(Draw)
By summing the xPoints obtained across all 38 gameweeks, we generate the alternative "deserved" league table.
Final Observation
One may wonder why xPoints models are typically based directly on expected goals rather than on more sophisticated machine learning models trained to predict match outcomes or points. The main reason is that expected goals already provide an estimate of a team's underlying scoring process. Since match points are entirely determined by the number of goals scored and conceded, modelling the goal distributions from xG values is a natural and parsimonious approach.
In the long run, a team's total goals scored tend to converge towards its accumulated xG, while goals conceded tend to converge towards the xG against. As a result, xG already contains most of the information required to estimate future results and points. Building an additional predictive layer on top of xG often adds complexity without introducing substantial new information.
By treating goals as Poisson-distributed random variables whose expected value equals the team's xG, we can directly derive the probabilities of wins, draws, and losses from the underlying chance creation process. This approach is transparent, mathematically grounded, and closely linked to the fundamental relationship between chance quality, goals, and points.