


Introduction
The Championship season has now concluded, and while we await the verdict of the playoff final between Sunderland and Sheffield United, we will delve into an in-depth analysis of the newly promoted Premier League teams. Our focus will also extend to the two sides contesting the playoff final for the last available Premier League spot. Leeds United and Burnley are the two teams confirmed for Premier League football next season, having both made an immediate return to the top flight after their recent relegations.
Key Insights
- Championship Dominance: Leeds United and Burnley both achieved 100 points, securing direct promotion with a significant 10-point gap over third place.
- Performance vs. Expected Points: Leeds slightly underperformed their 104.17 xPoints, while Burnley vastly overperformed their 77.87 xPoints.
- Leeds’ All-Round Strength: Leeds excelled offensively, leading in open play goals and xG metrics. Defensively, they were dominant, with impressive counter-pressing stats (GPI 54.8%, GPE 33.1%).
- Burnley’s Defensive Prowess: Despite a more modest offensive output, Burnley stood out defensively, conceding the fewest open play goals per 90 minutes and only 16 goals total, half of Leeds’ tally.
- Sheffield United’s Pragmatism: Sheffield United’s offensive strength came from high turnovers. Their defence was robust, limiting opponents to shots from unfavourable positions despite conceding a fair number of attempts.
- Sunderland’s Dribbling and Long-Range Threat: Sunderland led the league in total dribbles per 90 minutes. While they had lower possession percentage, they showed effectiveness in defence and a remarkable ability to score from outside the box
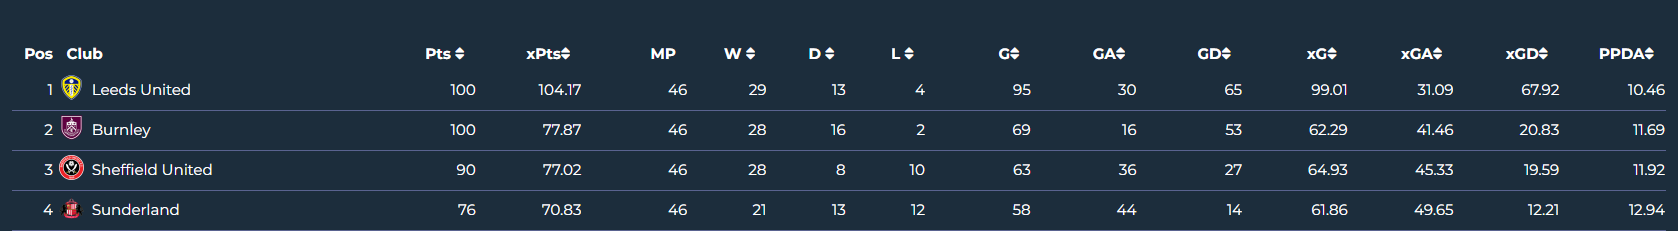
This is the final league table. As we can immediately observe, Daniel Farke’s Leeds United and Scott Parker’s Burnley had an exceptional season, both finishing on 100 points, 10 points clear of third-placed Sheffield United. An initial point of analysis is the over or underperformance of the two teams. We immediately notice that Leeds slightly underperformed relative to their 104.17 xPoints, whereas Burnley significantly overperformed against their 77.87 xPoints. In third position, Sheffield United secured an excellent lead over fourth-placed Sunderland, achieving 90 points, overperforming compared to their 77.02 xPoints. Sunderland finished in fourth position with 76 points. Let’s now proceed with the analysis of the two already-promoted Premier League teams: Leeds and Burnley.
1. LEEDS UNITED – OFFENSIVE AND DEFENSIVE PERFORMANCE
Let’s begin by analysing the performance of the league leaders, who concluded their campaign with 100 points.
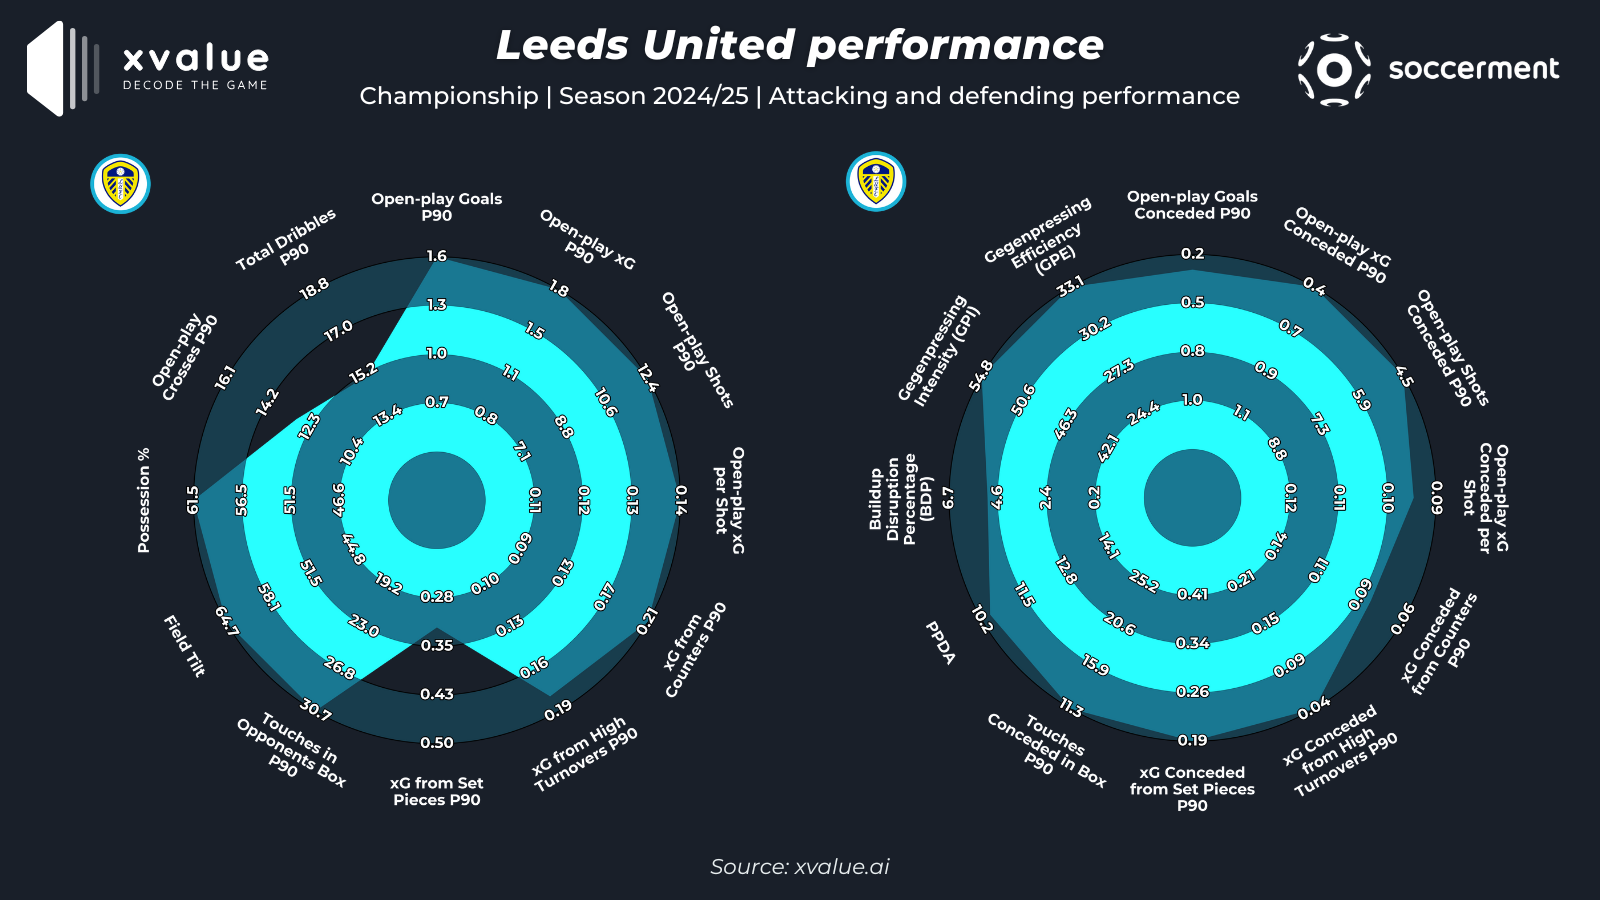
The first radar chart on the left illustrates their offensive performance. We immediately note that Leeds ranks first in almost all metrics within their league.
They are undoubtedly the best team in terms of scoring and efficiency, leading in metrics such as open play goals per 90 minutes, open play xG per 90 minutes, open play shots per 90 minutes, average xG per shot taken, and xG generated from counter-attacks per 90 minutes. Offensive production from set pieces has room for improvement, and it’s certainly something they will work on to increase their chances of survival in the Premier League.
Regarding their playing style, Leeds is clearly a team focused on game dominance, both generally and in the offensive half. They rank first in both Possession % and Field Tilt, with values of 61.5% and 64.7% respectively. This prolonged possession has allowed them to frequently reach advanced and dangerous areas, including the opponent’s penalty box, where they lead in touches per 90 minutes with a value of 30.7.
They do not use the wide channels extensively, being mid-table for open play crosses per 90 minutes and total dribbles per 90 minutes. As for the defensive phase, Leeds boasts even more impressive statistics and rankings compared to their offensive performance. From the radar, we can deduce that they were the best in almost everything.
They only miss the top spot for BDP, which is still positive, and for xG conceded from counter-attacks per 90 minutes.
In the counter-pressing phase, they rank first in both GPI (Gegenpressing Intensity) and GPE (Gegenpressing Efficiency) with impressive values of 54.8% and 33.1% respectively.
2. BURNLEY – OFFENSIVE AND DEFENSIVE PERFORMANCE
Let’s now move on to the analysis of Burnley, the second directly promoted team, who, like Leeds, finished their season with 100 points. However, as mentioned earlier, they significantly overperformed compared to their 77 xPoints. Let’s delve into why.
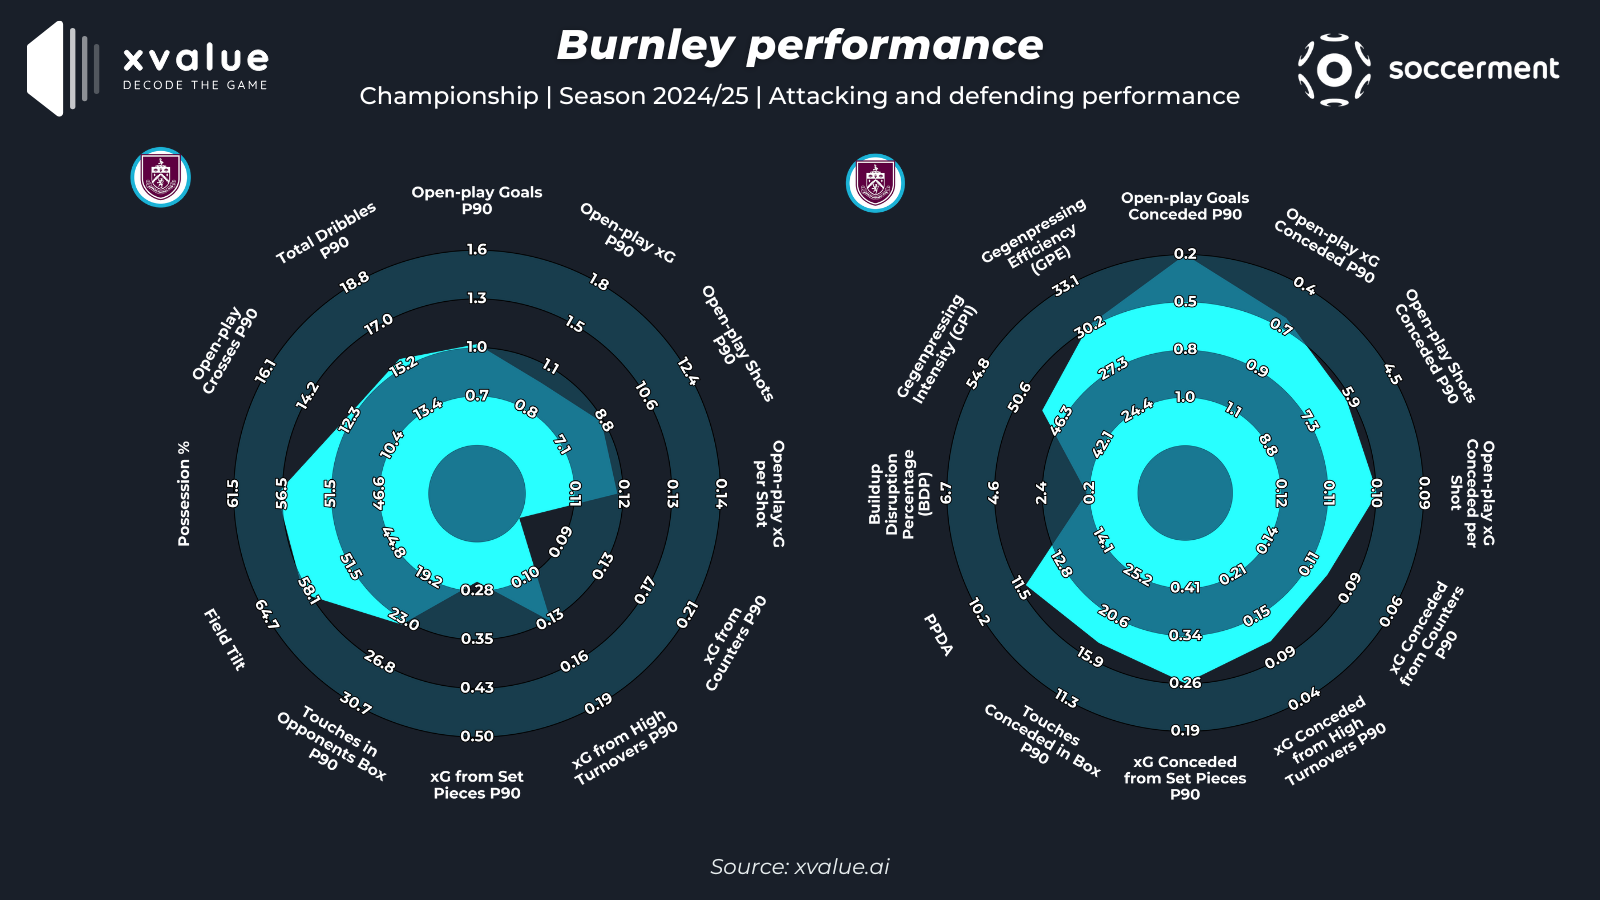
Looking at their offensive metrics in the radar chart on the left, we see they did not excel in any attacking metric.
Indeed, regarding offensive effectiveness and danger from xG and shots, Burnley ranks mid-table for several metrics, including Open play goals per 90 minutes, open play xG per 90 minutes, open play shots per 90 minutes, average xG per open play shot, and xG from high turnovers per 90 minutes. They rank particularly low for xG generated from counter-attacks per 90 minutes and xG generated from set pieces per 90 minutes.
In terms of playing style, Burnley was certainly a team that sought game dominance, ranking in the upper-mid table for Possession % and Field Tilt with values of 56.5% and 58.1% respectively.
They did not register many touches in the opponent’s penalty area per 90 minutes, with a value of 23, also placing them mid-table in this regard.
Regarding the use of wide channels, they are also mid-table for both attempted open play crosses per 90 minutes and total dribbles per 90 minutes.
Now, let’s turn to the analysis of the second radar chart, the defensive one, where Burnley performs significantly better than in the offensive radar. We note that they rank first for open play goals conceded per 90 minutes.
They also show excellent data regarding defensive compactness and risk in terms of xG and shots conceded.
Their pressing style differs from Leeds’, with a PPDA of 11.5, indicating an intermediate pressing intensity. However, they rank among the worst for BDP, suggesting their press was not particularly efficient.
In the counter-pressing phase, they rank 3rd for GPI and 2nd for GPE, but with a significant distance from the top performing teams in this respect.
From these two radar charts, it’s clear Leeds’ underlying performance was better than Burnley’s in all phases of play
Indeed, looking at the league table, it is clear that from an offensive standpoint, Burnley scored significantly fewer goals than Leeds, but at the same time, they conceded half as many. Leeds scored 95 goals, while Burnley scored only 69, conceding only 16, which is half of Leeds’ 30.
Let’s now move on to the analysis of the two teams in the playoff final, who will contest everything on Saturday, May 24th.
3. SHEFFIELD UNITED – OFFENSIVE AND DEFENSIVE PERFORMANCE
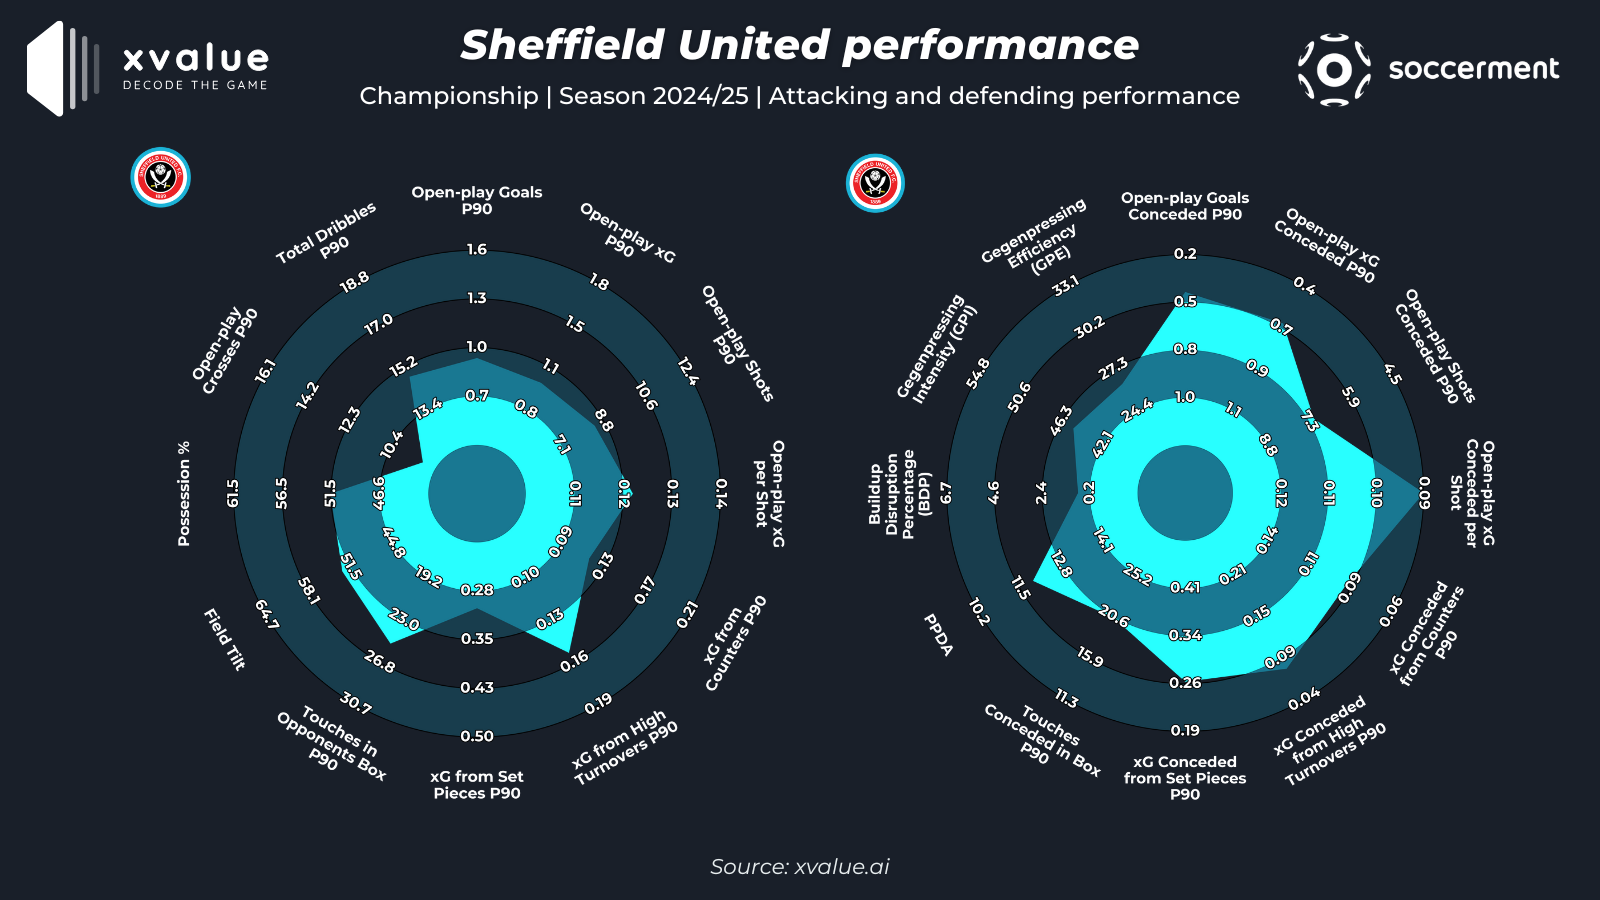
Let’s start with the analysis of the offensive radar on the left.
We can note in terms of offensive threat, they perform well xG generated from high turnovers per 90 minutes. Another positive area of performance is touches made within the opponent’s penalty area per 90 minutes.
Regarding their playing style, they are mid-table for Possession % and Field Tilt, with 51.5% in both metrics.
They are among the last teams for the use of open play crosses per 90 minutes and are also in the lower-mid table for xG generated from set pieces per 90 minutes.
Moving now to the analysis of the defensive radar on the right.
Despite recording a less positive figure for open play shots conceded per 90 minutes, with a value of 7.3, Sheffield is among the best for average xG conceded per open play shot, with a value of 0.09. This means that despite the number of shots conceded, these occur in unfavorable situations or positions for the opponent, thereby limiting and reducing the possibility of conversion into a goal.
They also have excellent values regarding open play goals conceded per 90 minutes and open play xG conceded per 90 minutes. Furthermore, they are in the upper-mid table for xG conceded from high turnovers per 90 minutes.
Regarding their pressing style, we note that they try to maintain a medium-high press, being in the upper-mid table for PPDA, although it does not appear particularly effective, having a BDP just above 0.2.
In the counter-pressing phase, they try to maintain a measured attitude, being mid-table for both GPI and GPE.
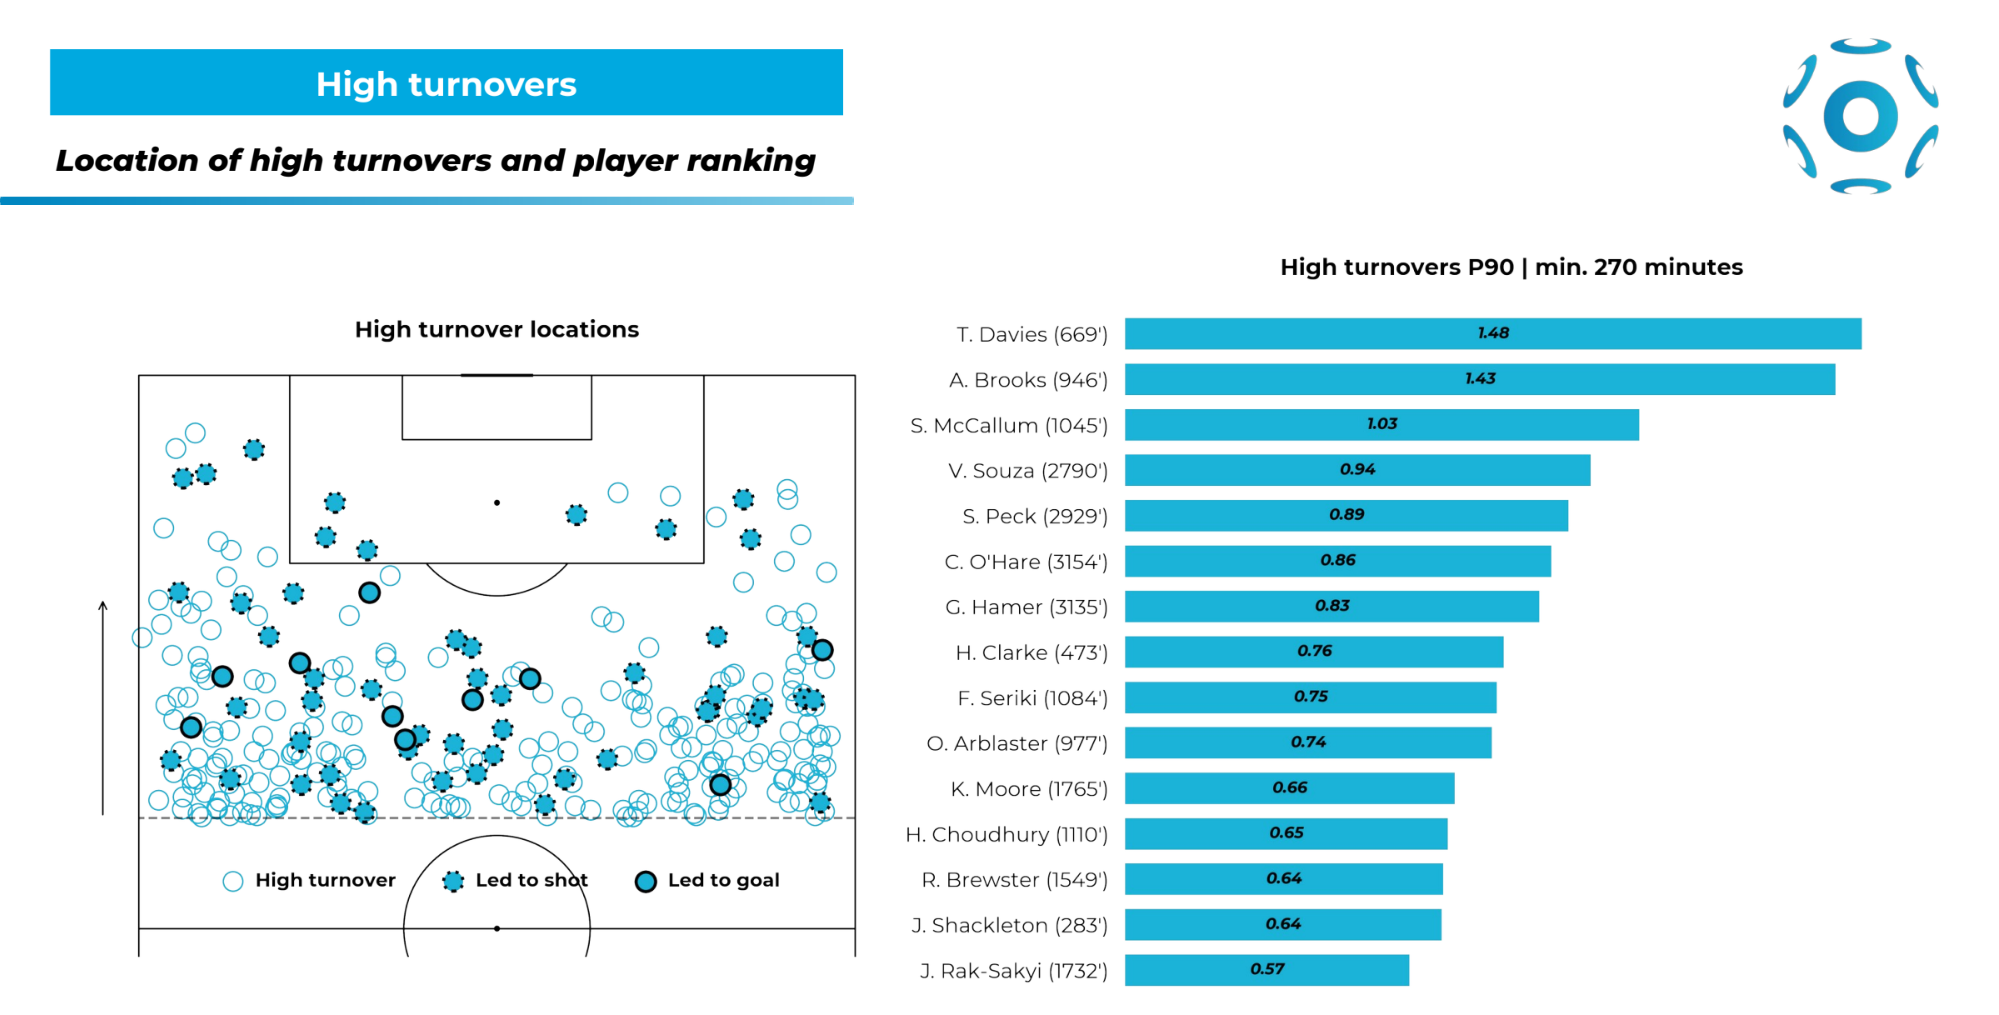
As we saw from the radar, one of Sheffield’s strengths in attack is high turnovers. Let’s now analyse the positions and main players in detail.
From the image below, on the left, we can see the map with all high turnovers executed. The empty circles represent a high turnover action, the circles with a dashed outline represent an action that led to a shot, while the circles with a continuous outline represent goals.
On the right, there are the players who execute the most high turnovers per 90 minutes. We immediately notice from the map that Sheffield performs the majority of their high turnovers in the left-central area, with most of the goals scored also coming from this zone; 7 out of 10 goals originated here.
The players who are most active in this phase are Davies and Brooks, followed by McCallum. Davies and Brooks execute 1.48 and 1.43 high turnover actions per 90 minutes respectively.
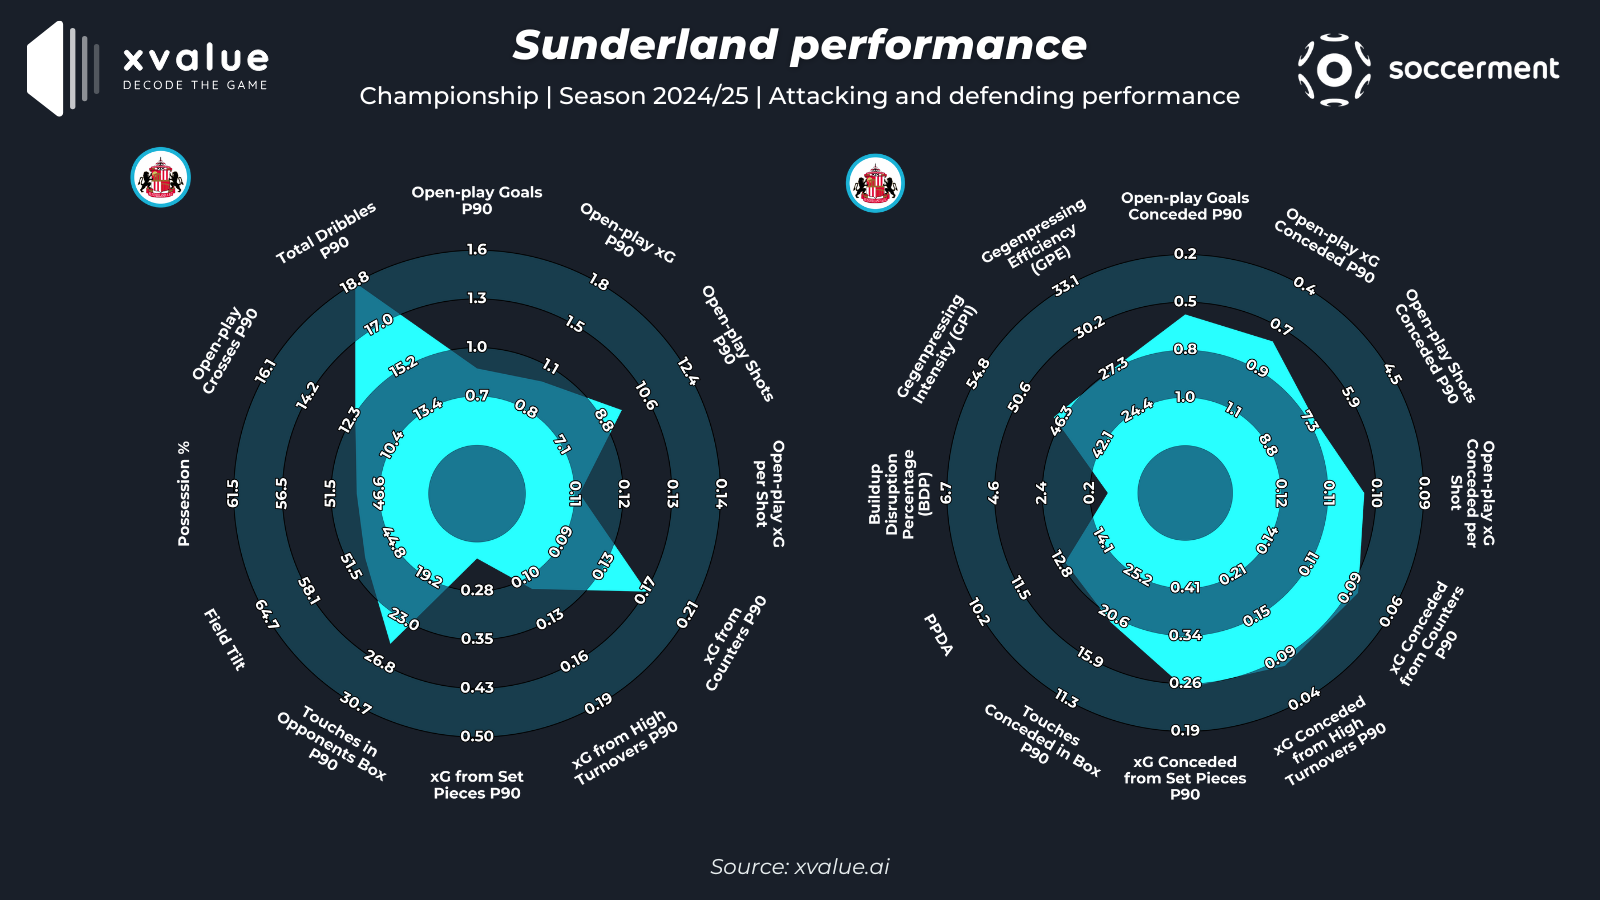
4. SUNDERLAND – OFFENSIVE AND DEFENSIVE PERFORMANCE
Starting, as always, with the analysis of the offensive radar on the left, we immediately notice that Sunderland ranks first for total dribbles per 90 minutes.
From the perspective of offensive threat and effectiveness, they are in the mid-to-upper ranks for open play shots per 90 minutes and xG generated from counter-attacks per 90 minutes.
Conversely, they are in the lower ranks for xG generated from set pieces per 90 minutes and average xG per open play shot.
From a possession standpoint, they are in the lower half of the table for both Possession % and Field Tilt.
Analysing the defensive stats on the right of the figure, we notice that they are more effective in this phase compared to their offensive one.
They are in the mid-to-upper ranks for xG conceded from set pieces, high turnovers, and counter-attacks per 90 minutes.
They also have excellent data regarding open play xG conceded per 90 minutes and average xG per open play shot conceded.
From a defensive style perspective, they are mid-table for PPDA with a value of 12.8. However, their press is not particularly effective, as they are in the lower ranks for BDP.
In the counter-pressing phase, they maintain a conservative attitude, ranking mid-table for both GPI and GPE.
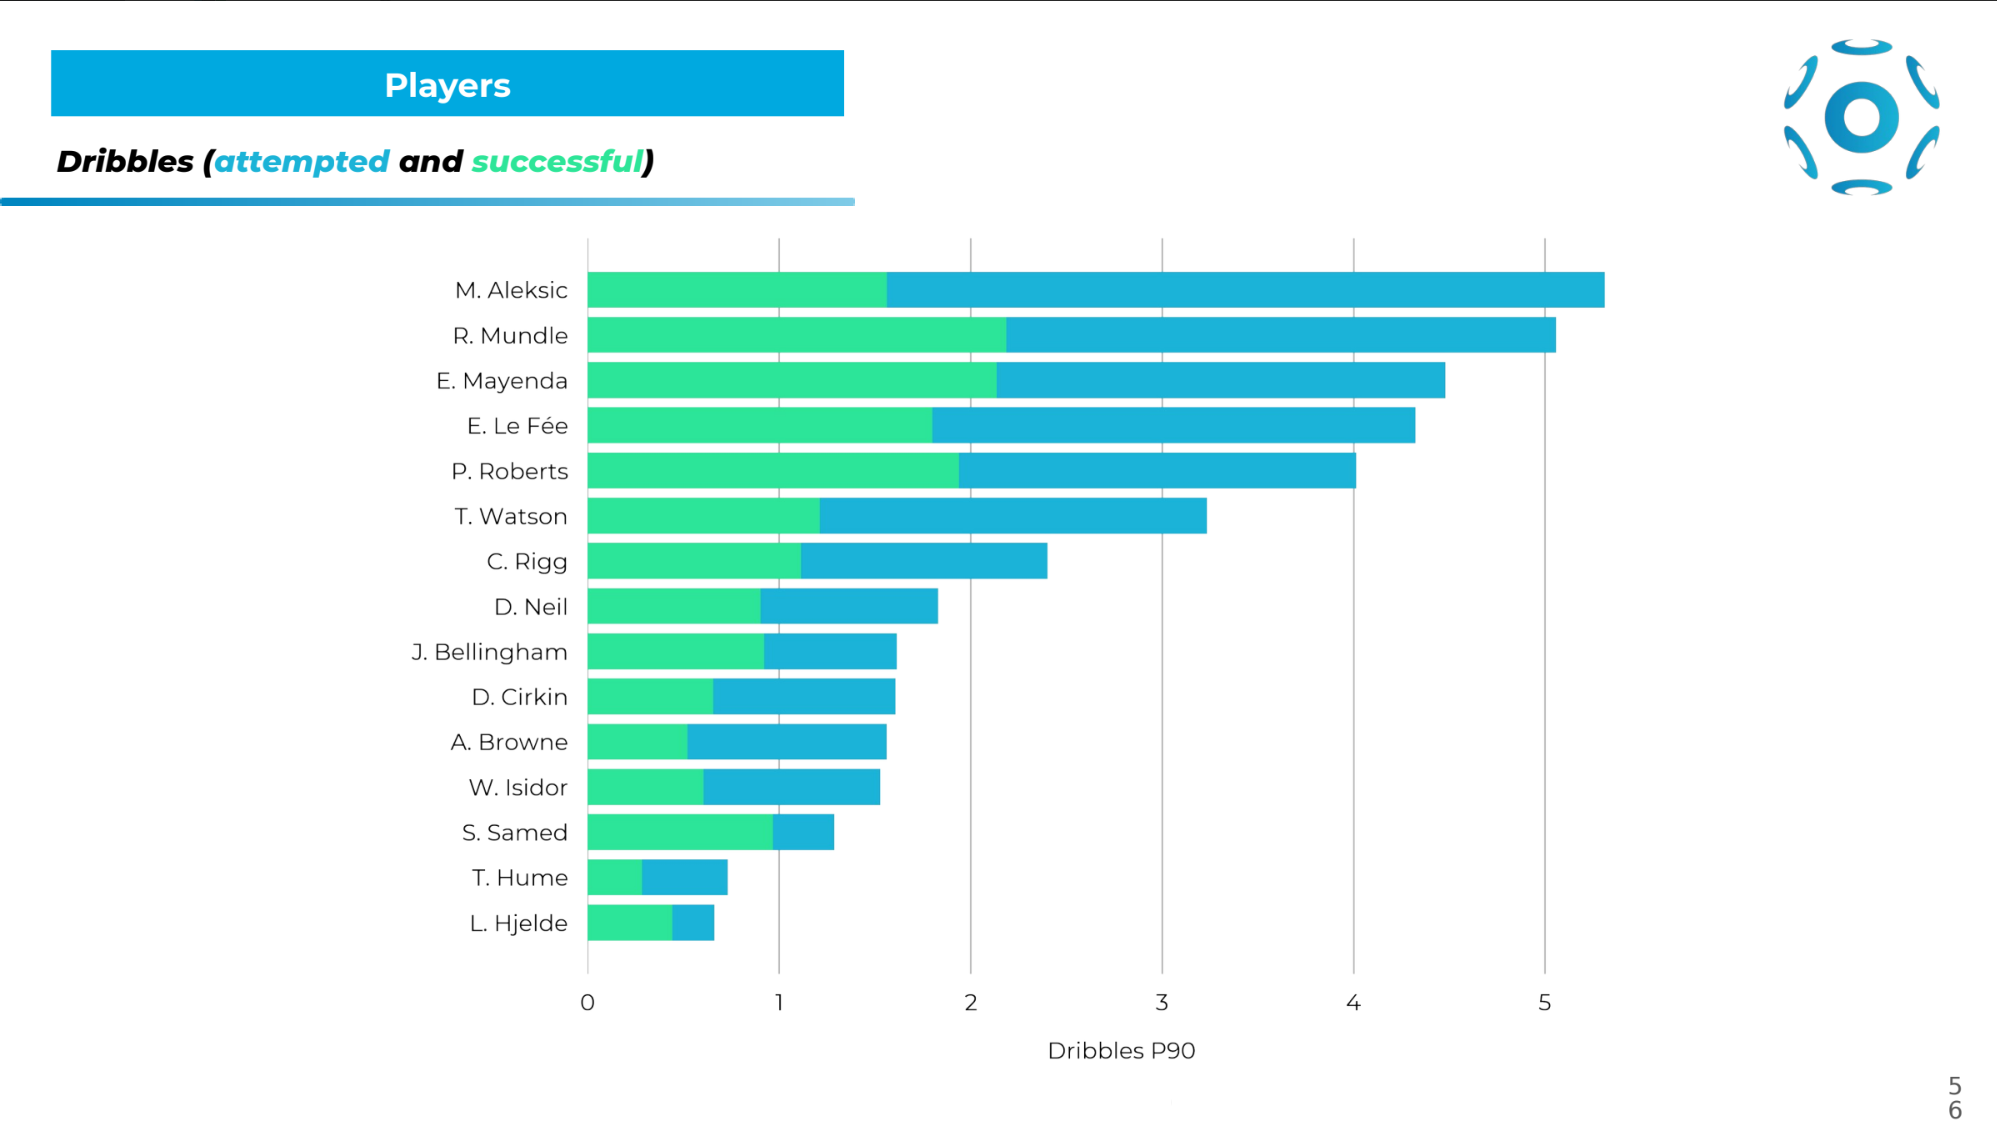
Given they are first for total dribbles per 90 minutes, let’s delve deeper to see which Sunderland players are most involved in this phase, also to gain insight into Saturday’s match. We notice that the top three players for attempted dribbles are Aleksic, Mundle, and Mayeda.
The top three players with the highest number of successful dribbles per 90 minutes are Mundle, Mayeda, and Roberts. Roberts, in particular, ranks fifth for attempted dribbles. Aleksic, the player who attempts the most dribbles per 90 minutes, ranks fifth for successful dribbles per 90 minutes.
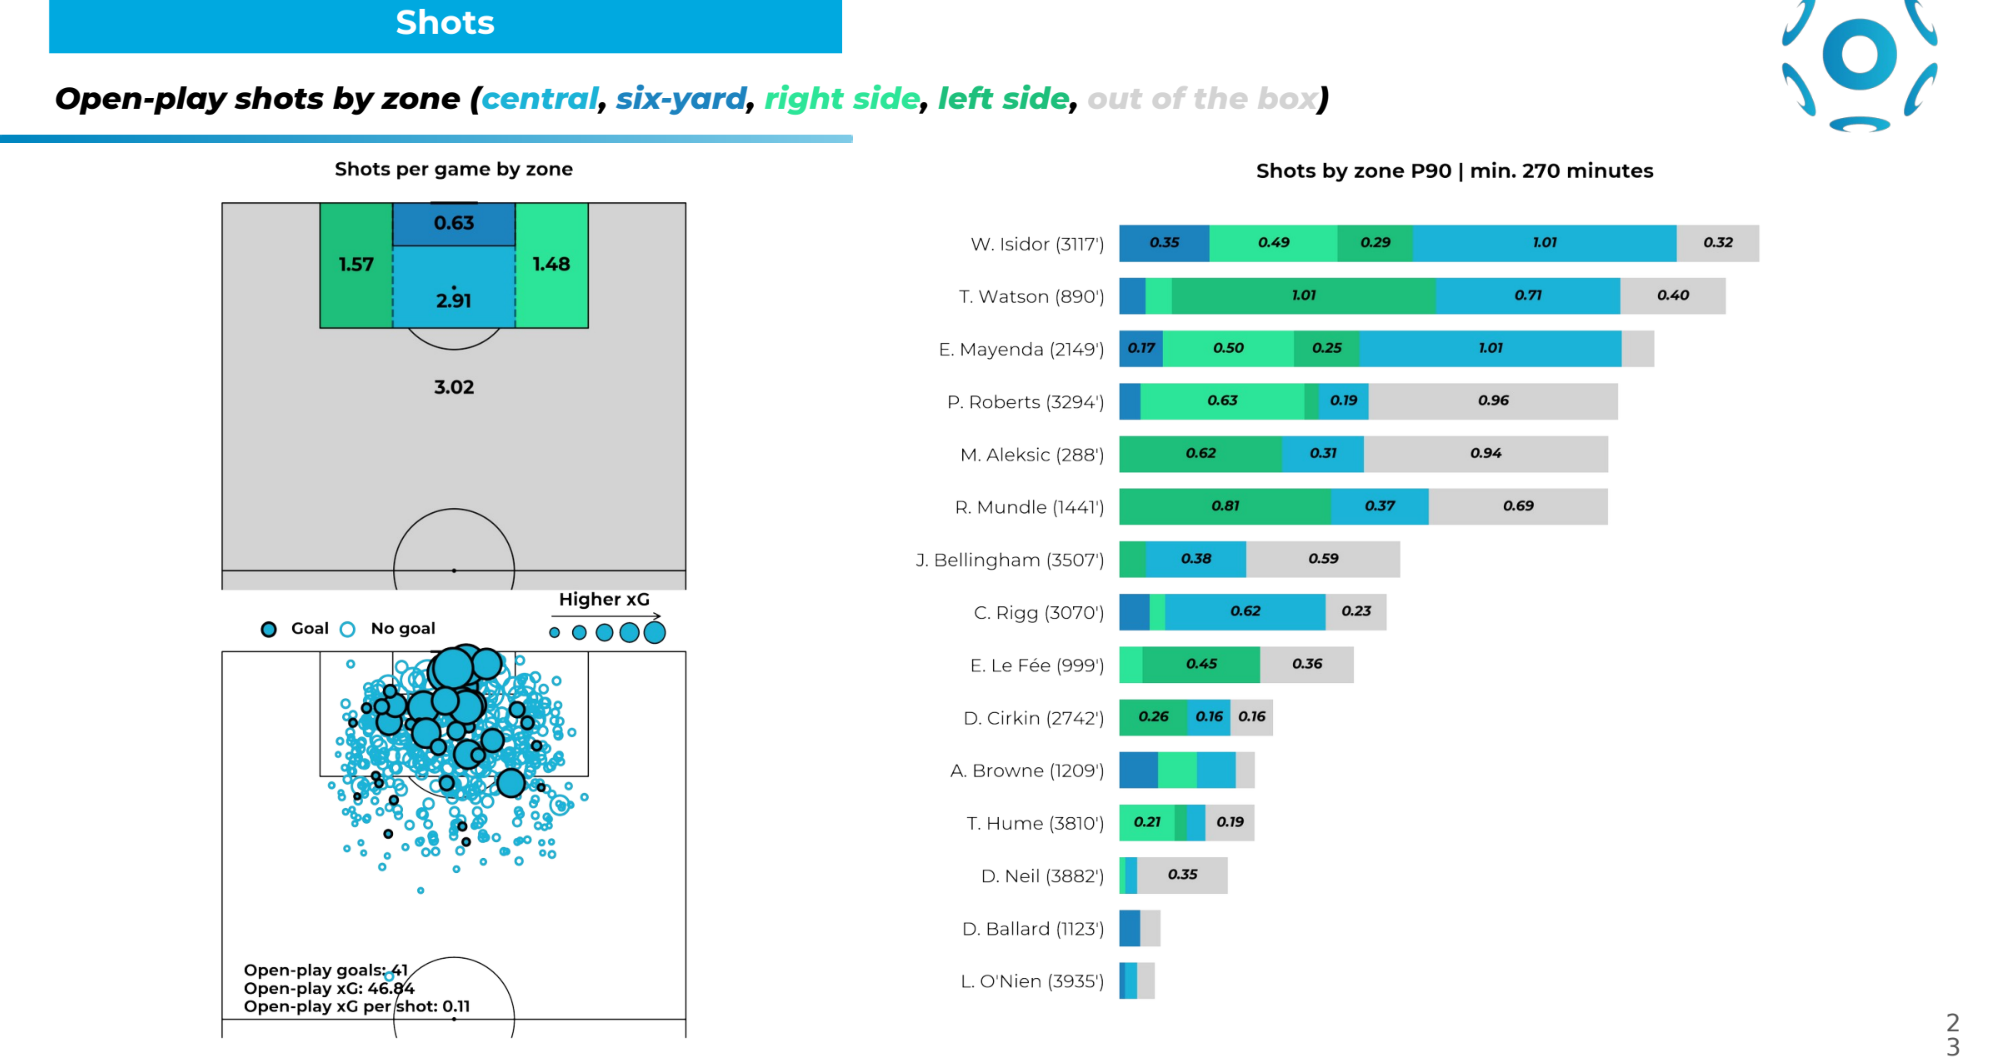
The quantity of open play shots per 90 minutes also stands out in the offensive radar. Let’s therefore examine in detail the positions from which Sunderland primarily seeks to shoot and who the main exponents are. Sunderland primarily attempts shots from outside the box, with 3.02 shots per game. Out of 41 open play goals scored, 10 came from outside the box, indicating a good conversion rate.
The players who most frequently attempt shots from outside the box are Roberts, with 0.96 shots from outside per game, Aleksic, with 0.94 shots from outside per game, and Mundle, with 0.69 shots from outside per game. In the centre of the box, they attempt to finish 2.91 times per game, and the main players are Isidor and Mayeda, with 1.01 shots from the centre of the box per game, followed by Watson with 0.71 shots from the centre of the box per game.
In the wide areas of the box, finishing is sought less frequently. From the left, they conclude 1.57 times per game, with Watson and Mundle as the main exponents, while from the right, they conclude 1.48 times per game, with Roberts and Mayenda.
Conclusion
We trust this in-depth analysis has provided you with a clear and data-driven perspective on the teams at the heart of this exciting race to the Premier League. Leeds United and Burnley have convincingly proven their worth, but now attention shifts to the final chapter. Who, in your opinion, will secure the last valuable ticket to the Premier League between Sunderland and Sheffield United? And what are your expectations for Leeds and Burnley in the upcoming season? Share your thoughts and predictions!
Thanks!
Learn more about xvalue, the go-to analytics platform for scouting and match analysis 👉🏻 xvalue.ai
Stay tuned and don’t miss out on the latest updates and insights from Soccerment!
Leave a Reply