

This is part one of a trilogy of posts dedicated to the role of ball possession in football. In this post, we look at how ball possession is calculated and how the focus on ball possession is often (not always) a synonym of success. We also start digging into the bidirectional causation problem: do the teams play better as they focus on ball possession, or better teams have higher quality, which naturally leads them to complete more passes?
An intro to ball possession in football
In the recent years, the debate around ball possession in football has greatly increased. It kick-started with the Spanish “tiki-taka“, which became “viral” thanks to the serial victories of Guardiola’s Barcelona and of the national Spanish team.
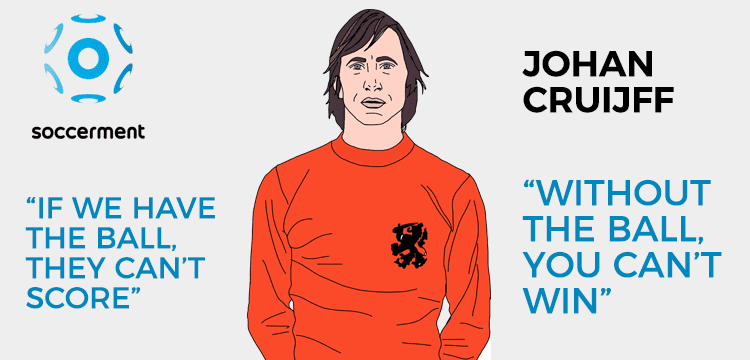
The perception of the importance of ball possession is not so recent though. One of the main popularizers was undoubtedly the Dutch legend Johan Cruijff, to whom we dedicate the cover image of this post. Cruijff’s Ajax, Holland and Barcelona have revolutionised football in many ways, ball possession included. Johan Cruijff used to say “Without the ball, you can’t win. If we have the ball, they can’t score“.
We decided to investigate ball possession in European football, to assess if there were any correlation with other statistics and, ultimately, with team success.
This is the first of a series of posts (three in total) and should serve as an introduction to the theme. In the second post, we deep dive into the numerical analysis of ball possession in the five European major leagues and share some interesting findings on teams and players. In the third post we will show, with the help of video analysis, how the most successful European teams organise their build-up phases, to produce efficient attacking strategies.
Ball possession: what it is and how is it calculated
In the first decade of 2000’s, the possession percentage was considered as the main metric to judge the quality of a team: the higher the ball possession percentage, the better the team. As time went by, some new metrics were introduced in football analytics and possession percentage progressively lost its appeal, to such an extent that we are almost not bothered to track it anymore. However, we believe that to understand a team philosophy or style of play, ball possession and how it is accomplished is of great help, for a complete assessment.
Before delving into numbers and tactics, it is important to precisely state what ball possession is and how data companies are extrapolating the percentage numbers we see broadcast on our television. There are many data providers across the world and the way they collect the data has evolved a lot, since its introduction.
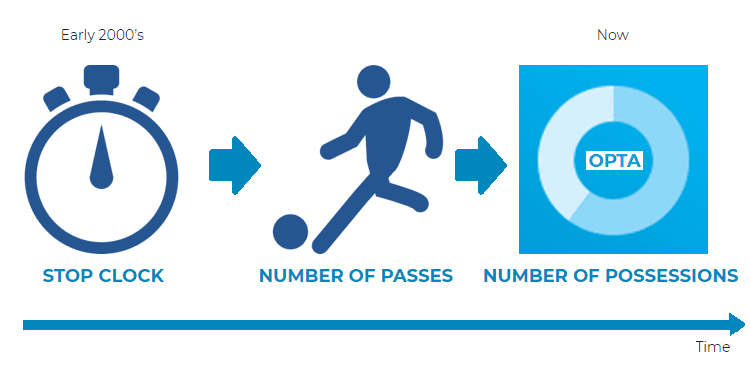
At the beginning of the Enlightenment era of football data (early 2000’s), companies used to employ people hitting a stop clock every time the ball changed possession. The problem with this method was to rely on the person logging the data remembering to hit the button at the right time (the person doing it, usually had also to accomplish other tasks). Moreover, it would have been almost impossible to apply the stop clock process effectively across all the matches that the data providers cover every year.
This method was then replaced by a different approach, based on the number of passes that a team completes in a game. At the end of the match, each team passes were summed up and then divided by the total, to produce a final percentage figure (passes account for more than 80% of the total events in a football match). However, by calculating only passes, this method did not account for the time spent on the ball, also overstating the percentages related to those teams producing high amounts of short passes in the build-up phase (like Manchester City and Napoli nowadays).
More recently, Opta, one of the leading data providers, decided to create a new metric called ‘a possession’, defined as follows: “a possession starts upon a player controlling the ball and ends when they no longer do“. At the final whistle, the total possessions for each team are added up and divided by the total number of possessions.
So, the next time you see a final possession figure, you know how to read it, but keep in mind that this kind of metric does not take in consideration when the ball is out of play. And sometimes, being able to have possession when the ball is not in play (think about the time wasted to make throw-ins, corner kicks and goal kicks), can make the difference between defeat or victory.
As reported in the book “The Numbers Game“, in the English Premier League Opta recorded that a team gains possession 100 times on average in a typical league match, for a total of 200 possessions, using a narrow definition (possession: two consecutive passes or a shot). Ten out of 100 possessions lead to a shot on goal and only 1.3 in 100 possessions yield to a goal.
Using a wider definition (one possession: every time a team gets the ball), a team gains possession around 200 times, with only 0.74 out of 100 possessions leading to a goal.
Is ball possession effective?
Now that we made it clear how possession is calculated, we move to the core question: Does a higher ball possession create a competitive advantage?
We have collected the data of all the matches played so far this season (as of 8 January 2018) in the top five European leagues. As we analysed this huge amount of data, we came to the conclusion that ball possession does matter.
The data show that there exists what we call the POSSESSION-TO-GOAL CHAIN: a correlation between the average number of passes that a team is able to accomplish every match and the average number of goals that a team is able to score.
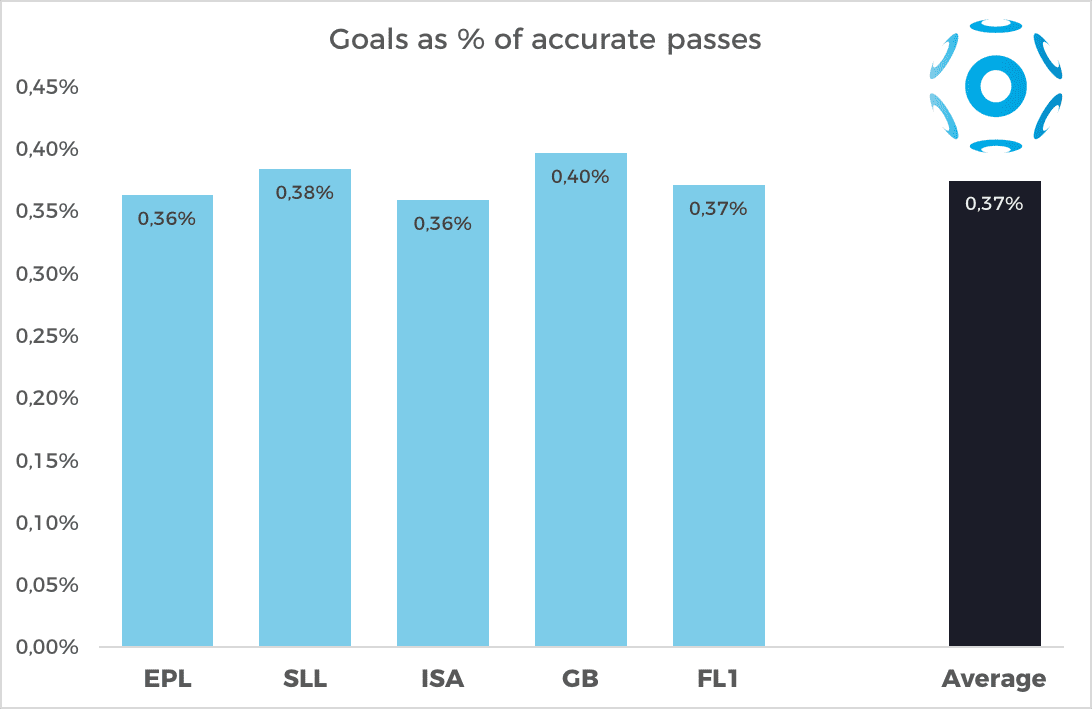
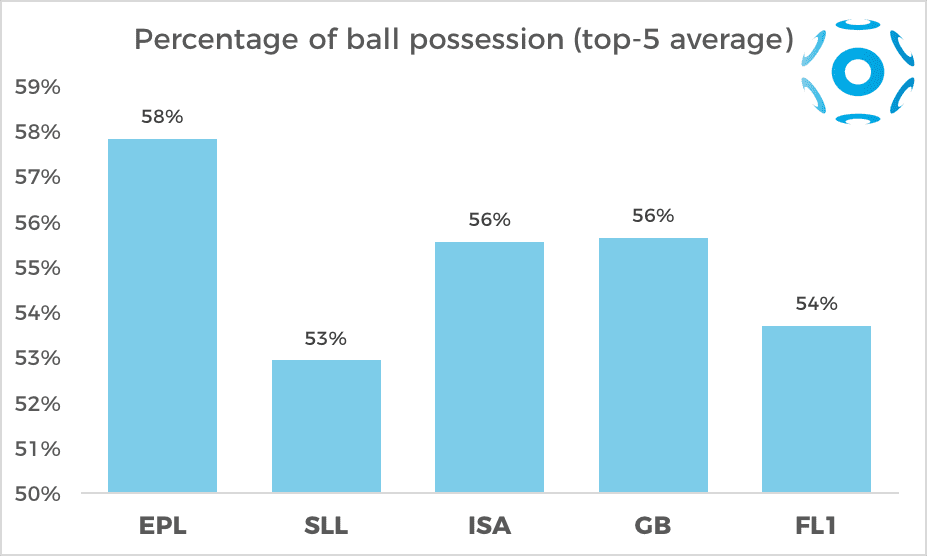
For instance, in every European major football league the number of average goals that a team scores in one match tends to be a certain percentage of the average number of accurate passes that team produces (c.0.4%). In any major tournament in Europe, whether you are thinking of the English Premier League (‘EPL‘) of the Italian Serie A (‘ISA‘), the ratio of the average number of goals a team scores and the number of accurate passes that team produces will be around 0.4%, as shown in the chart below [SLL = Spanish La Liga, GB = German Bundesliga, FL1: French Ligue 1]. Interesting, right?
Furthermore, the data show that the amount of the passes is correlated with pass accuracy and that the latter is correlated to the length of the passes themselves (the shorter the more accurate).
The data thus show a high correlation between the number of short passes (<25 yards, i.e. 23 meters) and the number of goals.
The Possession-To-Goal chain
But let the numbers speak. As aforementioned, we took all the matches played in the five major leagues up until 8th January 2018, around 1,000 matches.
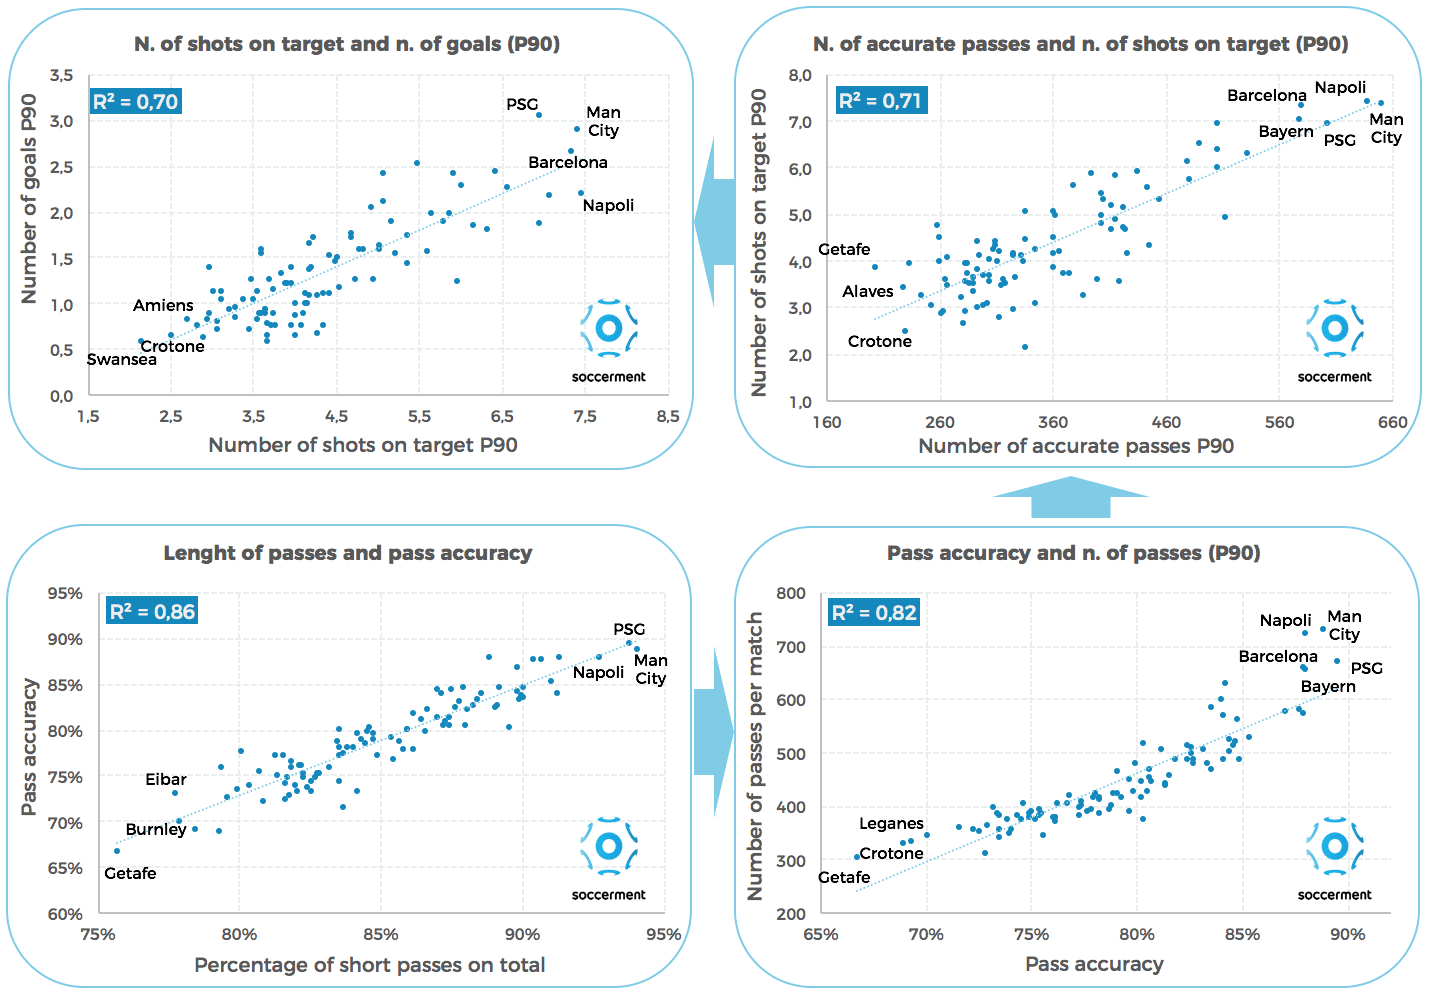
We start from the very end of the chain, from goals. And we start from a very intuitive correlation. The number of goals a team scores clearly depends on the number of shots they take, more specifically the number of accurate shots, i.e. the shots on target. R-squared is a good 0.70.
Man City, which in our panel is among the teams scoring the most (2.9 per game) is also among the ones shooting on target the most (7.4 per match). Viceversa, low-scoring teams, such as Swansea, Crotone and Amiens, take less than 3 shots on target per match.

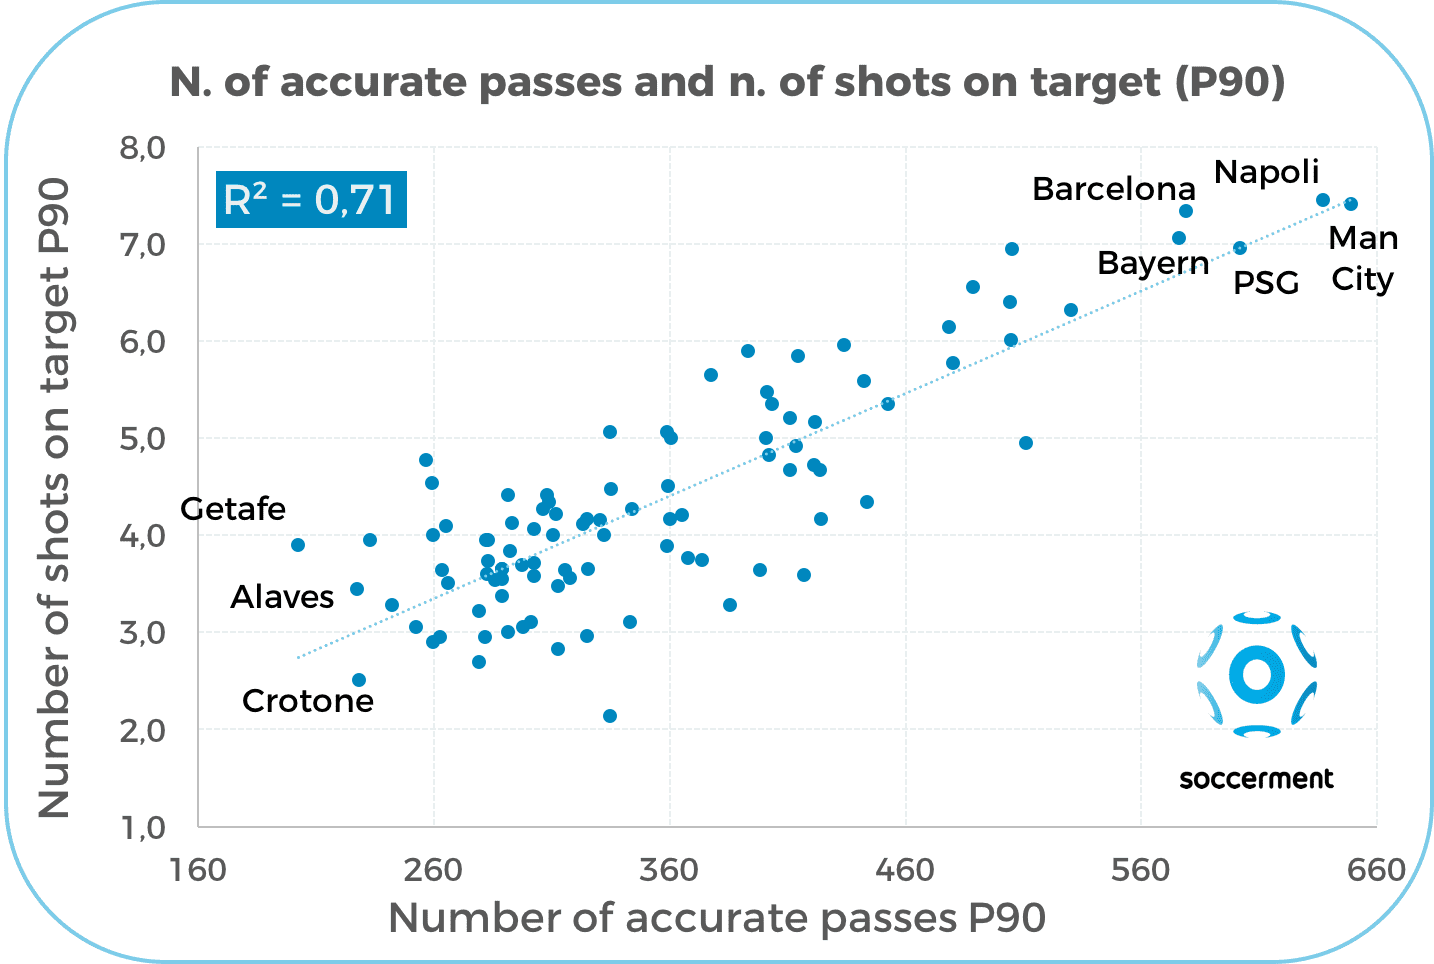
What leads to a shot? Normally a shot is the final act of a quick or an articulated build-up, or a set piece. The build-up is a series of passes. If a team never conceded the ball back to their opponents, with a pass accuracy of 100%, the result would certainly be a shot (if the team was not just playing piggy-in-the-middle, of course!). We can deduce that when a team is able to produce many accurate passes, its chances to take shots on goal would increase. Even more so, more accurate passes would likely take that team to shoot from more favourable positions and take more shots on target. This is confirmed by the correlation (R-squared of 0.71) between the number of accurate passes and the number of shots on target.
In our sample, Man City is the team achieving the highest number of accurate passes per match (649) and is among the leaders in terms of shots on target, as previously shown. On the opposite side, Getafe is the team showing the lowest average of accurate passes, whilst they “outperform” the regression line by achieving almost 4 shots on target per match (anyway -11% vs average).
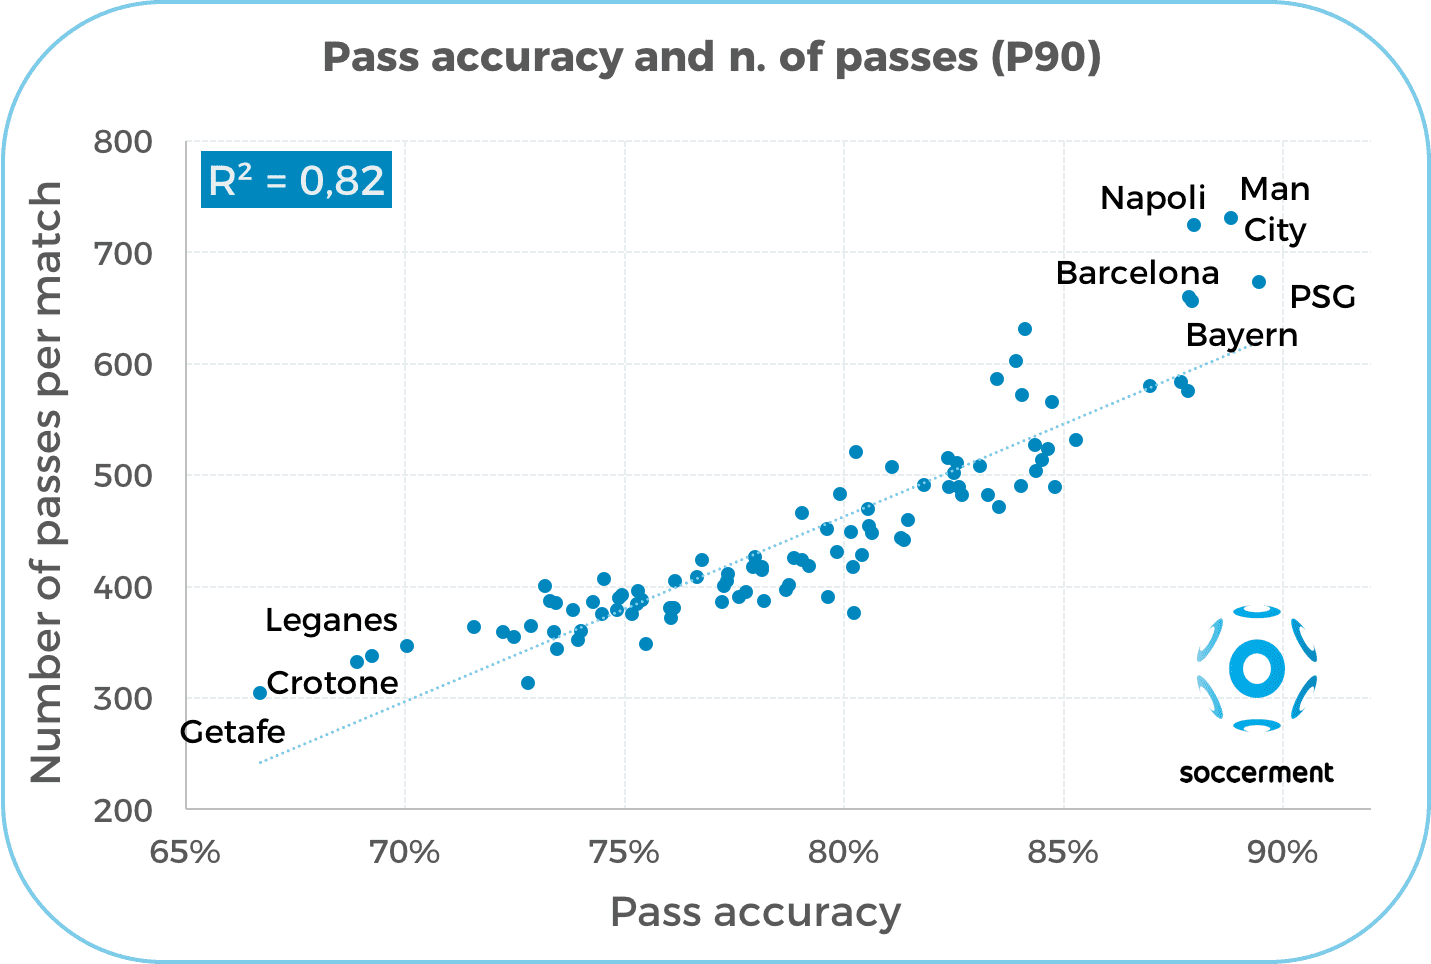
In the book “The Numbers Game”, the authors Chris Anderson and David Sally show the correlation between pass accuracy and the number of passes. We reproduce it here. We take total passes instead of accurate passes (vs the previous correlation), as we try to test the correlation between pass accuracy with the numerosity of the total events, regardless of their success. The regression has a high R-squared of 0.82. According to Anderson and Sally, “passing skills and volume usually move in tandem. Teams that pass more often usually complete a greater proportion of them“.
PSG shows the highest pass accuracy (89.5%) and are able to achieve 673 passes per match, on average.
Finally, we ask ourselves what determines pass accuracy. Is it maybe due to the players’ technical abilities? Only partially, in our view. Clearly having the likes of Toni Kroos or Andrés Iniesta does help, but our findings suggest it has more to do with how the players interact with each other. In fact, pass accuracy improves when the percentage of short passes (<25 yards) on total passes increases (R-squared of 0.86).
This makes sense to us. If a team prefers short passes over long ones, it probably means that the players on the pitch are well positioned to form triangles, offering nearby solutions to the teammate with the ball. That team will complete more passes and, staying closer together, will also offer fewer counterattack solutions to the opponents, when the ball is lost.
We quote Cruijff’s autobiography ‘My Turn‘, taking a valuable statement: “100% concentration is vital if you’re going to play positional football, with new triangles forming every time and the player with the ball always having two possible passes (…) It isn’t the man on the ball who decides where the ball goes, but the players without the ball. Their running actions determine the next pass“.
In our database, while Man City, PSG and Napoli play short passes, Getafe, Burnley and Eibar show a relative preference for long balls.

Interesting to see that, out of the three teams playing short passes the least, two are from Spain, the country of “tiki-taka”. It is also quite interesting to notice how Spain looks below-par when it comes to the average ball possession average of the top five teams in the respective leagues: in the Spanish La Liga (‘SLL’), the first five teams display an average ball possession of 53%, vs 58% in the English Premier League (‘EPL’) and 56% in Italy and Germany (ISA and GB, respectively).
Bottom line, over a season, the number of goals that a team scores seems to be linked with the team’s propensity to complete short passes.
Our findings suggest that possession football is a good strategy for success. Successful teams that are able to keep the ball away from their opponents do have more shots and do score more goals, while defensively they concede fewer shots and consequently fewer goals.
A summary of the possession-to-goal chain:
The bidirectional causation problem and the way to kickstart a virtuous spiral
Do the teams play better as they focus on ball possession? Or, more simply, better teams have higher quality, which naturally leads them to complete more passes?
In our opinion, there might be the a “virtuous spiral” effect, involving a club’s culture, stature, tactical approach and results. We believe that focusing the training on ball possession increases, over time, the team’s quality, which leads to better results in the long run. The better results increase the ability to attract talents and the virtuous spiral is in place. We believe this is valid at any level, even within non-professional football.
How could the virtuous spiral kickstart? We believe that training on ball possession from the very start, i.e. from the youth teams, helps at creating the virtuous spiral we refer to. The more you play with the football (and without it, better positioning yourself to receive it), the better a footballer you will be. That is true both on an absolute and on a relative basis: your competitive edge vs other teams or vs other players will depend on the time you spend possessing the ball compared to your peers.
Credit: the data used for this post were sourced from WhoScored.com.
For any suggestion, comment or query, do not hesitate to contact us via email: research@soccerment.com.