

The football market is still characterised by high levels of inefficiency, offering plenty of opportunities for arbitrage (trading the same asset in different markets to take advantage of differences in price). In this context, data analytics can offer market actors a significant competitive edge. Using our proprietary performance indicators, plus player salaries, to build an “undervaluation model” we have been able to uncover fourteen “hidden gems” among players aged 25-30.

Plenty of hidden gems out there
The football market is deeply inefficient
The transfer market in elite football is remarkably inefficient, which offers ample room for arbitrage when recruiting football players. While this concept is normally used when analysing transfer values, it can also be applied to players’ salaries.
While disparity between different players’ salaries is regularly huge, the difference in terms of performance output is often somewhat limited. There are players earning a few tens of thousands of euros that perform more or less in line with players enjoying salaries that are orders of magnitude higher.
The main reason for this, in our view, is that data analytics is not yet widespread enough, which reduces clubs’ analytical capacities and ability to link player performances to salary.
In this analysis we refer only to base compensation, and therefore do not consider bonuses or other performance-linked compensation. On this subject, we strongly believe that football federations should encourage clubs and players to greatly increase the share of the variable component in the players’ and coaches’ remuneration, and that the variable compensation shouldn’t only take into account the results obtained by a team (or by a player) on the pitch, but should be somewhat linked to the club’s revenue streams too. The pandemic has taught us that football clubs struggle to absorb revenue shocks, mainly as so many of their costs are fixed.
Inefficiencies are structural
At the very beginning of their careers, there is of course very little data and information regarding footballers, which offers many arbitrage opportunities to clubs when recruiting youngsters and looking for wonderkids.
In a similar, although less marked, vein, we find the market to be highly inefficient when valuing more mature players. After reaching their physical peaks, footballers’ performances and hence their ability to land good contracts are often affected by injuries, which makes their career trajectories uncertain.
To fully understand the market's inefficiency and assess whether or not this is structural, we focus our attention on the age group where inefficiency is theoretically the lowest: players in their prime, between 25 and 30 years of age, for whom there is plenty of information available about their technical, tactical and personality traits and the volatility of their performances is the lowest.
Below, you will see all the details of our analysis, but we can start with a spoiler: there is plenty of inefficiency within the selected age group, which leads us to believe that it stems from structural problems.
Data analytics provides a competitive edge
The market inefficiency that we describe above means there are a great deal of opportunities for arbitrage, which offer a real competitive edge to those clubs ready to capitalise on them.
In our view, there are a few ways to capitalise on arbitrage opportunities occasionally, but only one way to do so consistently: data analytics.
The reason is rather simple: market participants with more and better information, as well as the tools to extract actionable intelligence from it, are better able to exploit their superior knowledge. The easiest way to get hold of such objective information is through data and analytics tools, which enable the extraction of valuable information to take decisions.
Bottom line, those football clubs that use data analytics in their decision-making processes can exploit market inefficiencies and find many arbitrage opportunities, thus outsmarting their opponents and obtaining a competitive edge.
We hope that the number of these arbitrage opportunities will decrease in the future, as the use of data analytics becomes more mainstream in football. This would also increase meritocracy within the game.
If you would like to know how data analytics is transforming football, you can download our handbook.
How to look for hidden gems
We call "hidden gems", or undervalued players, those footballers whose performance is not fully reflected by their salary, as compared to the other players in our database. For example, a player earning 50 and performing 100 could be considered undervalued compared to a player earning 50 and performing 75, but also as compared to a player earning less (25) and performing at a much lower level (25).
We look for undervalued players by comparing their performance - i.e. their seasonal contribution to their teams' playing phases (defence - buildup - attack) - to their salary.
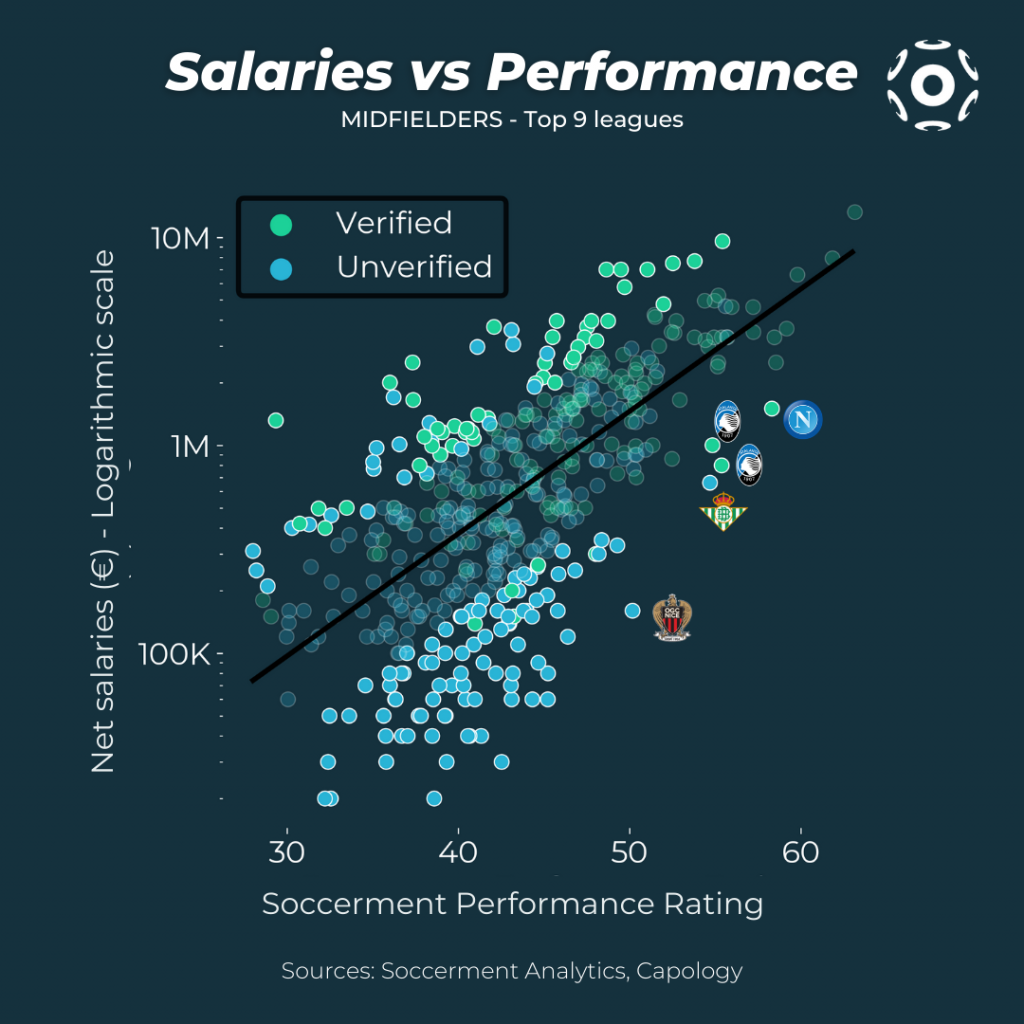
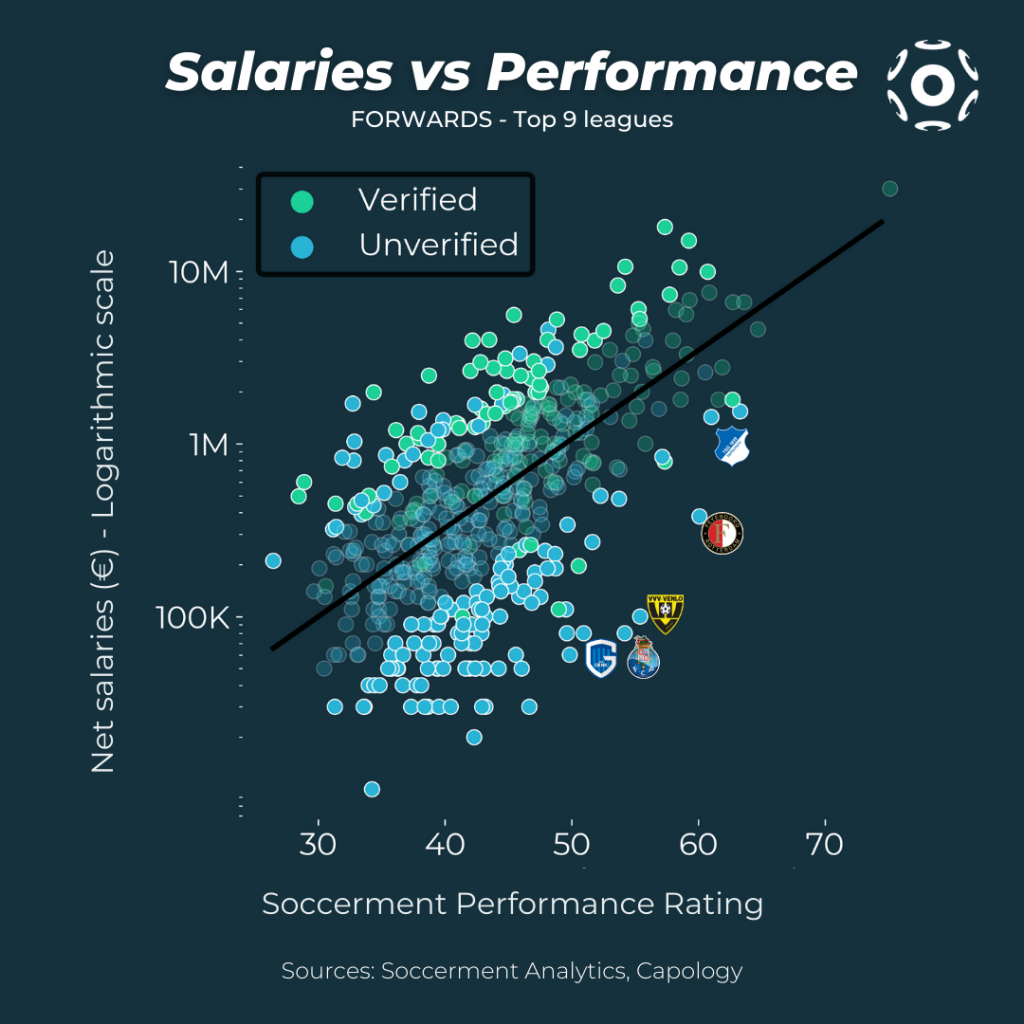
The correlation between the performance of footballers and their salaries is shown in the scatter chart below.
On the x-axis we plot players' Soccerment Performance Rating (SPR), the algorithm we use to evaluate players' performance over the course of a season. We note that the SPR is adjusted for the level of the league, which increases the homogeneity and comparability of the dataset.
On the y-axis we put net salaries in Euros, using the logarithmic scale, because of the huge variation in salaries in the dataset. For the data related to the net salaries we rely on Capology's database, which includes salaries that are verified (by the agent, club or at least two independent sources), and others that are estimated using algorithms that take into account a broad set of attributes.
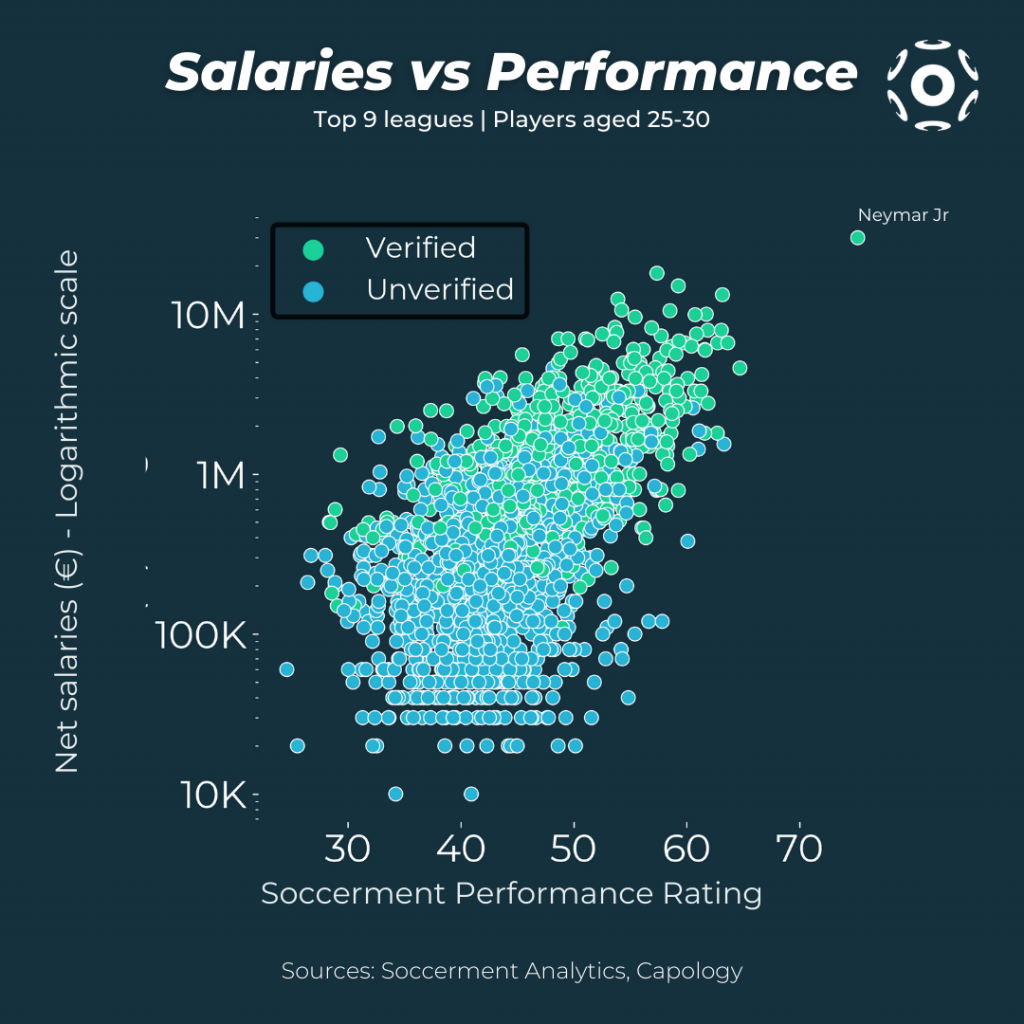
What we are looking for is players positioned as far as possible towards the bottom right of the chart above: high performance levels and a low net salary.
In the chart above we have highlighted only one name, Neymar Junior, and only as a reference point. Neymar has the highest Soccerment Performance Rating for players between 25 and 30 years of age, as well as the highest net salary, which according to Capology stands at €20m per year.
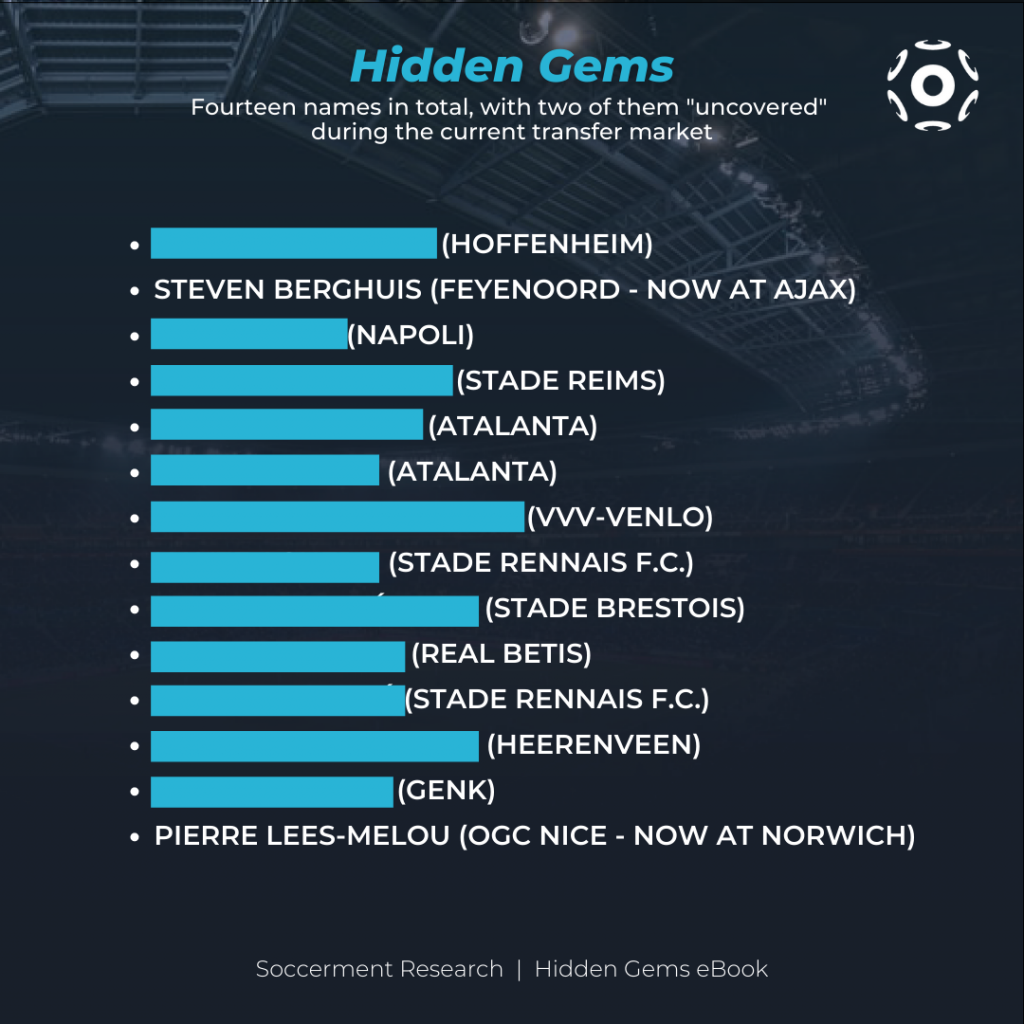
We use our model and cherry-pick fourteen 'hidden gems' by selecting the top undervalued players in each role (goalkeeper, defender, midfielder, forward). Below is the link to uncover these 'hidden gems'.
Soccerment Analytics now is enriched with Capology's dataset onsalaries
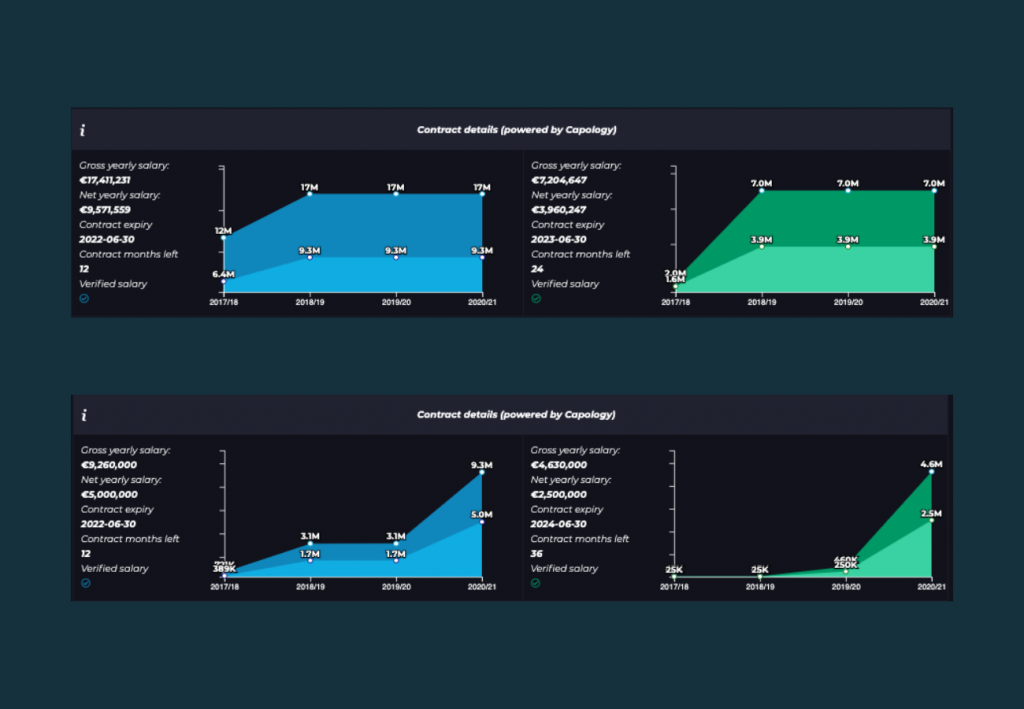
We note that users of our analytics platform (those subscribed to our 'Analyst Plus' plan) now have full access to Capology's data, which includes players' gross and net salary and the length of their contracts.
We include the information about salaries, as provided by our partner Capology, within the players' "advanced stats". In the figure below we show the information for four players, as it appears on our analytics platform (at the top, two midfielders of Man Utd, at the bottom two wingers of Juventus).
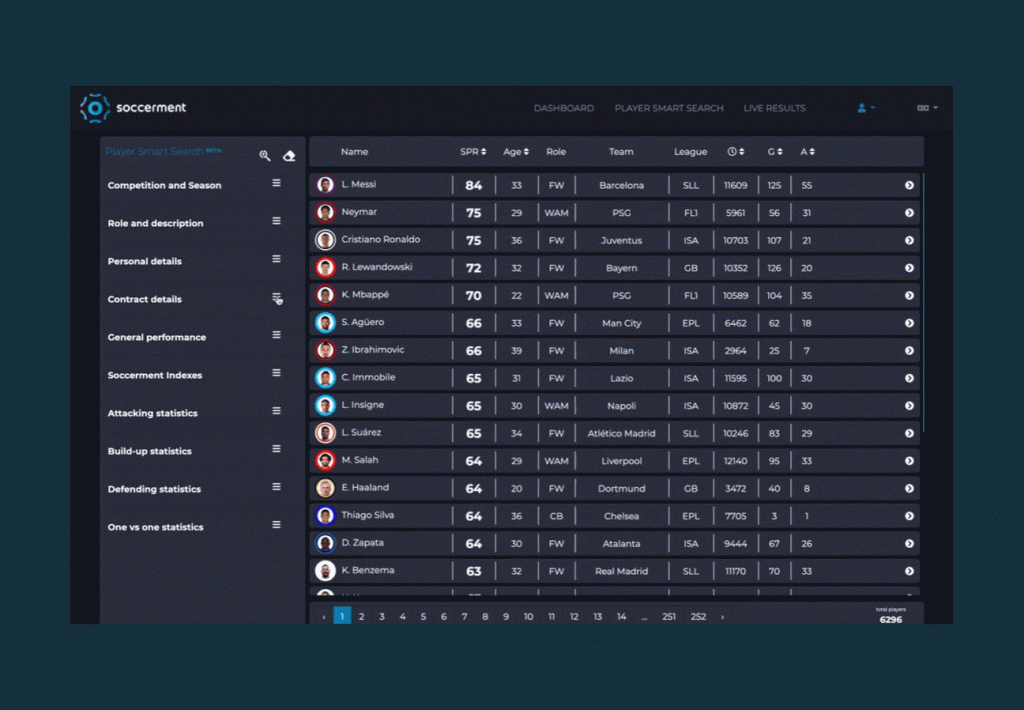
Furthermore, in our Player Smart Search the user can now filter for salary level, as shown below.
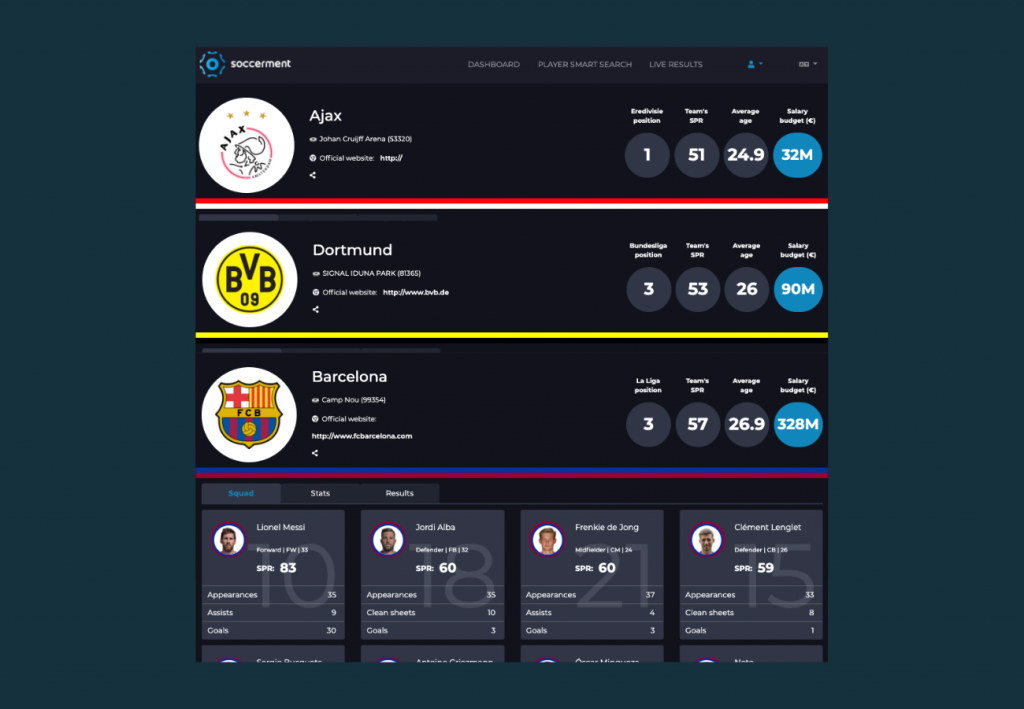
Finally, our Analyst Plus subscribers can access the team's salary budgets, as displayed below. The differences can really be substantial.
Our methodology
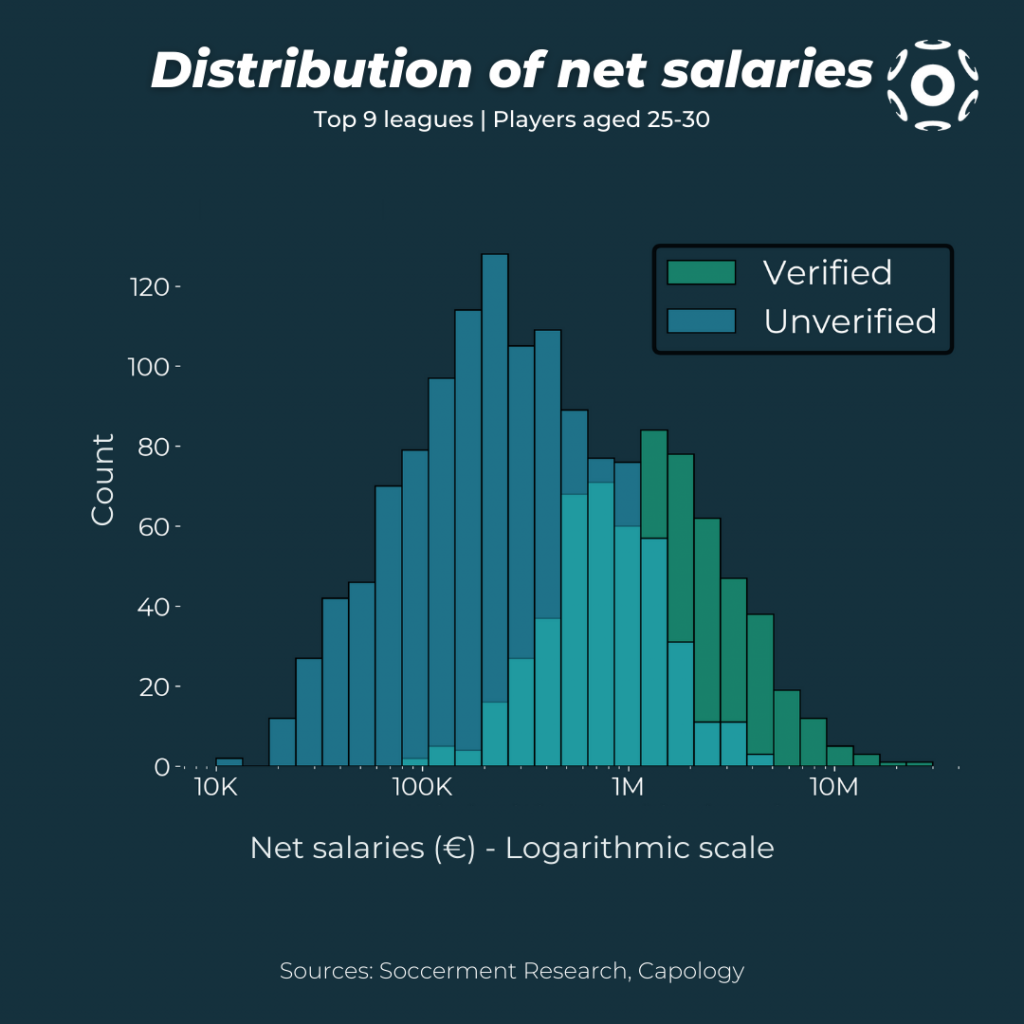
We have selected players with at least 1,000 minutes played, and are between 25 and 30 years of age, in order to avoid a bias towards young players, who tend to be underpaid. This leaves us with a total of 1,798 players, of whom 604 (34%) have verified salaries (as per Capology's definition).
Unverified net salaries average €460k per year, while the verified ones have a mean of €2m. In the figure below we show the full net salary distribution (in logarithmic scale).
In the chart below we show the net salary in EUR (in logarithmic scale) as a function of the Soccerment Performance Rating (SPR). A first exploration of the combined database shows a clear link between salary and performance, with higher performing players earning higher salaries. However, there is significant variance in the data in both directions, with some players receiving a salary that is far from the average for their performance rating.
Analysis of the results
Undervalued fractions
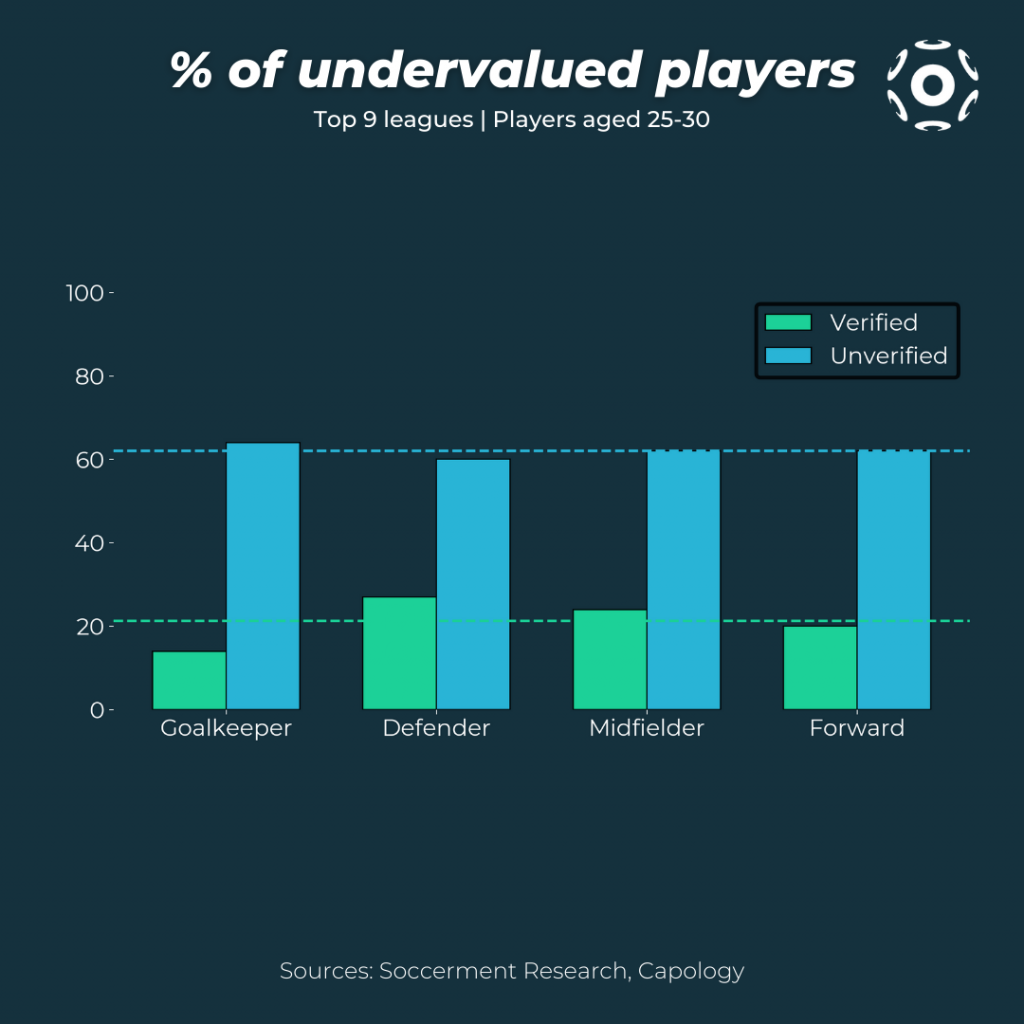
Our results show that the proportion of players who are underrated in each role is significantly higher for players with unverified salaries (60%, on average) than for the ones with verified salaries (20%, on average). This is not surprising given that unverified salaries are, on average, significantly lower than the verified ones, as discussed above. In the following chart we show these percentages for each group and the overall average values as horizontal lines.
The undervaluation model
In order to quantify how much a player is being “undervalued” in terms of salary in relation to his performance rating, we divided the player database into four broad positions (goalkeepers, defenders, midfielders, and forwards), in order to avoid biases related to the player’s role.
For each position, we identified the trend line of the distribution with a robust linear regression algorithm applied to the SPR and the logarithm of the net salary. The algorithm detects whether a point is an outlier with respect to the bulk of the data, and takes this into account so that the fit is not heavily influenced by uncommon values. Having computed the trend line, we calculate the vertical distance between each point and the line. We then select players that fall below the trend line, and index this distance up to 100 to yield an “undervalue index” for each position.
We use the outlier detection method included in our linear regression algorithm to select the “true” undervalued players, those that are identified as actual outliers with respect to the general distribution. This is because a certain amount of dispersion around the trend line is to be expected due to factors unrelated to the SPR, while our aim is to focus on those players that are undervalued by an amount that is not justified, even considering other factors which affect a player’s salary. In the following figures we show the distribution and trend line for the four roles, with the salaries in logarithmic scale. The true outliers with respect to the trendline are shown in full colour, while the inliers are more transparent.
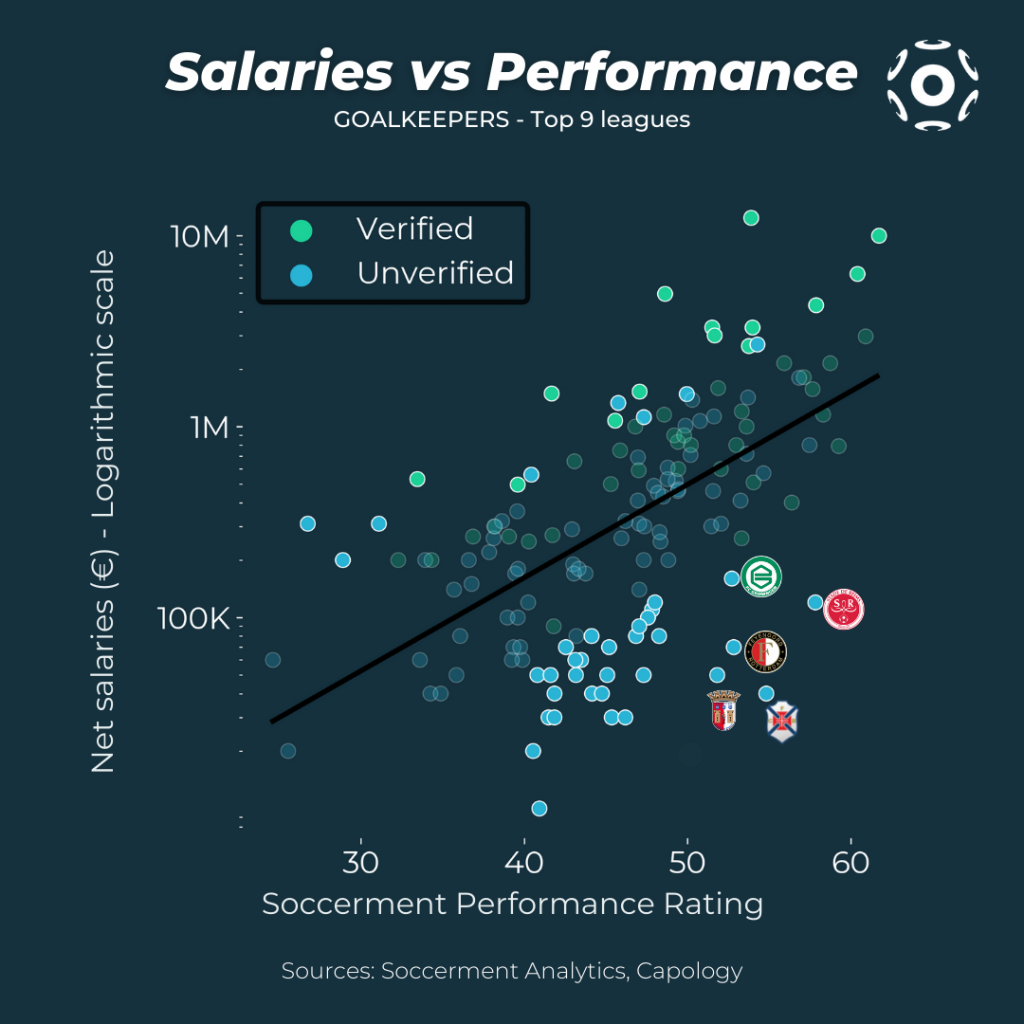
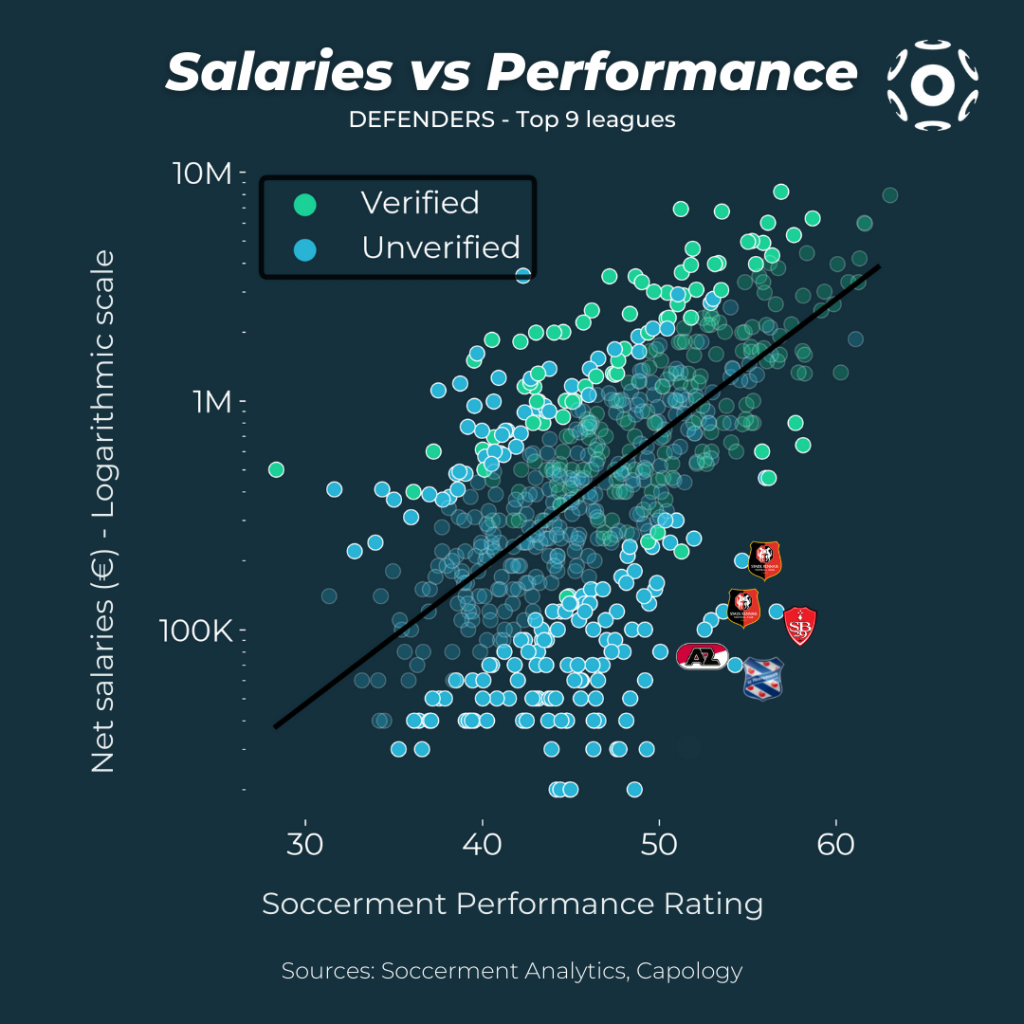
We focus our attention on the players who display a Soccerment Performance Rating (SPR) of 50 or above and, within these groups, we highlight the players with the highest "undervalue index".
Here below, the list of the fourteen 'Hidden Gems' that we analyse separately, in our eBook. Two of them have been "uncovered" during the current transfer market and have already completed their moves to their new clubs:
- Steven Berghuis moved to Ajax from Feyenoord, in one of the most controversial switches of the last decade in the Eredivisie;
- Pierre Lees-Melou moved to Norwich City from OGC Nice.
For any query, suggestion or comment, feel free to send us an email: research@soccerment.com.