
According to our advanced metrics, Inter Milan are performing better under Inzaghi than they did under Conte last year, when the Nerazzurri won their 19th Scudetto. Whilst AC Milan have been reaping more points than expected based on the scoring chances they created, Juventus accumulated fewer points than they deserved, according to our xPts model: mean-reversion, plus a favourable calendar in March should lead the Old Lady to considerably improve their league position by spring 2022. Our analysis shows that Fiorentina and Torino were the teams improving the most compared to the first half of last season, while Roma saw a significant dip in performance under Mourinho. Finally, we put some key players through the advanced metrics’ lenses: Vlahovic, Abraham, Candreva, Insigne and Scamacca.
Current standings: real vs. expected performance
A lot has changed in Serie A this season. Reigning champions Inter Milan were forced to replace their coach and three key players in the summer. Juventus let Cristiano Ronaldo go and went back to the reassuring guidance of Allegri. Inter’s treble-winning coach Mourinho found a new home in Rome, while Sarri and Spalletti have marked their return to the Serie A, with new and fascinating experiences at Lazio and Napoli, respectively. Halfway through the season, we take advantage of our extensive advanced metrics dataset to analyse the performance of Serie A teams, and quantify the impact of these big changes.
The standings halfway through the season see reigning champions Inter Milan top the league table with 46 points, followed by city rivals AC Milan (42), Napoli (39), Atalanta (38) and Juventus (34). Our Expected Points (xPoints, xPts or xP) model, which is based on the Expected Goals (xG) of individual shots and possessions during the game, is a key tool to put the table standings into perspectives in terms of the team’s underlying performances.
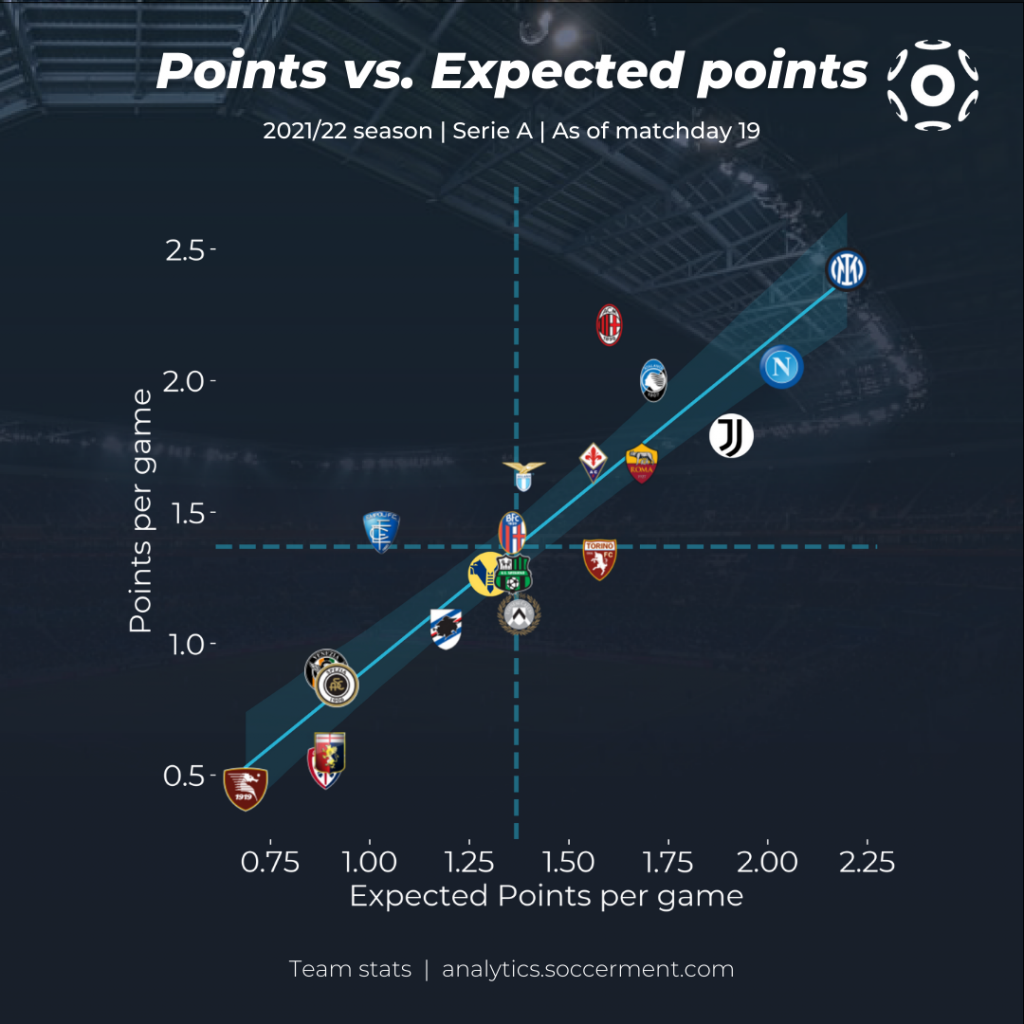
We can see that while for Inter and Napoli the points appear to be justified by their performance, AC Milan have been reaping more points than expected based on the scoring chances they created, ranking only 6th for xPts, as opposed to their 2nd place in the table. Such an overperformance is unlikely to be sustainable throughout the season.
On the other hand, Juventus have reaped fewer points than they deserve, according to our xPts model, which would rank them 3rd in the league, as opposed to their current 5th place. In the middle of the table, Empoli and Torino stand out as opposite cases. The former find themselves in 9th place, but rank 15th for xPts. The latter rank 11th, but their performance places them in 7th place for xPts.
Calendar difficulty and team momentum
The teams’ match schedule may have had at least some degree of influence on their apparent momentum. In the following graphic we show each team’s xPts progression through monthly averages. The data clearly shows that while Milan and especially Napoli had a great start of the season, Inter picked up momentum in the last two months with truly dominating performances. To contextualize the incredible start of the season of Napoli and AC Milan, they have managed to tie the points record after 11 matchdays of Serie A (31). However, they had a dip in performance shortly after eventually falling behind the reigning champions.
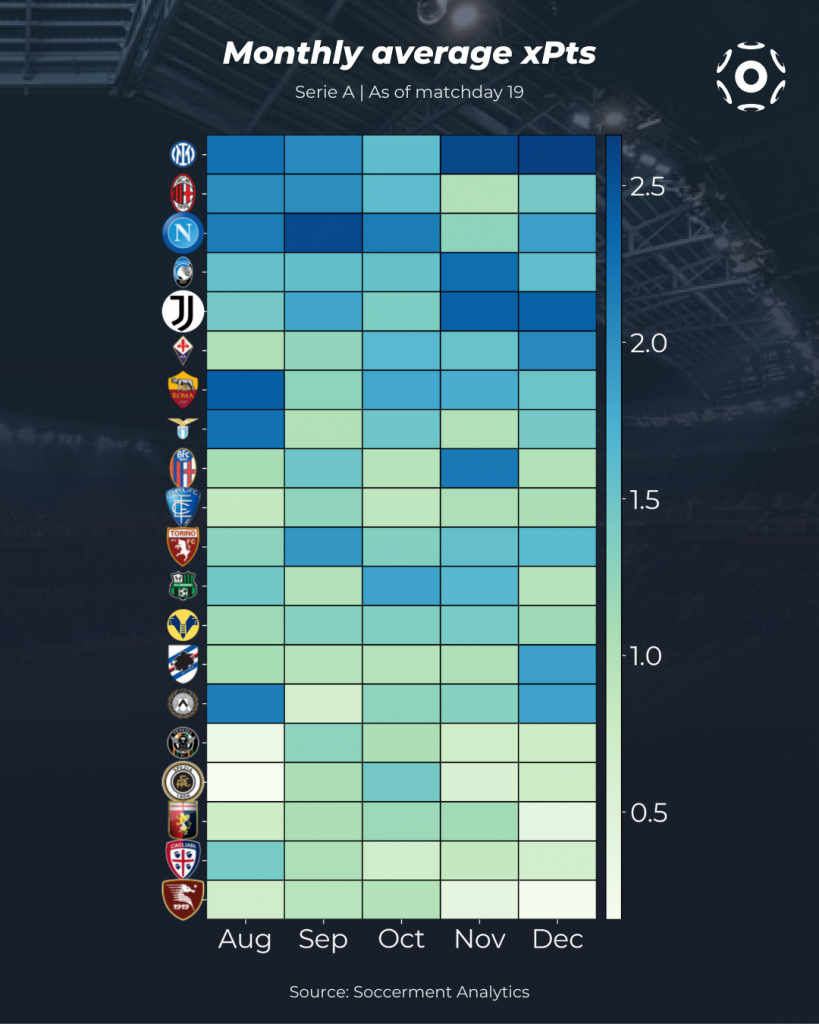
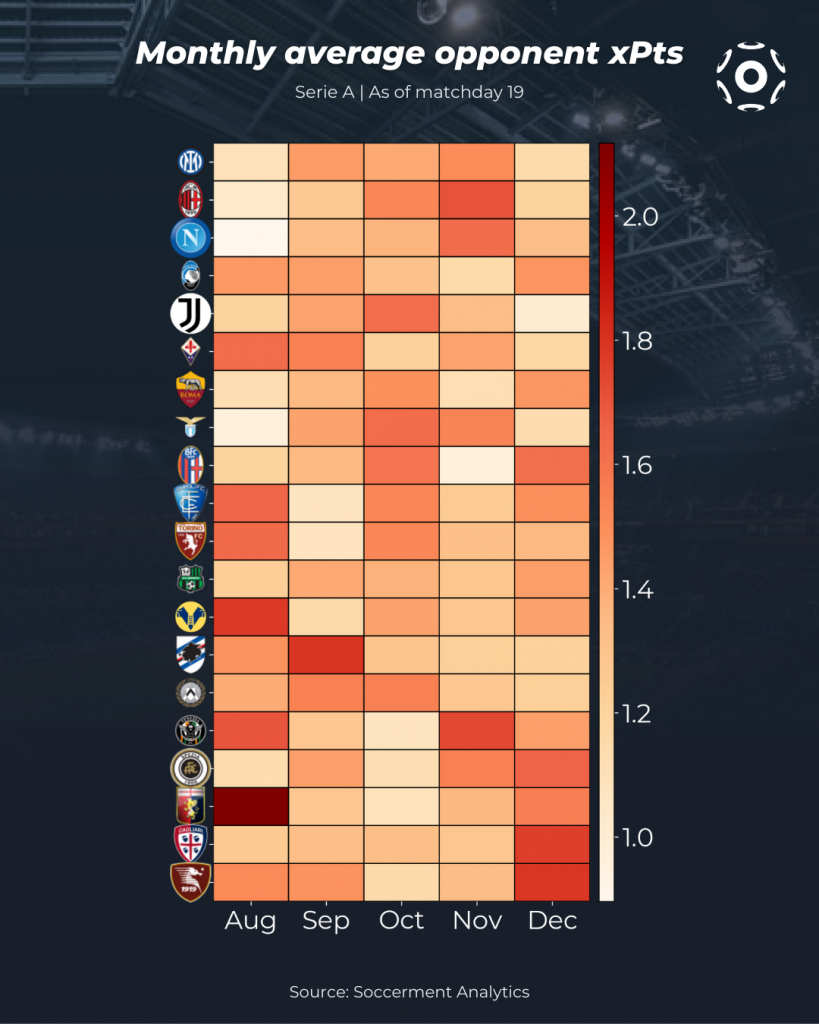
If we now look at calendar difficulty, expressed as average xPts of the opponents faced in each month, we can see that the dip in form for Milan and Napoli in November could be partly due to the higher level of their opponents. We can also see that while Inter’s stellar record in December was eased by a lower level opposition, their performance in November was perhaps more impressive given the calendar difficulty.
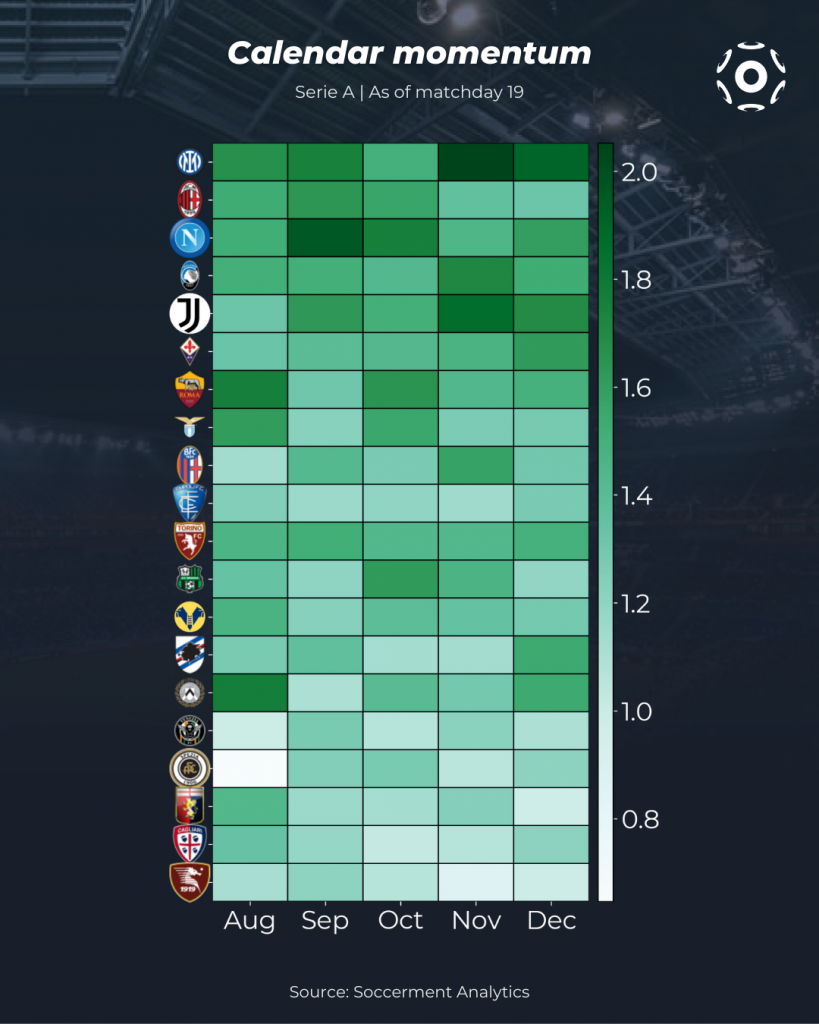
We can visualize a synthesis of the two aspects into a calendar momentum metric, defined as a simple average between the mean xPts in the month and the mean xPts of opponents faced in the same month. The distribution is shown in the figure below. As mentioned above, this does indeed confirm that Inter’s performance in November should be considered more impressive than the one in the following month. It also shows that, when accounting for difficulty, Torino’s performance was remarkably steady throughout the first half of the season.
We can have an approximate idea of the team’s expected performance in the second half of the season based on their fixture calendar, using the teams’ average xPts so far and accounting for home advantage. Quite simply, for each home match we estimate the projected xPts of the home team as:
home team avg xPts at home – (opp. team avg xPts away – avg xPts away)
and viceversa for away matches. We then simply averaged the projected xPts from all matches in the month for each team.

Based on this simple model, we can see that the hardest month for table leaders Inter should be April, while it should be March for Milan and February for Napoli. Further down the table, Atalanta is expected to have a quite challenging January, while Juventus should be expected to have a good run in March.
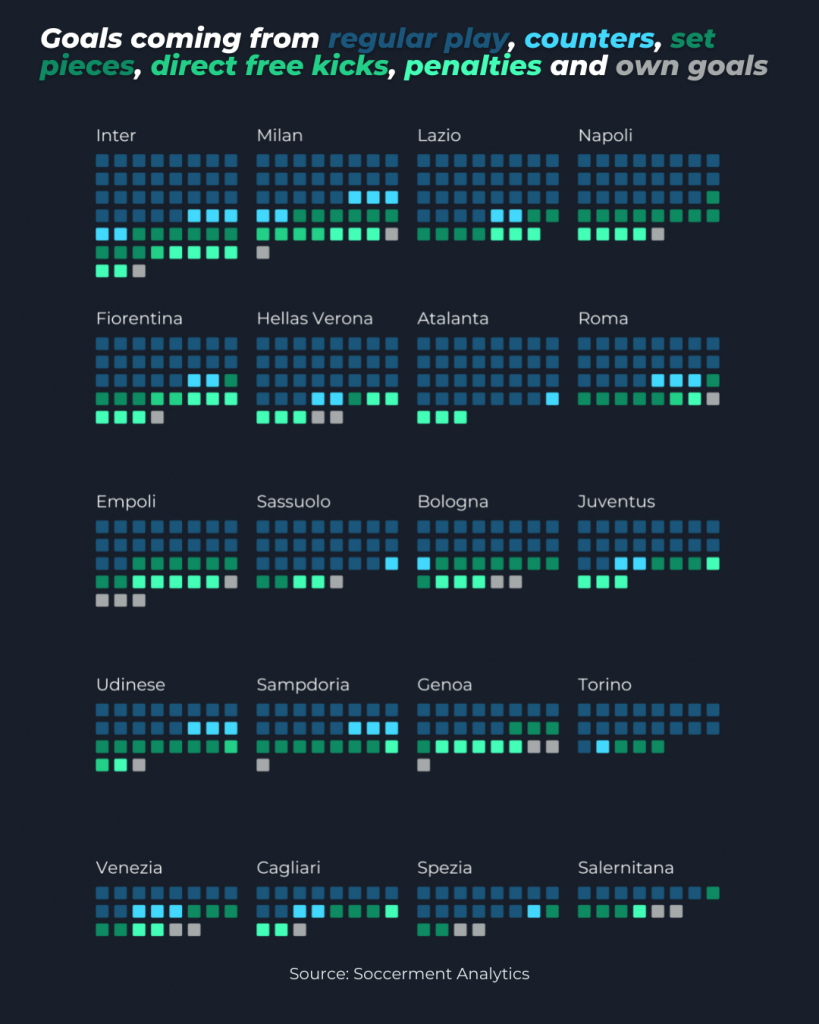
Where do goals come from?
In the following graphic we show the distribution of situations of play leading to goals for all 20 teams in Serie A, sorted by total goals scored. The teams that scored a larger fraction of their goals from regular build-up play situation are Atalanta (89%), Sassuolo (82%) and Torino (81%), three sides with a clear possession-based style imparted by their managers. On the other end we have Udinese and Venezia, both with just 50% of goals from regular play, and Milan with 54%. The Rossoneri are also the side to have benefited the most among the top 8 teams from opponent own goals (2 goals, 5% of team goals), and among all teams when it comes to direct free kicks (4 goals, 10% of goals). Inter and Napoli lead the way for goals scored from set pieces (actions originating from corner kicks, crossed free kicks and throw-ins) with 9 goals, making up 18% and 25% of the team’s goals, respectively. The reigning champions also rank first for penalty goals (6), on a par with Fiorentina.
Comparing the first half of 2021/22 with the same period of 2020/21
We can assess the change in offensive and defensive performance with respect to the first half of last season by comparing teams’ xG and xG against (or xGA). In the following graph, we show a comet tracing the path from the teams’ 2020/21 data (at the same matchday) to the current one, indicated by the team logo. This gives us a sense of how much better or worse a team is performing this season, and in whether it is in attack or in defense.
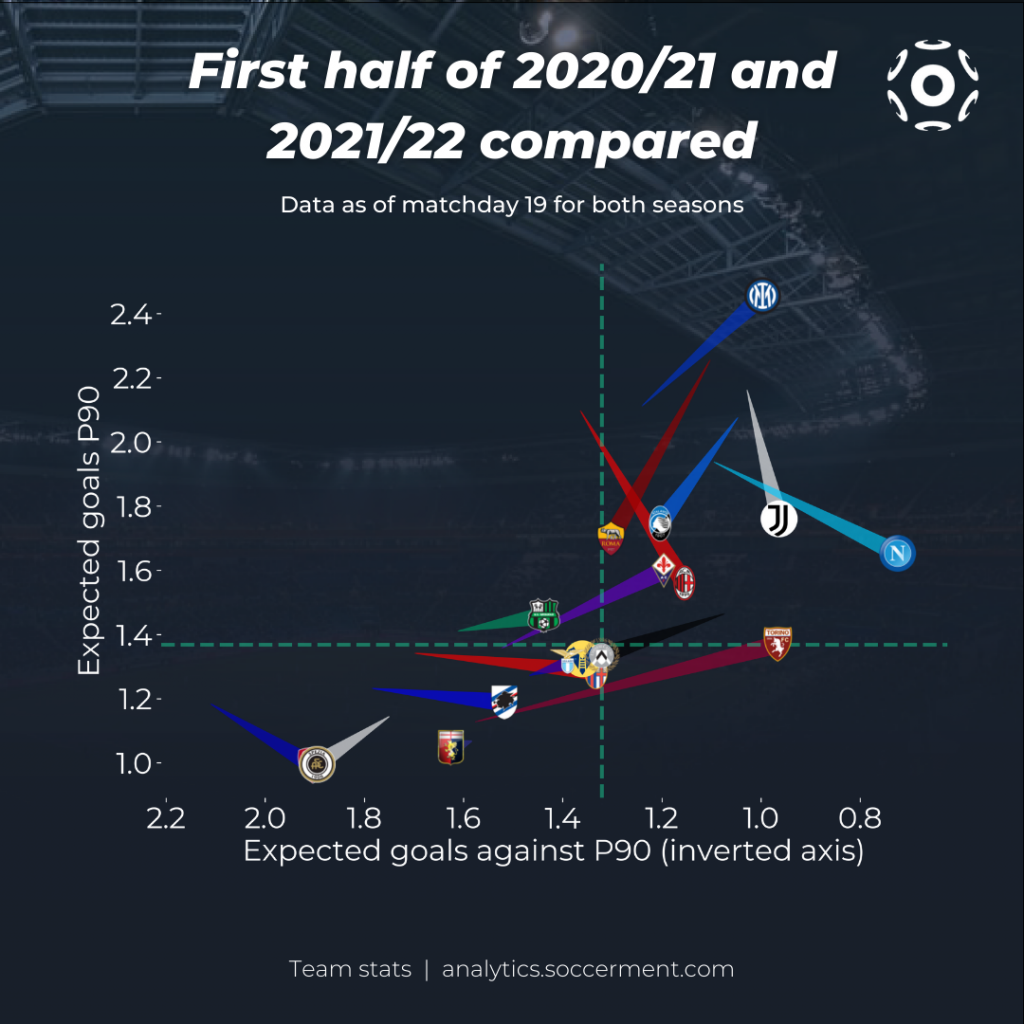
The teams that turn out to have improved the most halfway through the season are Torino, Inter and Fiorentina, with a change in average xG difference (xGD) of +0.85, +0.59 and +0.57, respectively. For the Granata, the bulk of the improvement is in defense, with xGA down from 1.58 per match in the first half of 2020/21 to 0.99 this season. Inter saw a more homogeneous improvement both in defense (xGA from 1.24 to 1.00 per match) and attack (xG from 2.11 to 2.46 per match). This change should be read with the caveat that during the first half of last season Conte unsuccessfuly experimented with somewhat reckless attacking tactics, which changed later in the season to stabilize the team’s perforamance, leading to the title. Fiorentina also improved in both halves of the pitch, with xGA down from 1.52 to 1.19 per match and xG up from 1.36 to 1.60 per match. All three teams are perfect examples of a successful manager change, with Juric, Inzaghi and Italiano making the most of their new tenure. Torino’s improvement is particularly impressive, with Juric’s work likely getting less praise than it deserves because of the mismatch between performance and results, as mentioned above in relation to our xPts model.
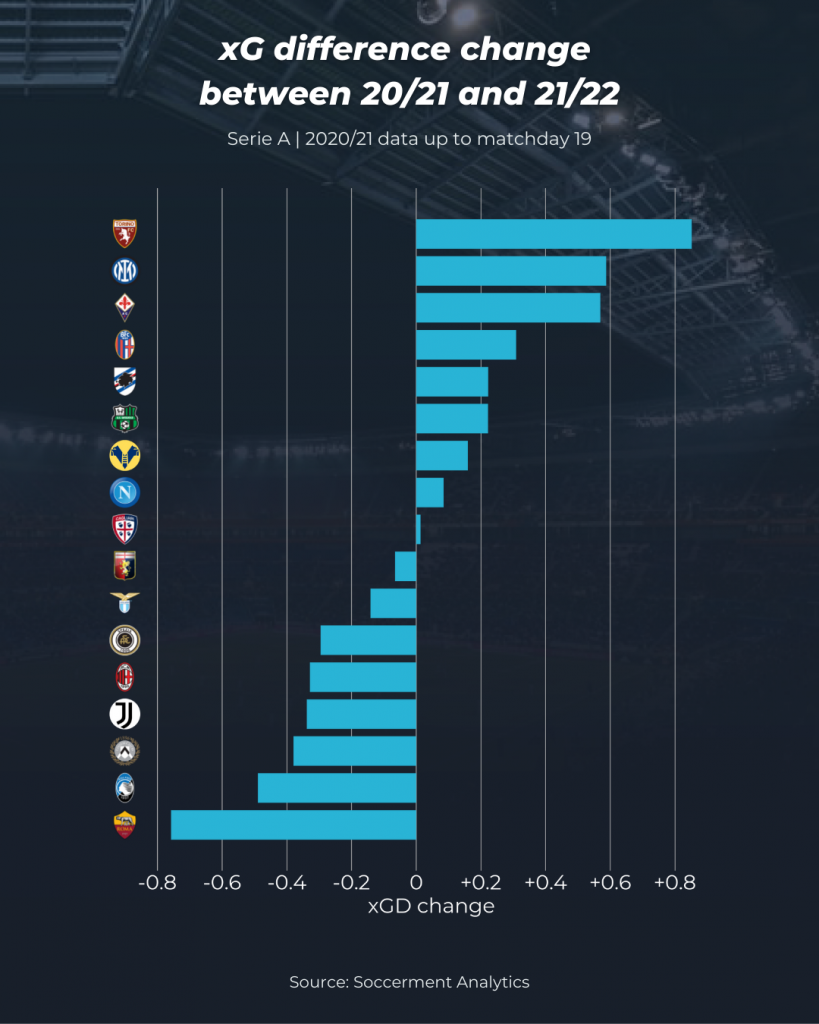
On the other hand, Roma, Atalanta and Udinese are seeing a significant dip in performance compared to the first half of 2020/21, with a change in average xGD of −0.76, −0.49 and -0.39, respectively. Jose Mourinho’s Roma are struggling on both halves of the pitch, with xG down from 2.26 to 1.70, and xGA up from 1.10 to 1.30. With no significance overperformance over the models, this leaves the giallorossi six points down from the UCL spots. Atalanta, on the other hand, have managed to maintain their top four status with more clinical finishing, which sees them outperform their xPts significantly (but not as much as AC Milan), in spite of a drop in xG from 2.07 to 1.75 per match and an increase in xGA from 1.05 to 1.20. Juventus (−0.34) and Milan (-0.33) appear as 4th and 5th from the bottom in this ranking, respectively. While the Rossoneri have been able to compensate this with a very significant outperformance of their expected points return, this hasn’t been the case for Juventus. The Bianconeri find themselves in 5th place, 12 points behind Inter, mostly due to a strong dip in attacking form, with xG dropping from 2.16 per match at the same point of the 2020/21 season to 1.76 per match this season, which hasn’t been compensated by a mild drop in xGA from 1.03 to 0.96 per match. The departure of Cristiano Ronaldo, who produced 0.73 non-penalty xG P90 in 2020/21, would be the most obvious reason for such a dip in form. Indeed, the Portuguese star was responsible for 26% of Juventus’ npxG in the first half of 2020/21 (9.63 out of 37.17). Interestingly, if one were to increase Juventus’ npxG this season (29.52) by 26%, this would bring the total to 37.18 npxG, virtually identical to last season’s total after 19 games.
Tactical notes: pressing and territorial dominance
In this season several Serie A clubs have changed their coach, inevitably leading to a change in their playing style. One of the most important changes regards the teams’ tendencies to initiate pressing and their consequent ability to have territorial dominance. In the graph below, we show the change in pressing, measured through Passes Per Defensive Action (PPDA, where lower values imply more high pressing), and territorial dominance, measured with field tilt (the fraction of total final third passes in a match belonging to each team).
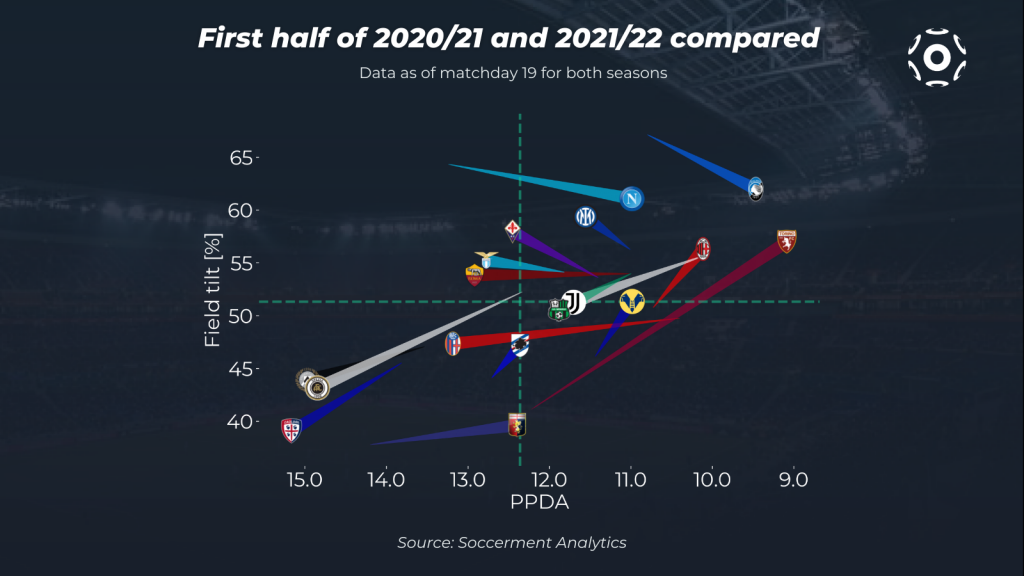
Without a doubt the most impactful change has been experienced at Torino, where Ivan Juric has brought a high-intensity pressing style which significantly differs from last season. The club have gone from ranking mid-table (PPDA of 12.22) to being the Serie A club with the lowest PPDA (9.08). At the same time the different style has seen the Granata go from having one of the lowest baricentres in Serie to being one of the clubs with the highest territorial dominance.
As last season, Atalanta have the highest field tilt in Serie A (61.98%), as well as the second lowest PPDA in the league (9.41). The similarities between Atalanta and Torino shouldn’t come as a big surprise considering that the managers share very similar philosophies and footballing principles. This can also be seen at Hellas Verona, where – after Eusebio di Francesco’s unsuccesful stint at the begging of the season – Igor Tudor has built upon the solid foundations laid by Juric in recent years.
The arrival of Spalletti at Napoli has seen the team adopt a different approach compared to last season, the team is capable of combining intense pressing (10.99) once the ball is lost with the ability to keep opposing teams in their own half (2nd best field tilt in Serie A, 61.06%).
The arrival of Italiano at Fiorentina has brought greater attention towards ball possession, ultimately allowing the club to achieve one of the highest field tilts in Serie A (57.98%). It is also interseting to notice how Fiorentina’s PPDA of 12.45 is very close to that achieved by Spezia in 2020 (12.33). However, his departure from Spezia and the subsequent arrival of T. Motta has seen the club from Liguria plummet towards the bottom left of the graph resulting in one of the highest PPDA in the league (14.84) as well as one of the lowest field tilts in the league (43.16%). Also Cagliari have been adopting a much more conservative attitude, especially under new coach Walter Mazzarri, which has led them to register the 2nd highest PPDA in the league (15.16) as well as the 2nd lowest field tilt (39.08%).
Bologna have changed system throughout the season switching to a 3-man defensive line which has allowed them to collect a string of positive results after a shaky start. Their PPDA has significantly increased from last season going from 10.40 to 13.18. However, a more conservative attitude has allowed them to bring their xGA P90 from 1.70 to 1.36 while offensively losing just 0.05 xG P90, which results in a very signifcant improvement of their xGD (+0.31).
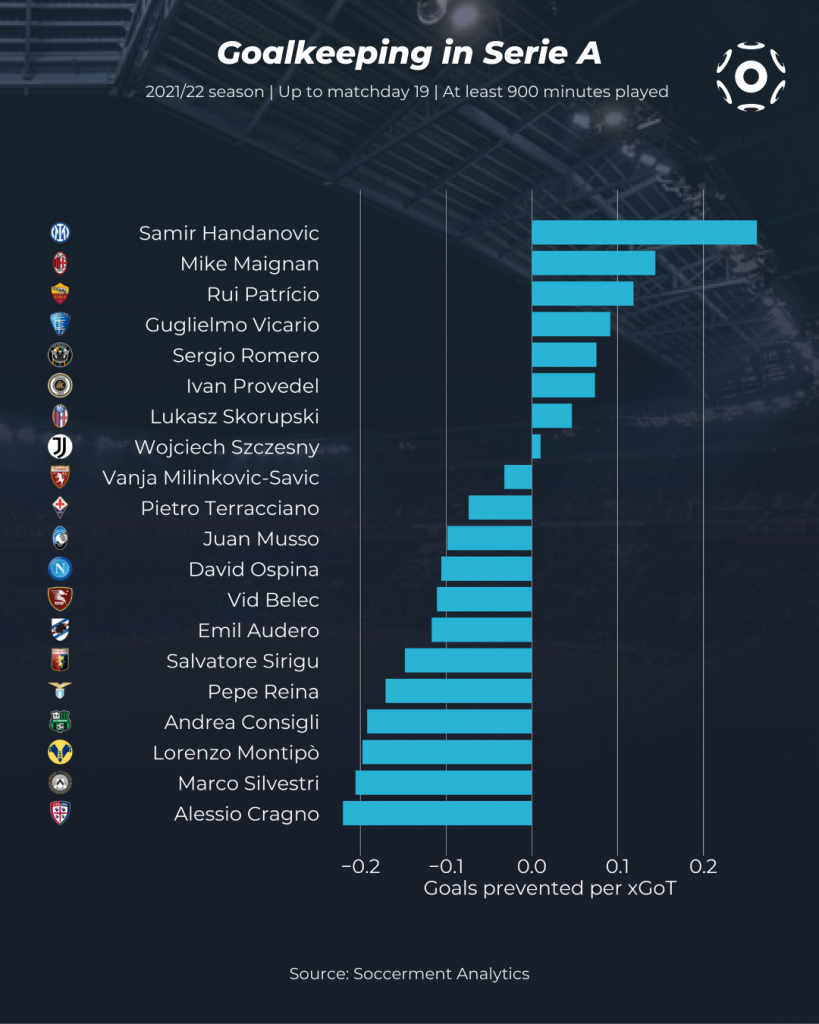
Goalkeeping: the best shot-stoppers
At the turning point of the season, we can evaluate goalkeepers based on their shot-stopping ability using our goals prevented metric, derived from Expected Goals on Target (xGoT). The total xGoT faced by a goalkeeper represents the number of goals they should have been expected to concede based on the chance quality (measured by xG) and the shot placement within the goalmouth. Comparing this with actual goals conceded, we can see that Samir Handanovic faced a total of 17.63 xGoT, but conceded only 13 goals, meaning he prevented 4.63 goals. The Slovenian keeper is the best shot-stopper in the league so far, both in absolute and in relative terms, when we normalize goals prevented by the total xGoT faced. Behind Inter’s no.1 we find the newcomers Mike Maignan, who is doing an excellent job in replacing Donnarumma for Milan, with 0.14 goals prevented per xGoT, and Rui Patricio, with 0.12. Within the top 4 teams, Atalanta’s Juan Musso has so far failed to live up to expectations, after a high profile move from Udinese: the Argentine has let in more goals than expected, with 18 goals conceded from 16.77 xGoT.
Player focus
Dusan Vlahovic
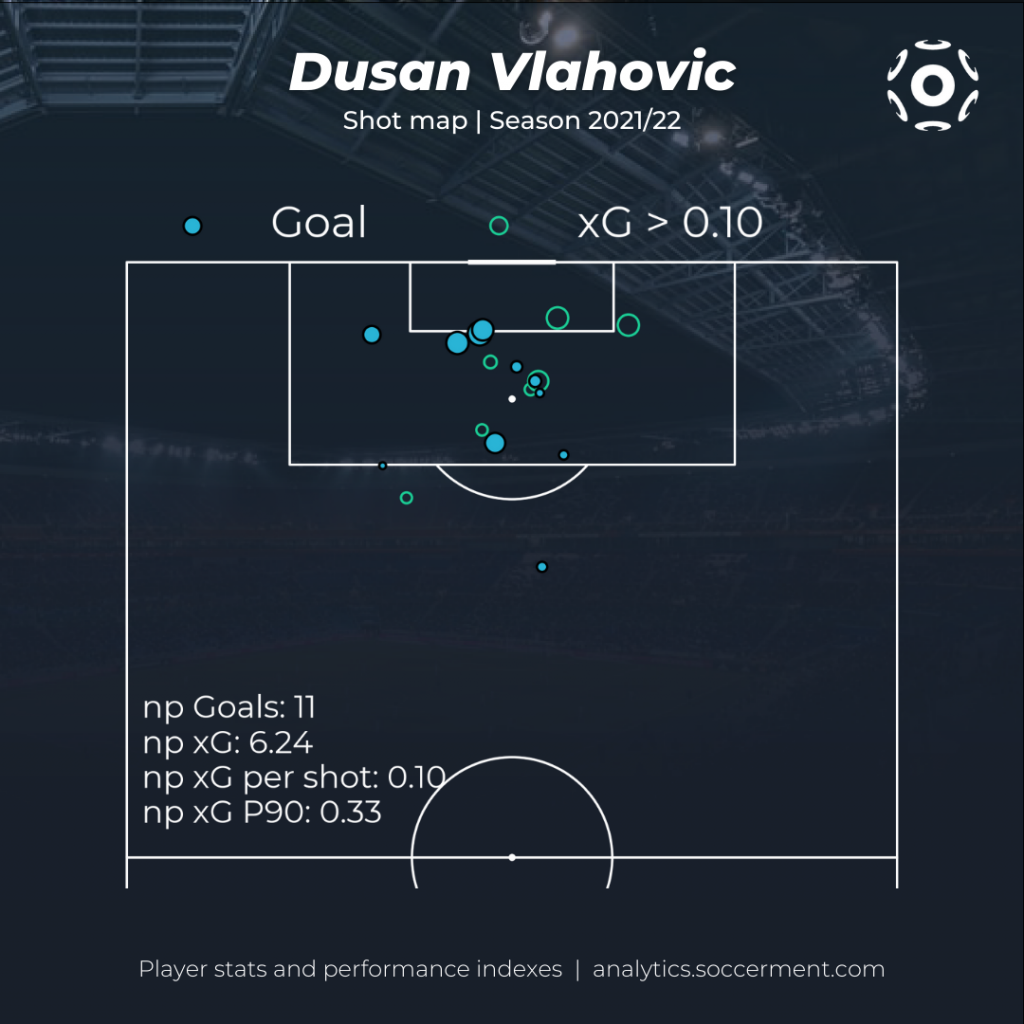
The 21 year-old Serbian is set for a high profile move to a top team this summer, after rejecting all offers to renew his contract with Fiorentina past the current expiration date of 2023, and it is easy to see why if we look at his scoring record. Among forwards born after 01-01-2000 in the top 5 leagues with a minimum of 450 minutes played this season, only Erling Haaland (1.00), Bamba Dieng (0.68) and Jonathan David (0.66) have scored more non-penalty goals per 90 minutes than Vlahovic (0.58), who is currently the top scorer in Serie A with 16 goals.
If we look at the underlying performance and chance quality through xG and exclude penalties, however, Vlahovic ranks only 10th, with 0.33 npxG P90 and an average chance quality of 0.10 npxG per shot, meaning he has been particularly efficient in his finishing. The Serbian’s offensive performance is having a noticeable dip with respect to last season (0.41 npxG P90 and 0.17 npxG per shot), a fact that is overshadowed by his current goal tally, which is significantly inflated by five goals from penalties and one from a direct free kick.
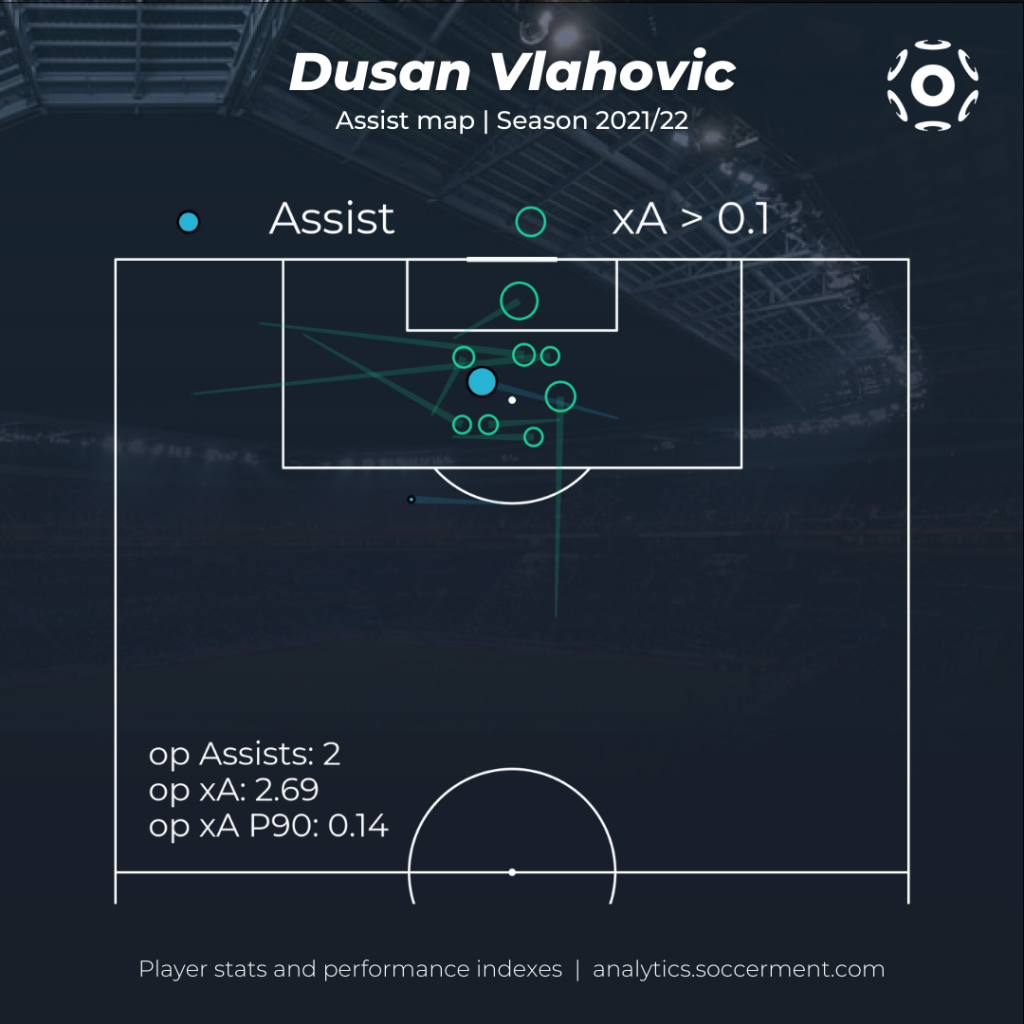
On the other hand, under new coach Vincenzo Italiano, Vlahovic is evolving into a far more associative striker, significantly improving his chance creation contribution. With 2.69 Expected Assists (xA) in the first half of this season, the Serbian has already surpassed his total xA tally from all previous seasons with Fiorentina combined (2.3), meaning his xA P90 have more than tripled, going from 0.04 to 0.14 (8th among strikers in Serie A this season, 5th among U21 strikers in the top 5 leagues).
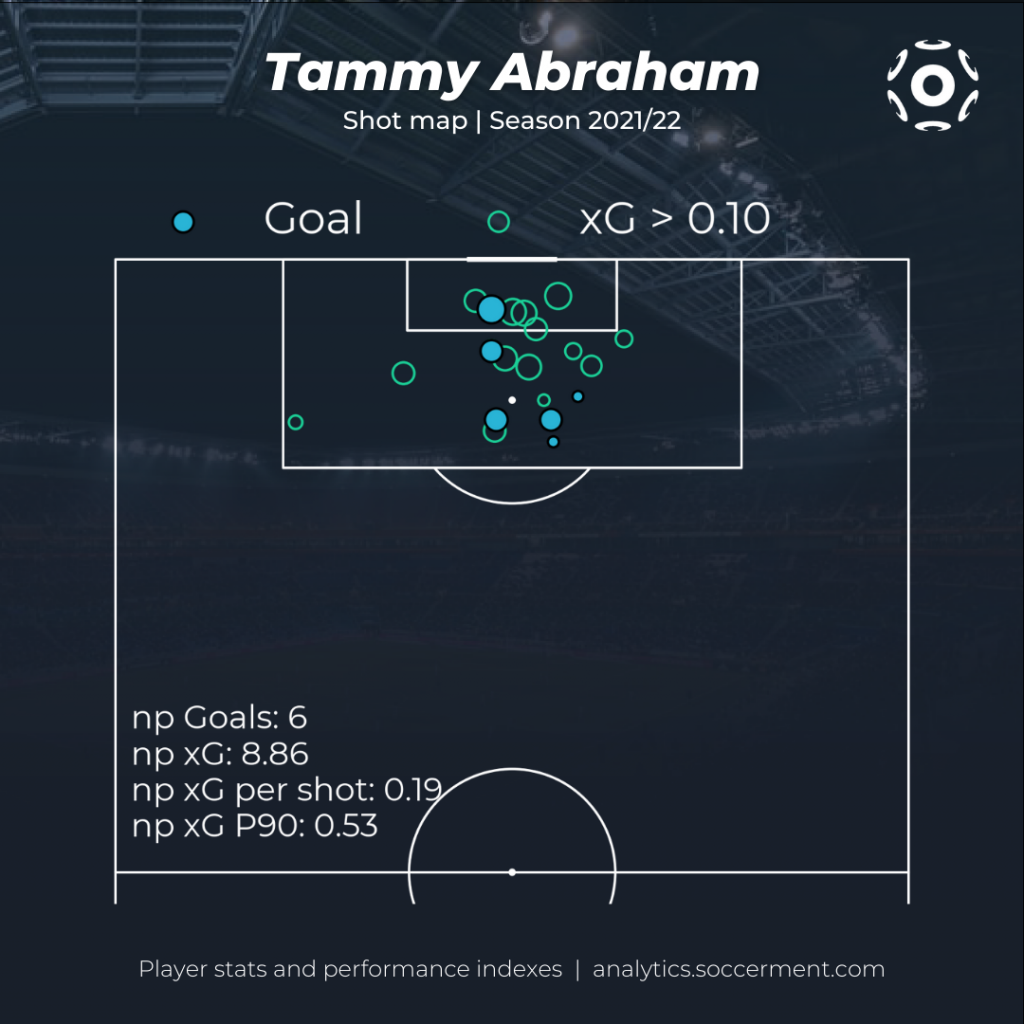
Tammy Abraham
The 24-year-old English striker was one of the highest profile transfers to Serie A this summer, coming in from Chelsea for a fee of €40m. Looking solely at his goalscoring record, one might be tempted to say that his six goals are a somewhat meager return for such a hefty investment. Going beyond the surface to look at his underlying performance, however, gives us a different view. Abraham tops the ranking for total npxG with 8.86, and with 0.52 npxG P90 he ranks 5th in the league accounting for time played, well above Vlahovic’s 0.33. The Englishman is also tied with Duvan Zapata for highest average chance quality among strikers, with 0.19 npxG per shot (among players with at least 20 shots). Considering these numbers, it would be reasonable to expect Abraham’s goal tally to improve and converge towards his expected output by the end of the season. Further confirmation is given by the fact that he tops the Shooting Goals added charts (3.04 SGA) with Ciro Immobile despite hitting the woodwork 4 times (which doesn’t give an associated SGA value), the most in the Serie A tied with Antonio Candreva.
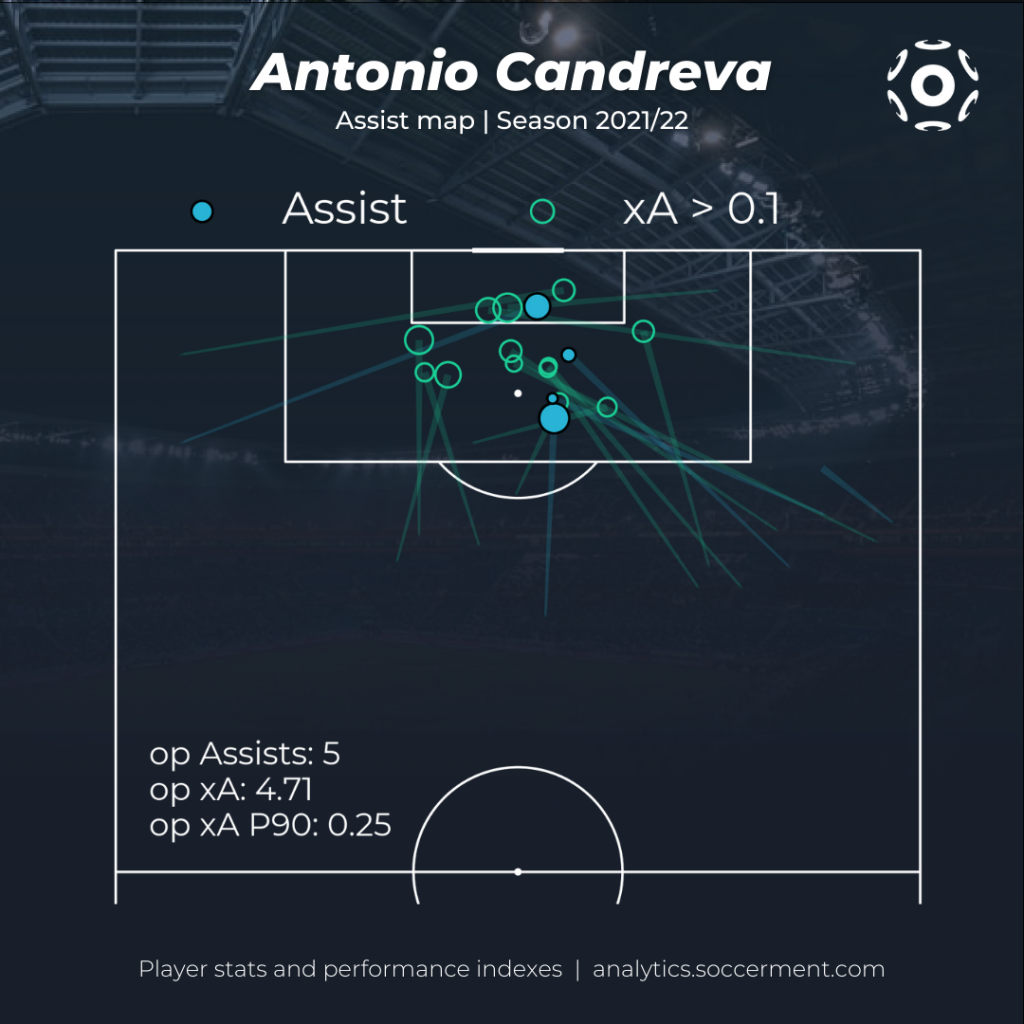
Antonio Candreva
After a successful first season with Sampdoria, Candreva has raised even further the level of his performances. In particular, he has been a constant source of threats from the right-hand side with his typical trait, crossing (1st for successful crosses in Serie A, 23). In particular, he has collected the highest overall amount of xA and opxA in the league (5.91 and 4.71 respectively). While on a P90 basis, he has collected 0.31 xA P90 (3rd in the league behind Malinovskyi and Pellegrini) and 0.25 opxA P90 (best in Serie A). His passes for his teammates, often trigger threatening opportunities which have allowed Candreva to top also the overall xThreat charts in Serie A with a value of 3.12, mainly coming from his passes as his xT from passes of 2.30 is once again the highest in the league. He has also overperformed his xG P90 of 0.17 by scoring an average of 0.32 goals P90. All things considered, with such performances it shouldn’t come as an enormous surprise that he also leads the overall xOVA standings in Serie A (5.89) and that he has been the driving force this season for Sampdoria.
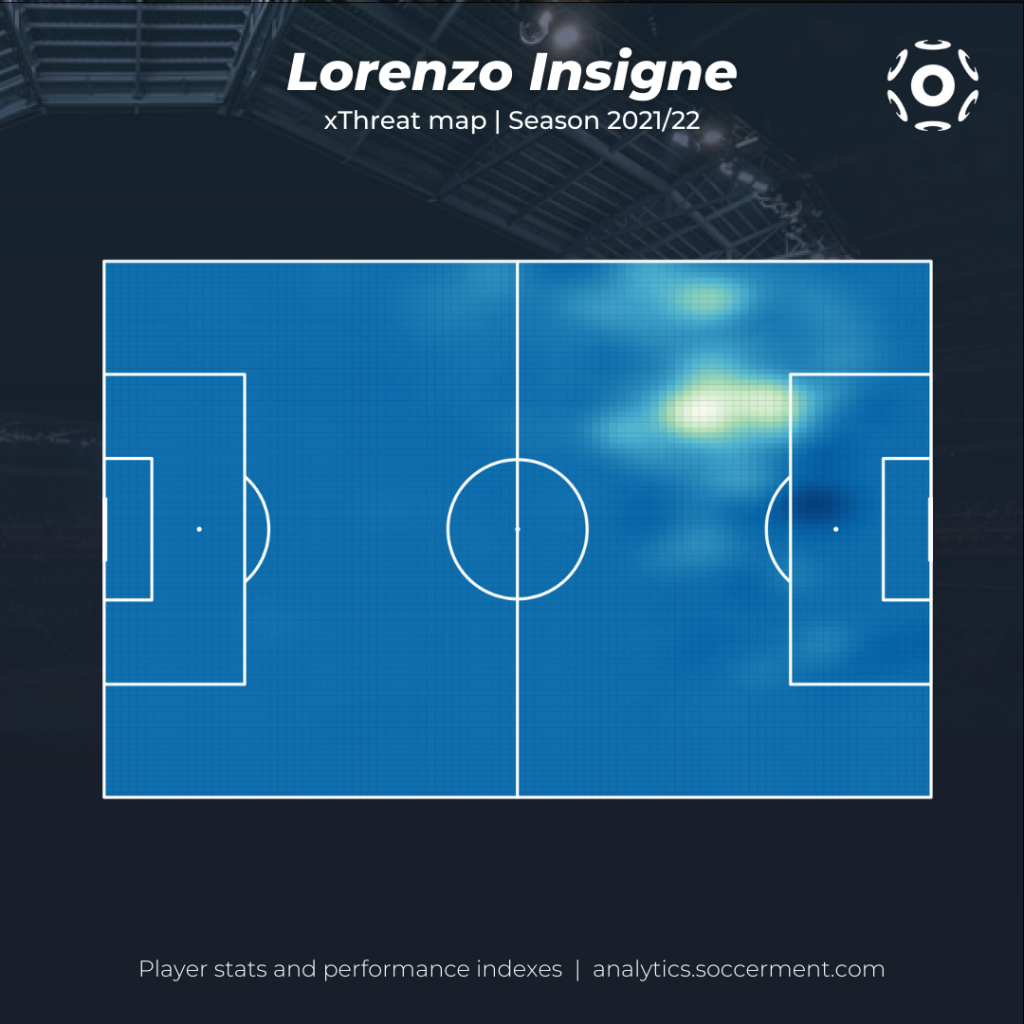
Lorenzo Insigne
Napoli’s captain was an important factor in their hot start to the season. Despite missing some penalties and failing to score from open play, he has been as usual fundamental in Napoli’s chance creation phase. His duties as an advanced playmaker coupled with the trust and chemistry of his teammates have allowed him to top the xT P90 charts in Serie A (0.20 xT P90, 0.12 xT coming from passes and 0.08 xT coming from carries). This is also reflected in his xA P90 (0.22) and xOVA P90 (0.24).
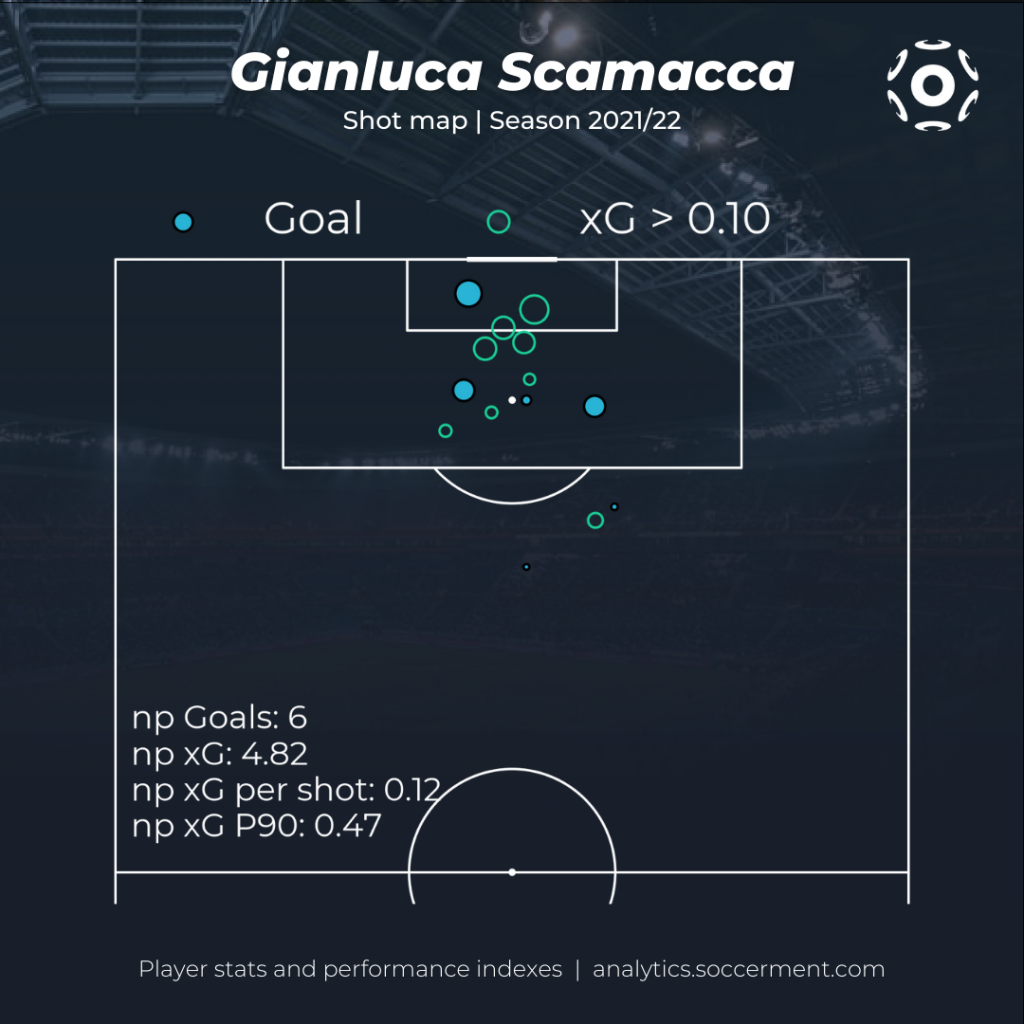
Gianluca Scamacca
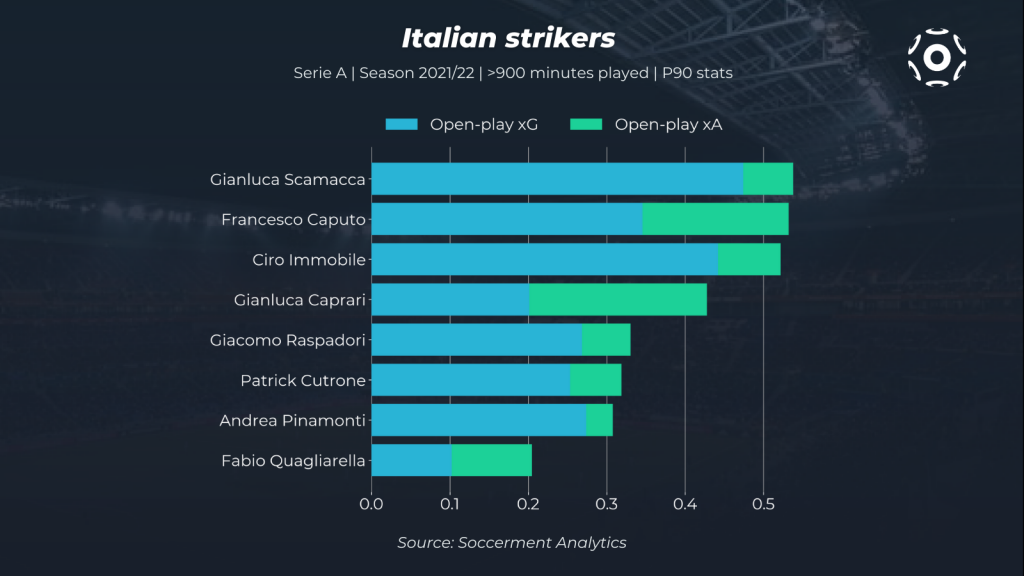
The young Italian striker came to life ever since he started playing as a regular starter around macthday 8. His powerful physique is clearly very different from his teammate Raspadori, who made many starts in that position at the beginning of the season. However, with the injury of Boga, Raspadori took his place with Scamacca claiming the central spot. Their characteristics well suit each other with Scamacca functioning as a focal point and Raspadori roaming between the lines drifting from the left towards the center. Having said that, Scamacca distinguishes himself mainly for his finishing, his shot combines extreme power with remarkable accuracy which has allowed him to score 0.56 non-penalty goals P90, thus outperforming his npxG P90 of 0.47.
The 22-year-old’s performance places him first for open-play xG+xA P90 among all italian strikers in Serie A with at least 900 minutes played, followed closely by Francesco Caputo and Ciro Immobile. If the young Italian can keep it up, he will most likely earn a call from Roberto Mancini’s senior national team in the near future.
For any comment, request or query, please write us to research@soccerment.com.