
A stellar start to the season has seen Napoli gain an edge over the rest of the field. Our advanced metrics show that the top spot is well deserved, while Roma are the side with the largest underperformance compared to Expected Points. The two sides show the largest improvement in xG difference compared to 2021/22, almost exclusively in attack for Napoli and in defense for Roma. In terms of playing style, Atalanta has had the most radical change, partially abandoning their signature man-to-man high pressing for a lower defensive block. Current top-scorer Victor Osimhen’s scoring form is corroborated by his underlying performance measured by xG, same as rookie sensations Kvaratskhelia and Lookman, while Deulofeu’s creative prowess continues to make him one of the most underrated players in Europe.
Current standings: Actual vs. Expected performance
For the third season running the Serie A will experience a very unusual calendar schedule with lots of games packed in short periods. Such tight schedules and the introduction (and confirmation) of the 5-substitution-rule has incentivized mangers to increase rotation among squad players in order to prevent injuries and maximize the players’ physical output.
As we can notice in the graph, Napoli has been by the standout team both in terms of points and Expected Points (xP). In fact, they are also the greatest outperformers of xP (+7.88) in Serie A, with Lazio (+6.94) and Juventus (+6.31). Other notable outperformers so far have been AC Milan, Udinese, Salernitana and Empoli (+4.28, +2.27, +3.16 and +2.99 respectively).
Roma is the biggest and only significant underperformer among top clubs (-4.01). The last 3 teams in the table are those who have recorded the largest underperfomances (-6.54 for Cremonese, -6.48 for Sampdoria and -11.08 for Hellas Verona). Verona in particular stand out considering they scored just 5 points despite accumulating 16.08 xP (14th in the league).
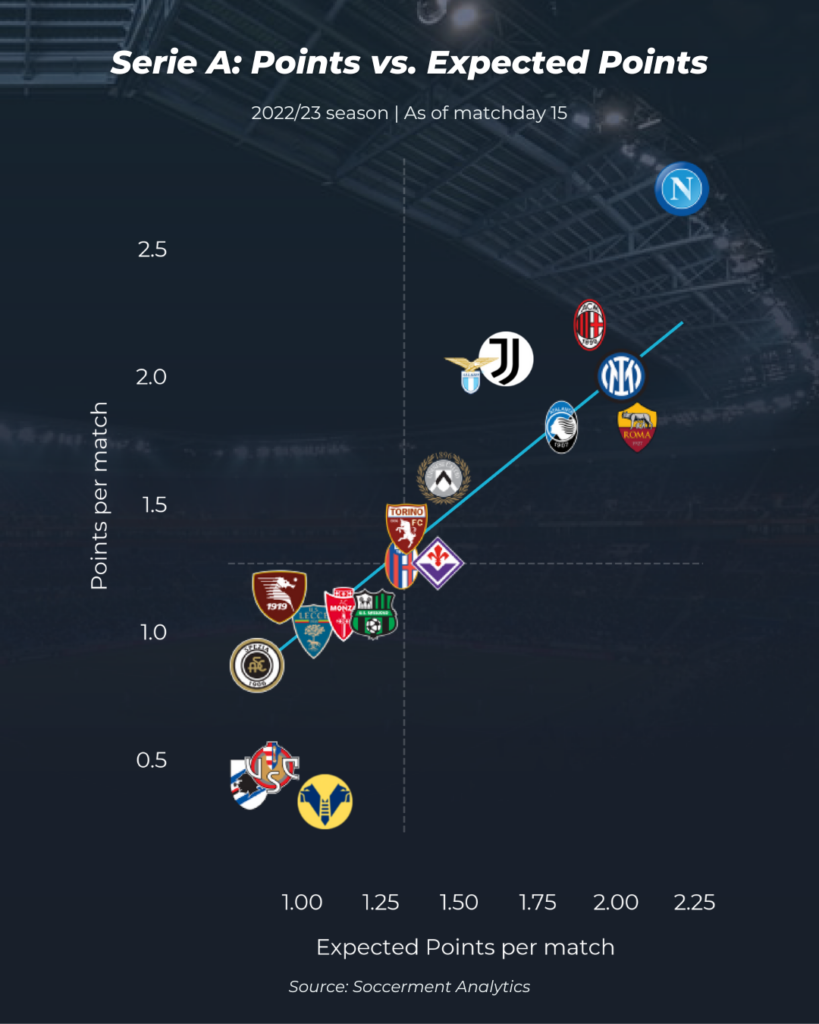
With regards to Expected Goals (xG), the standout outperformers have been Udinese (24 goals in front of 18.88 xG) and Lazio (26 goals in front of 20.19 xG). Napoli and Inter Milan are the teams with best xG production in the league (33.28 xG and 29.86 xG) and have managed to convert their chances at a good rate considering they have scored 37 and 34 goals respectively. Roma aside, the greatest underperformers of xG have been Cremonese (-5.91) and Sampdoria (-5.59), this struggle to find the back of the net is the main reason for which they have also underperformed xP and find themselves trailing the other teams.
If we instead look at Expected Goals Against (xGA), Juventus and Lazio emerge among other top clubs in terms of outperformance of xGA (+8.47 and +5.47 respectively), which coincides with good performances from Perin (3.08 goals prevented), Szczesny and Provedel. Among the rest of the pack, Empoli have recorded by far the largest outperformance (+8.16) partially thanks to Vicario‘s efforts. Salernitana is the other outperformance case with 24 goals conceded in front of 28.66 xGA. The greatest undeperformers among top clubs have been Inter Milan (22 goals in front of 15.70 xGA) and Roma (14 goals in front of 9.96 xGA). Verona and Sampdoria conceded more goals than expected (29 and 27 in front of 22.11 and 22.51 xGA respectively).
Soccerment Analytics 2.0 has arrived! It covers 17 leagues and the access to the top 5 leagues is 101% FREE (it is not only free of charge, but free of ads as well!!).
Calendar analysis: Difficulty and momentum
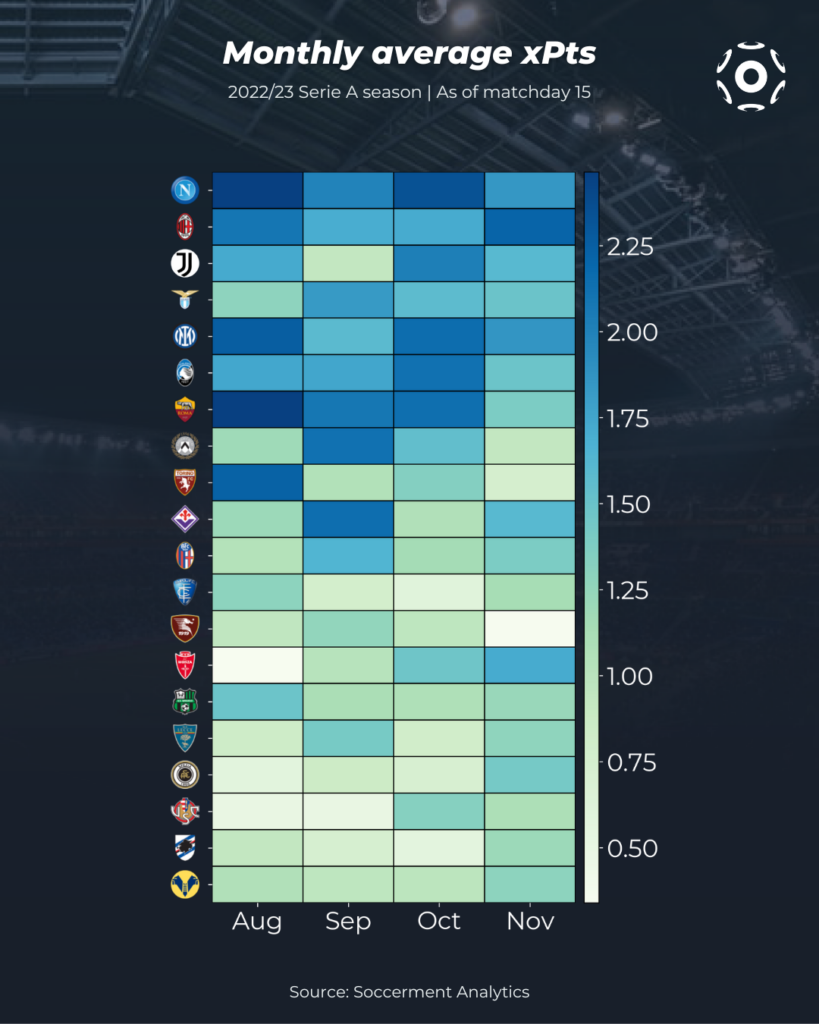
It is always helpful to contextualize the teams’ performance by looking at their match schedule. In the following graphic we show each team’s Expected Points progression through monthly averages. We see that table leaders Napoli have had a consistently strong performance, while Juventus have found a good pace in the past month after a very bleak September.
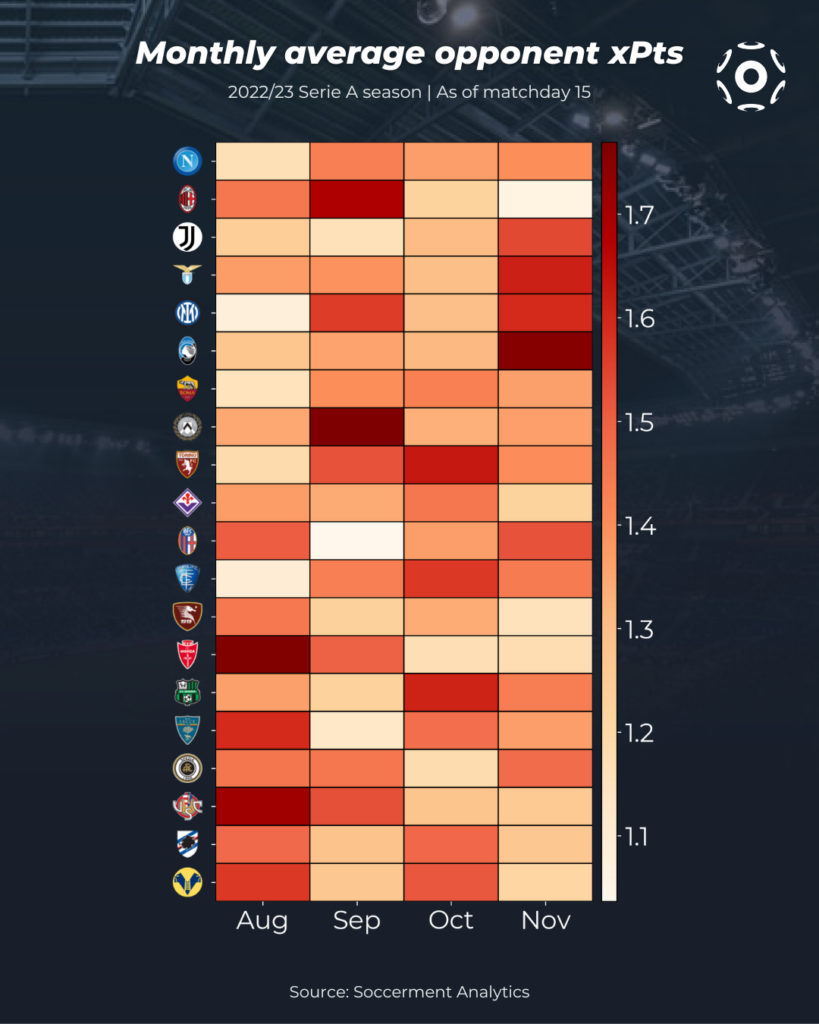
We can contextualize this performance by looking at the level of opponents faced in each month, shown in the next graphic using opponent average xPoints. We see that Napoli’s strong start in August coincided with a comparatively easy calendar, same as Milan’s good performances in November. Surprisingly, Juventus’ struggles in September also coincided with the “easiest” match schedule.
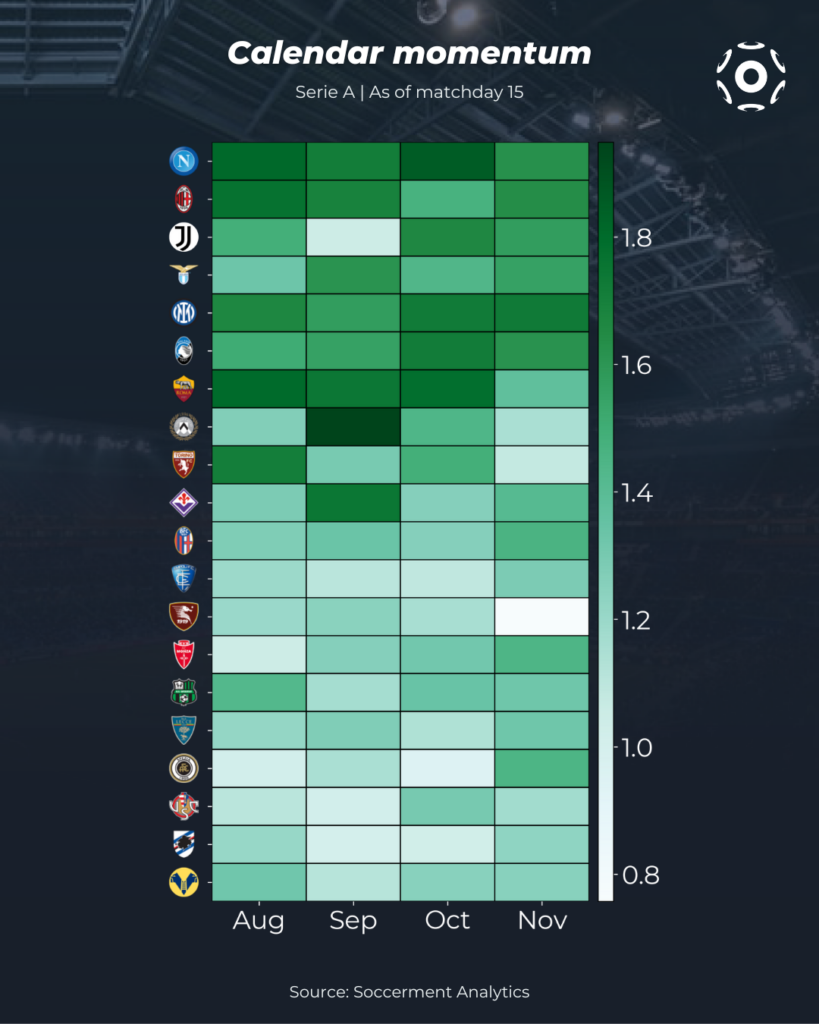
We can visualize a synthesis of the two aspects into a calendar momentum metric, defined as a simple average between the mean xPts in the month and the mean xPts of opponents faced in the same month. The distribution is shown in the figure below. This metric once again underlines Juventus’ woes in September and Napoli’s steady course. It also underlines how extraordinary Udinese’s performance was in September, when they had the highest average xPts against the toughest opponents.
We can have an approximate idea of the team’s expected performance in the second half of the season based on their fixture calendar, using the teams’ average xPts so far and accounting for home advantage. Quite simply, for each home match we estimate the projected xPts of the home team as:
home team avg xPts at home – (opp. team avg xPts away – avg xPts away)
and viceversa for away matches. We then simply averaged the projected xPts from all matches in the month for each team. Since only the last matchday falls in June, we aggregate the matches from the last two months.
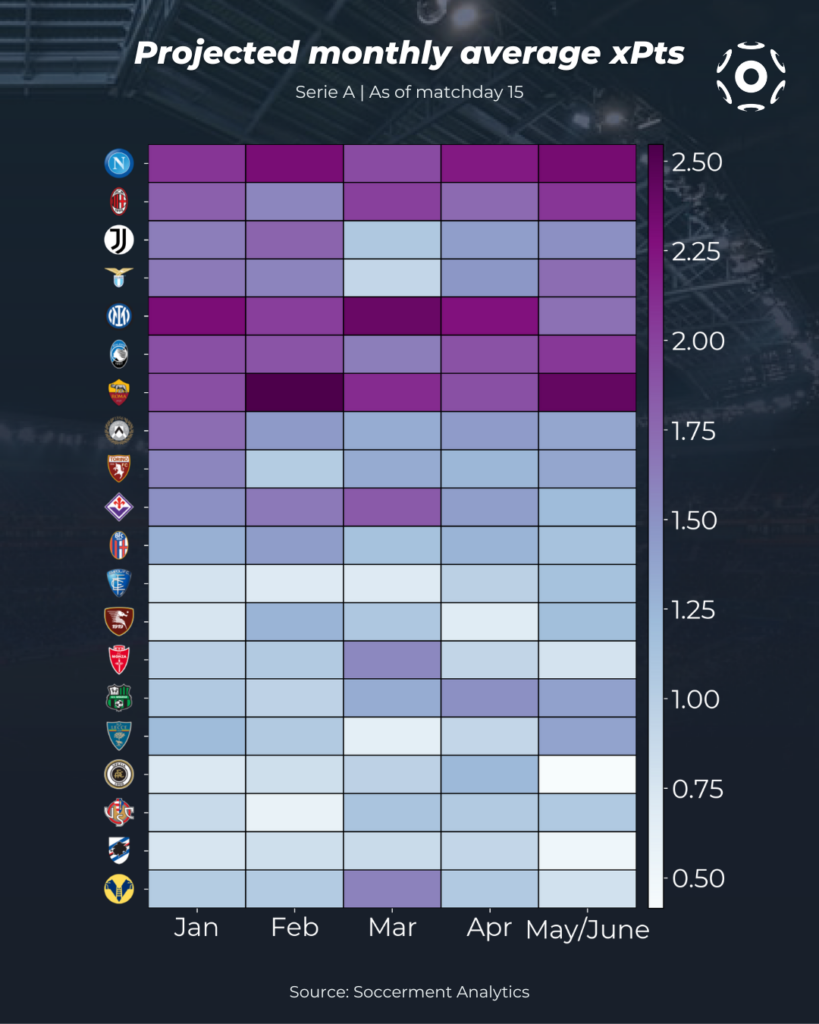
We can see that Juventus and Lazio are both expected to have a tough time in March, a month which should be favorable for Inter instead. On the other hand, the Nerazzurri have a tougher calendar ahead in the tail end of the league. March should be the best month for reigning champions Milan, while February and April should be more challenging. Table leaders Napoli are expected to have a comparatively harder calendar in March, which should be compensated by an easier calendar in the last month.
Where do goals come from?
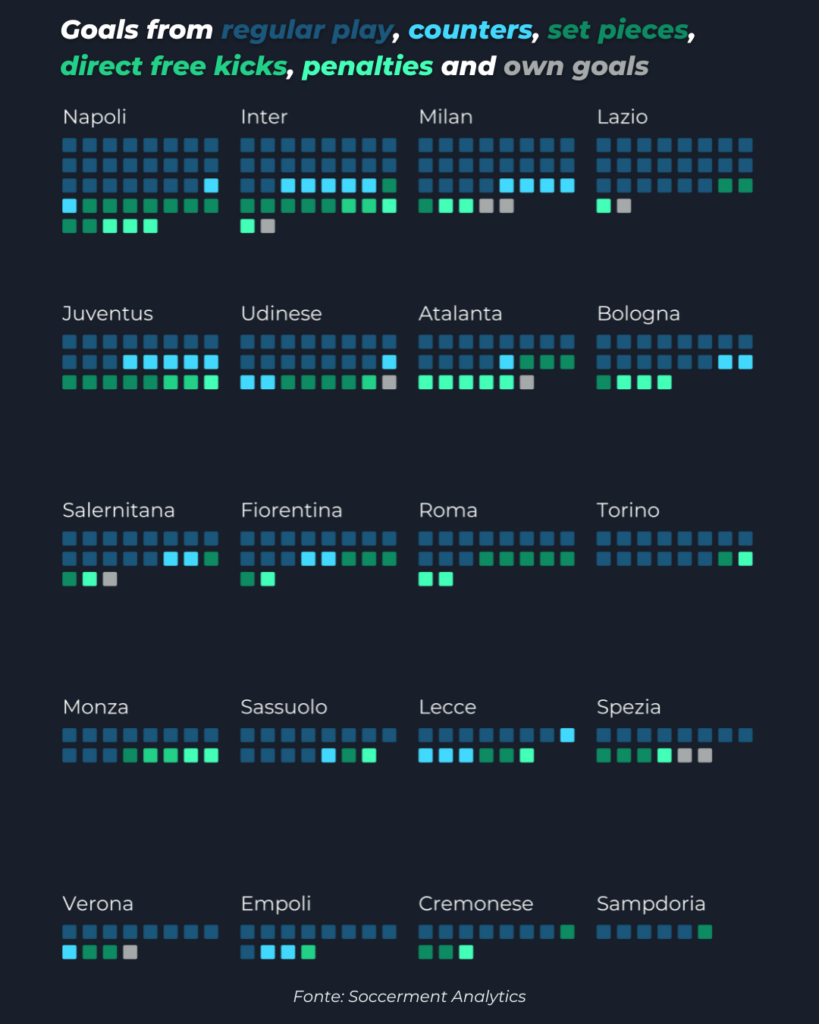
In the following graphic, we show the distribution of situations of play leading to goals for all 20 teams in Serie A, sorted by total goals scored. The team that scored a larger fraction of their goals from regular build-up play situation are Torino (87.5%). On the other end we Juventus (45.8%), Lecce (50%), Inter (52.9%) and Atalanta (54.5%). The Bergamaschi show a striking change in this number, which was top of the league at 89% last season: this is a reflection of important changes in their style of play, which we will further discuss later on. Roma (27.8%) lead the way for the fraction of goals scored from set pieces (actions originating from corner kicks, crossed free kicks and throw-ins).
Comparison with the previous season
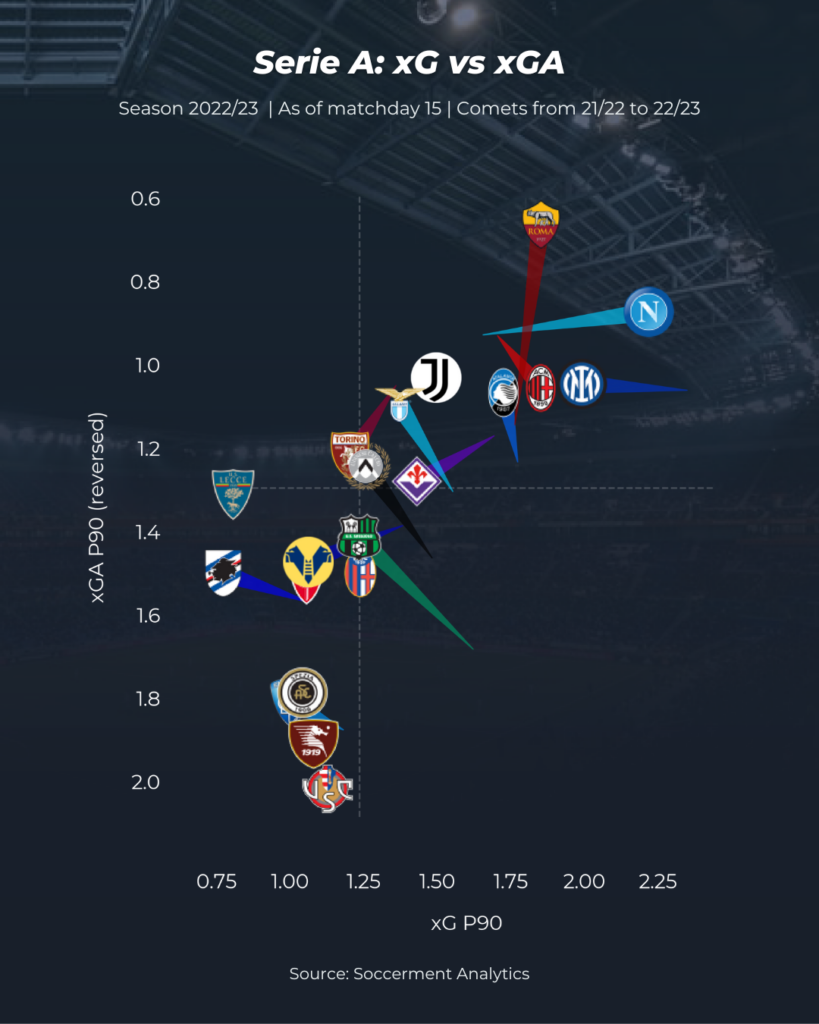
By looking at the scatter plot, we can quantify the differences in performance between the last season and the current one. Roma are among the most noticeable cases. The Giallorossi have slightly increased their offensive production (from 1.76 xG P90 to 1.85 xG P90) and massively improved their defensive performance, reducing their xGA P90 to 0.66 (the lowest value in the top 5 leagues). However, such strong performances didn’t translate into results, mostly due to a significant underperformance of xG (18 goals scored from of 27.79 xG).
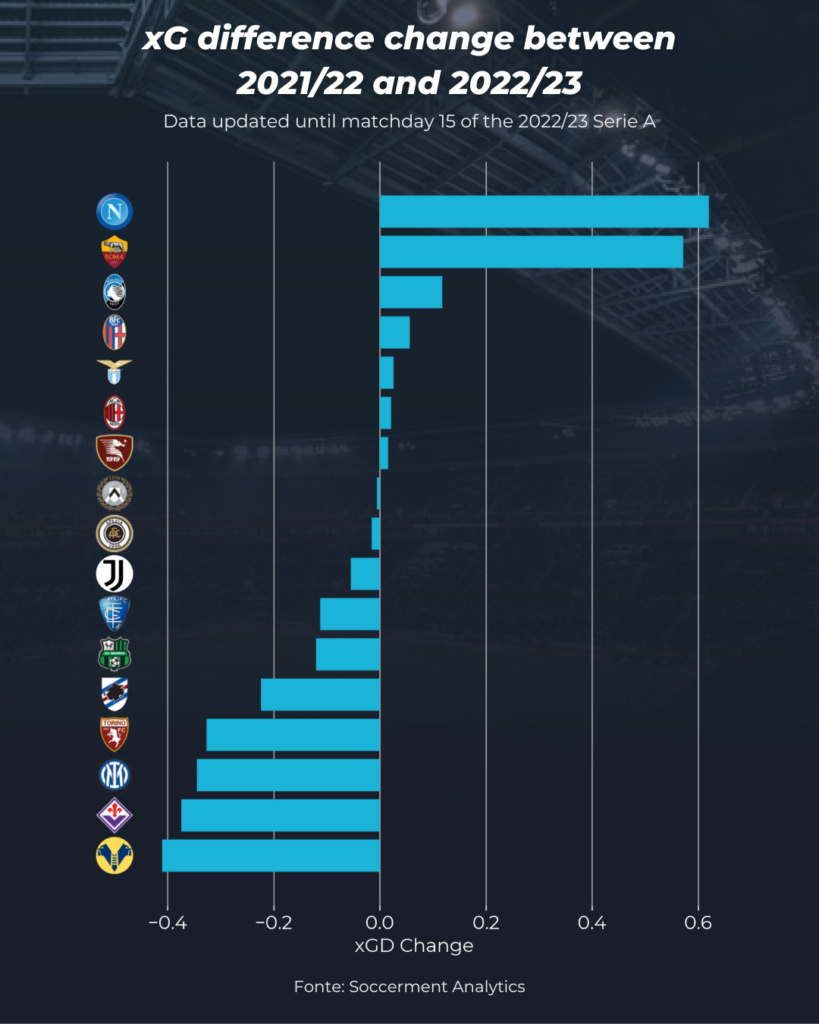
Napoli have significantly improved their offensive production from last season going from 1.65 xG P90 to 2.22 xG P90. Defensively, they have also managed to slightly reduce their xGA P90 from 0.93 xGA P90 to 0.87 xGA P90. Consequently they record the greatest change in xGD P90 (+0.63) in the league, tightly followed by Roma (+0.57). On the other hand, Verona, Fiorentina, Inter Milan and Torino are the teams who have decreased the most their xGD (-0.41, -0.37, -0.35 and -0.33 respectively).
Playing styles and tactical insights
As usual, the Serie A keeps a tradition of high manager turnovers. At the World Cup break, 4 teams have already changed their manager since the start of the season (Bologna, Monza, Sampdoria and Verona). Since the start of last season, only half of the teams have kept the same manager. This is one of the reasons behind important changes in the teams’ playing style and tactical approach.
Teams such as Atalanta, Lazio and Empoli are adopting a different defensive strategy compared to last year, with a lower defensive block and less aggressive pressing (Buildup disruption percentage, BDP). This is particularly striking for Atalanta, where Gasperini has started a whole tactical “school” based on aggressive, intense man-to-man pressing. This change in style has led the Bergamaschi to an excellent start of the season.
Verona have already changed 2 managers since last season. The departure of Tudor for Cioffi has seen the team adopt a different strategy, moving away from man-to-man marking and high pressing. Due to poor performances, the board decided to sack Cioffi to bring in Bocchetti, who seems to be adopting a style which resembles more the one seen in last season.
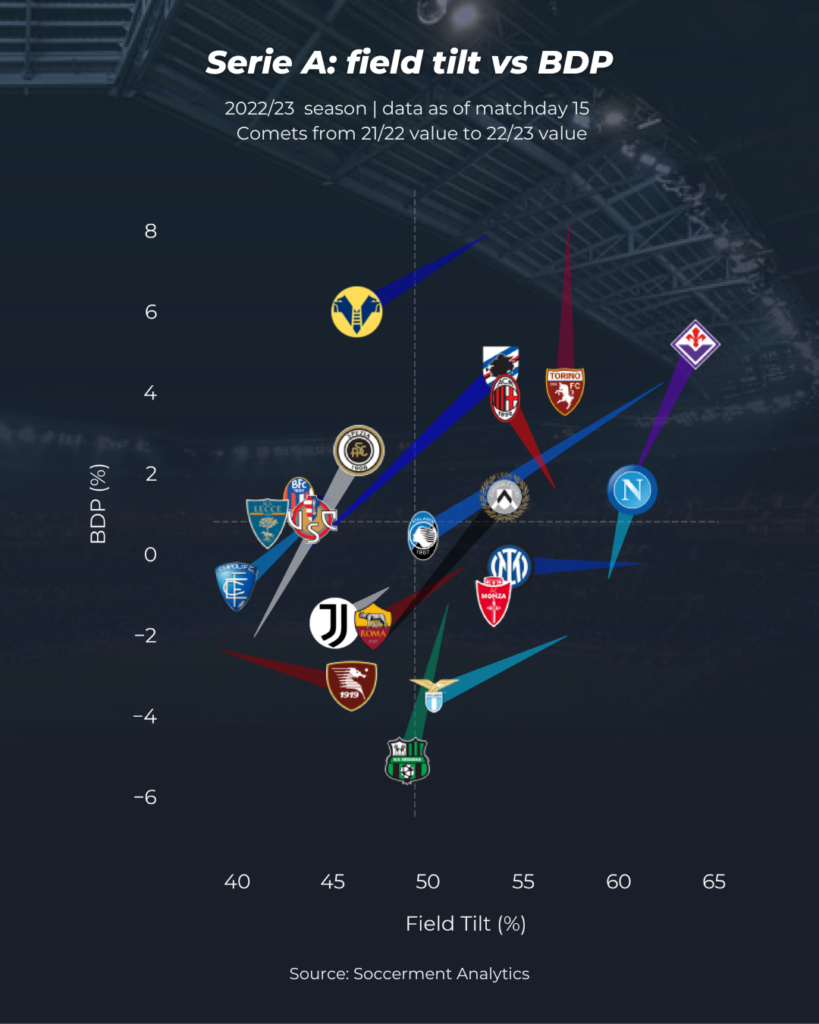
Similar trends are evidenced by other metrics such as possessions won in the attacking third (normalized by opponent touches) and the average height of defensive events.

Fiorentina stand out as the most aggressive (9.89 PPDA) and territorially dominant (Field tilt: 64.03%) team in the league. However, such an aggressive aptitude and such a high defensive line has exposed them to opposing counterattacks. Fiorentina consequently concede a very high 0.14 xGA/shot to their opponents. So, despite being the team who has conceded the least shots (136) they rank 10th for xGA (19.21).
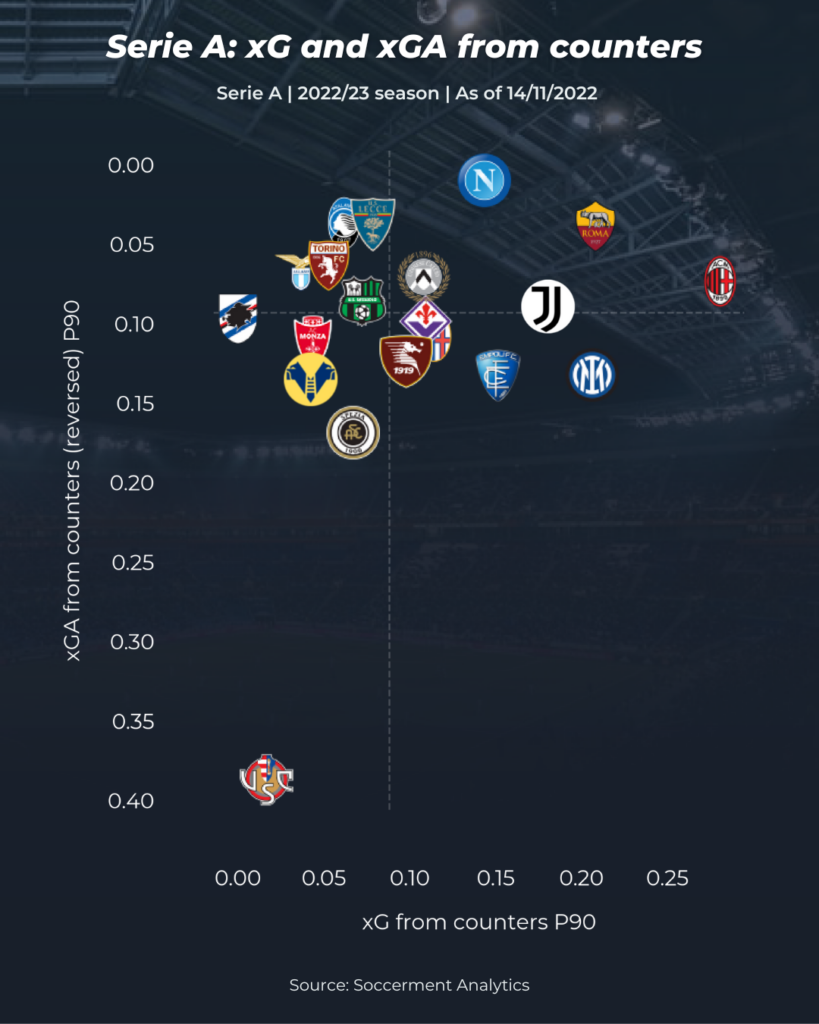
The previous graph shows the xG created and conceded from counters. Cremonese really stand out as they have conceded more than double the xG from counterattacks than any other team. On the other hand, Napoli concedes almost nothing from counterattacks (0.01 xGA P90). Also Atalanta, Lecce and Roma fare very well by conceding less than 0.04 xGA P90. Offensively, AC Milan is by far the standout team with 0.28 xG P90, their high-intensity style of play is definitely geared towards being effective during fast-breaks. Also Roma, Inter Milan and Juventus have generated significant chances from counterattacks (> 0.18 xG P90). Sampdoria is yet to shoot in counterattacking situations (0 xG).
Standout players
In terms of individual player performances, the first place to look in order to compare outcomes and underlying performances is the top scorer chart, excluding penalties.
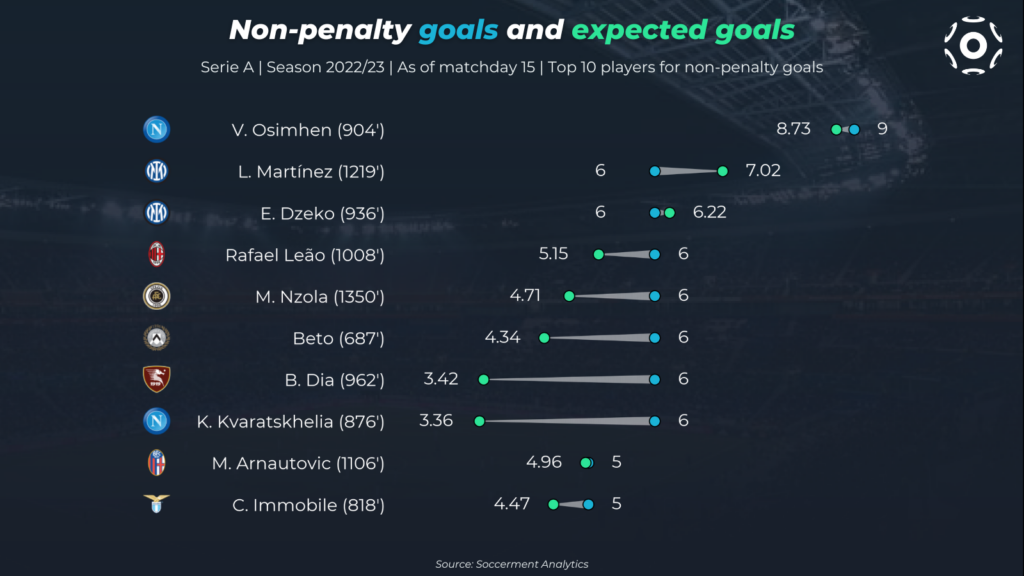
Napoli’s Victor Osimhen deservedly tops the chart, with nine goals and 8.73 npxG. Seven players are tied for second with six goals. Among them, Kvaratskhelia and Dia recorded the highest outperformance of xG: it will be interesting to see if they can sustain it throughout the season. Lautaro Martinez is the only player in the top 10 with a significant underperformance: based on his historical stats, it would be reasonable to expect his goals to end up lining up with xG by the end of the season. It is interesting to note that Roma’s Tammy Abraham does not make this list in spite of ranking 3rd for npxG (6.61), due to a strong underperformance (3 goals), which partly explains Roma’s problems in front of goal.
Looking at standout players for several metrics, we can probe finishing and direct chance creation by comparing open-play xG and xA. We can also measure secondary chance creation using Expected Threat from passes and carries, which credits dangerous actions beyond shots and direct assists. The top performers for these metrics are shown in the graphs below.
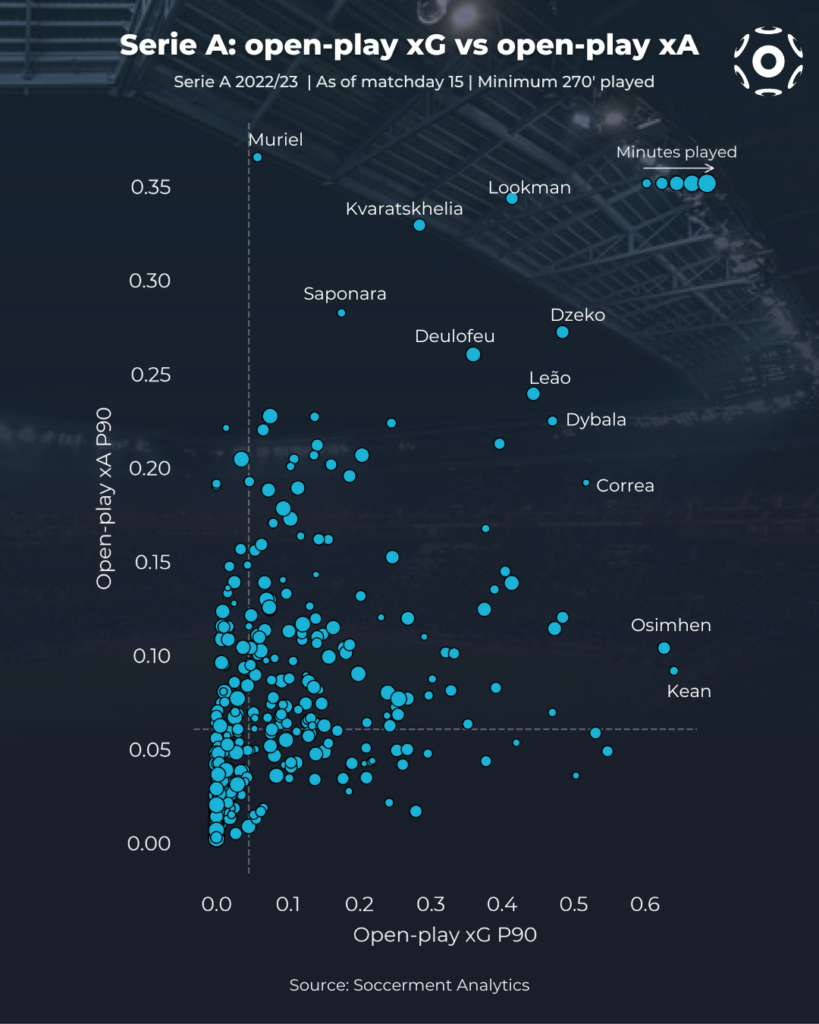
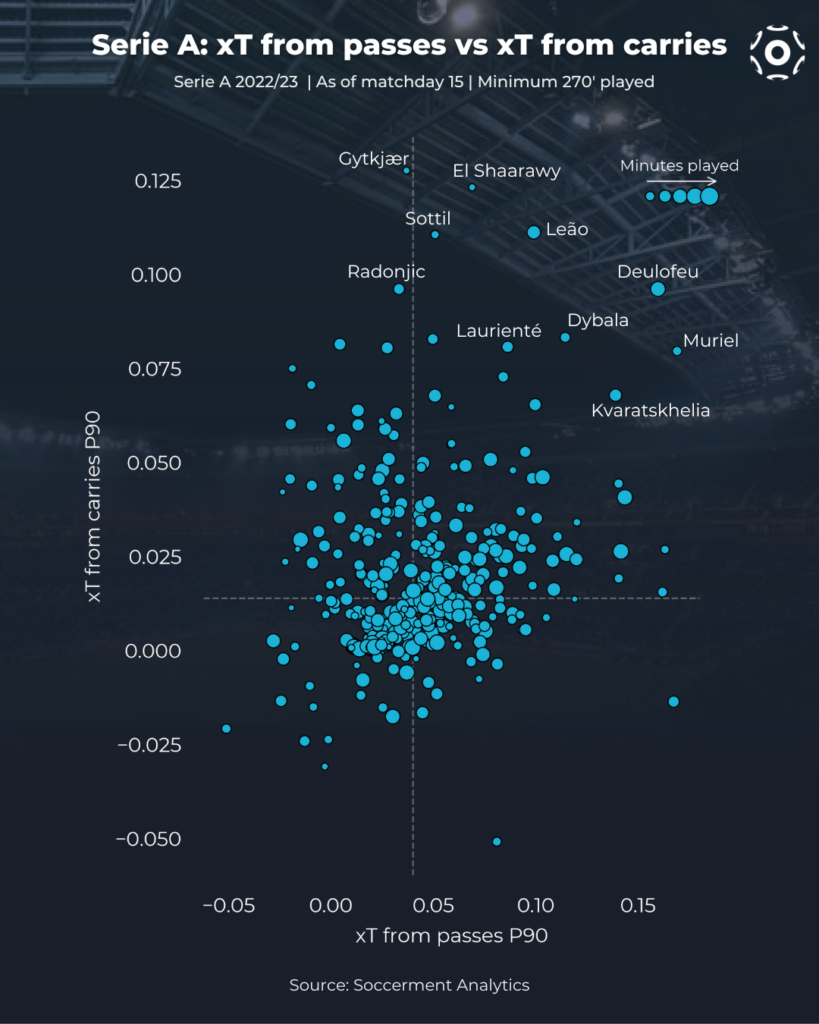
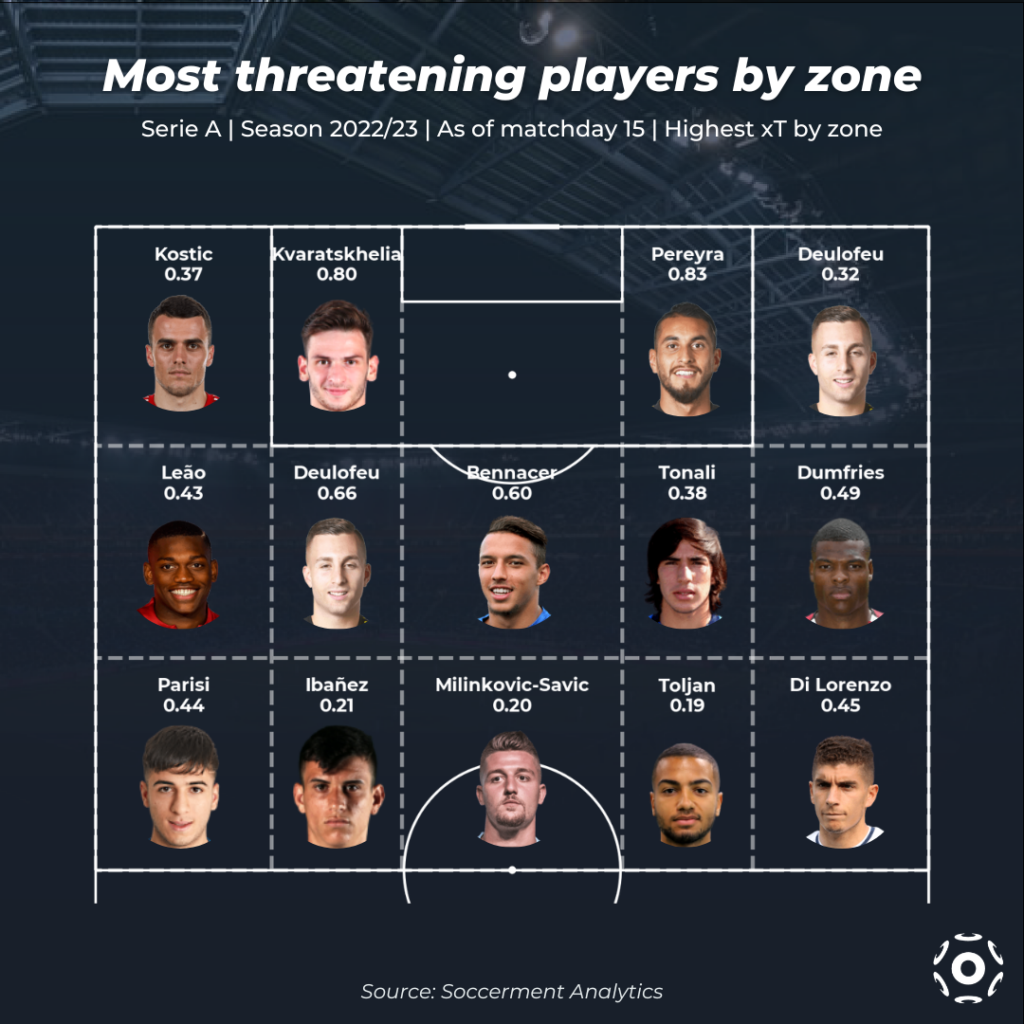
Focusing on Expected Threat, we can look at which players create the most danger from passes and carries in different areas of the pitch. Serie A rookies Kostic and Kvaratskhelia bring the most threat in advanced areas on the left flank, with the Georgian being the leading threat from the precious cutback zone inside the penalty box. Udinese’s Deulofeu is the only player to appear twice, operating across the entire attacking front. Inter’s Denzel Dumfries and Milan’s Rafael Leao dominate the wings, a testament to the Dutchman’s attacking interpretation of the wing-back role. Milan’s double-pivot of Bennacer and Tonali dominate the chance-creation zone just outside the box together with Deulofeu. In deeper zones, full-backs Di Lorenzo and Parisi come out on top in wide areas, while Lazio’s Milinkovic-Savic dominates the midfield circle.
Now we will focus on players which strongly stood out for their performances in this first part of the season.
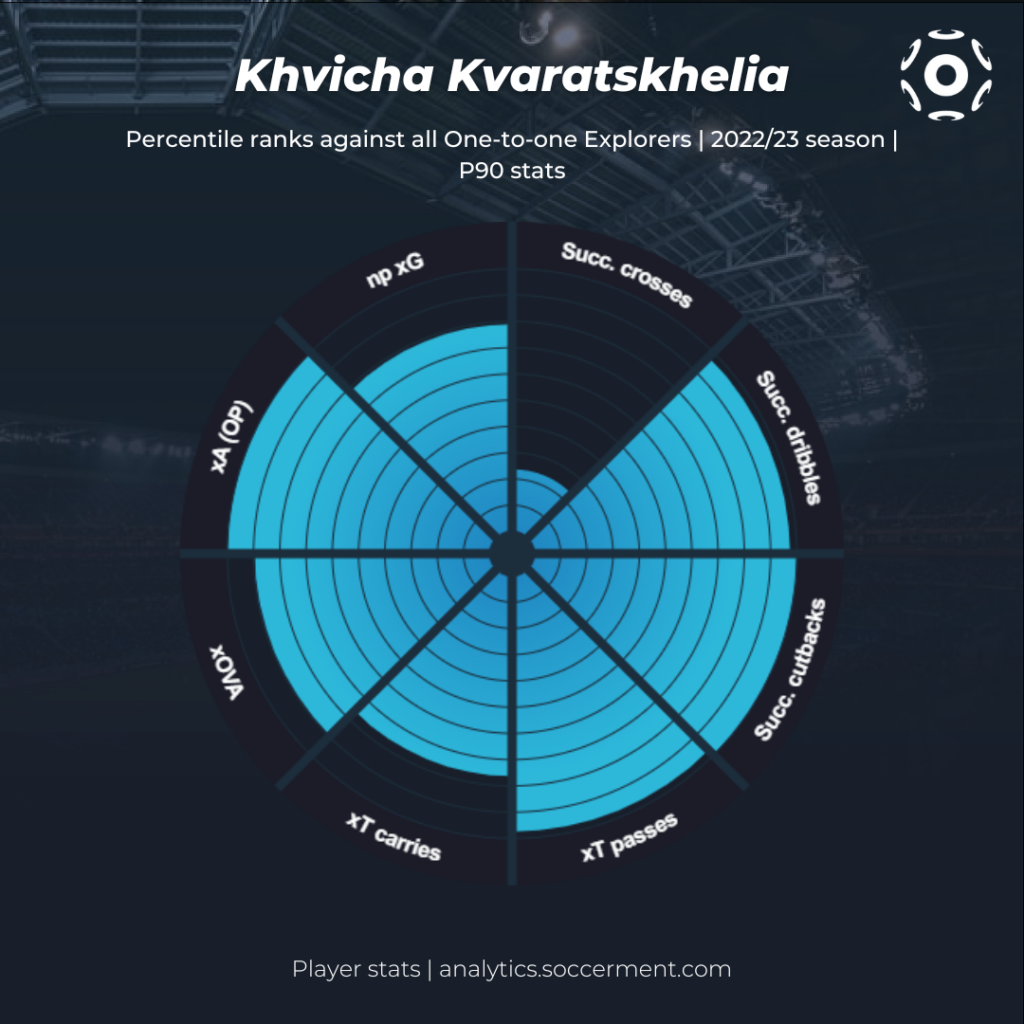
Khvicha Kvaratskhelia
The Georgian has caught the league by storm ever since his first match in August. Fast, resilient, skillful, creative, clinical and determinated are all adjectives that suit Khvicha who has been able to immediately perform at the highest level in Naples. This is reflected in his polar chart which sees him rank among the very best players of the One-to-one Explorer Cluster. Kvaratskhelia has recorded 0.33 opxA P90 (3rd in the league), 0.21 xT P90 (tied 3rd with Rafael Leão), 0.42 xOVA P90 (top 10 in the league) which are top-tier chance creation numbers. On top of that, Kvaratskhelia has considerably outperformed his xG scoring 6 goals in front of 3.36 npxG. Napoli will need him to sustain his stellar performances after the break in order to mount their title hopes.
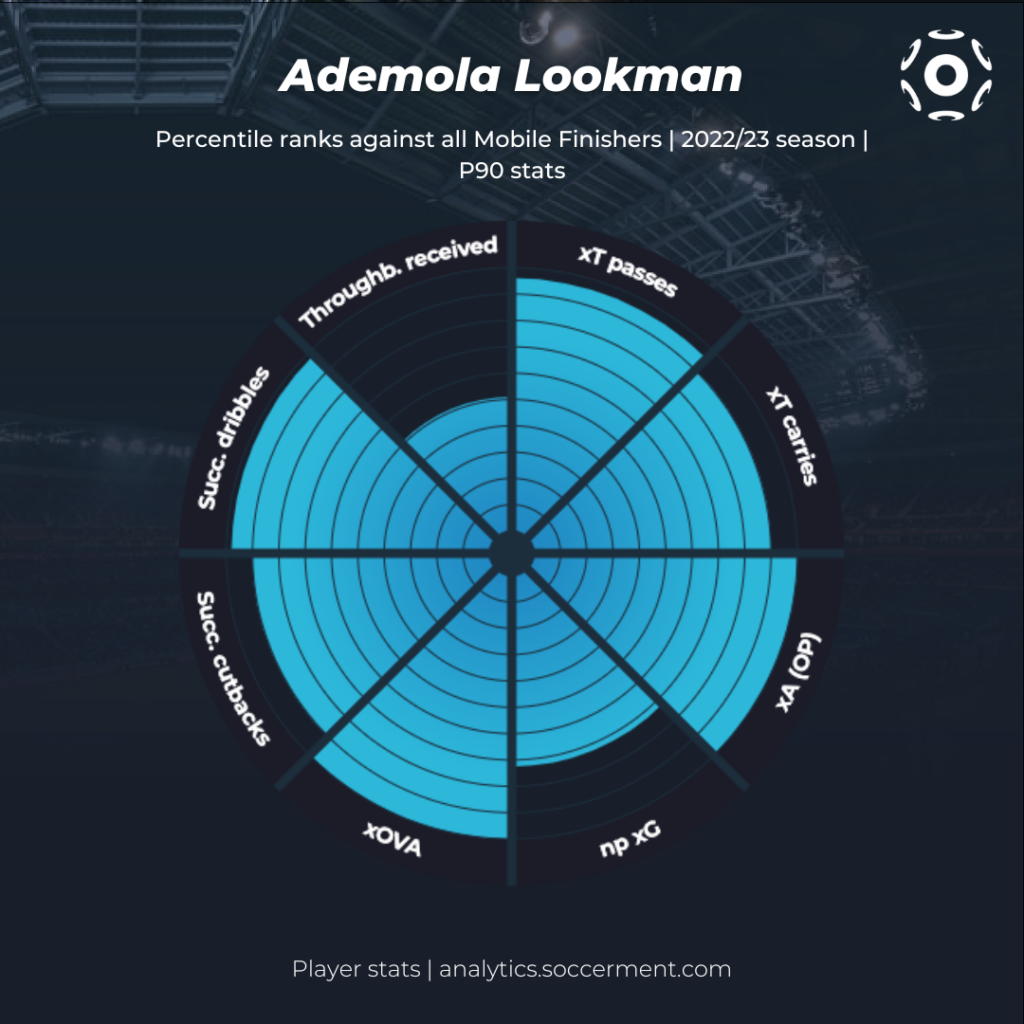
Ademola Lookman
Lookman‘s arrival in Serie A may have initally gone under the radar. However, he has quickly found his ground in Bergamo and has imposed himself as one of the most effective players in the Serie A. His underlying numbers for chance creation reflect this: 0.34 opxA P90 (2nd in the league), 0.47 xOVA P90 (3rd in the league), 0.17 xT P90 (just outside the top 10). However, Lookman has recently been Atalanta’s main goal threat and penalty shooter, racking up 5.56 xG and scoring 7 goals (5 np goals in front of 3.99 npxG). In an Atalanta side which has adopted a much more conservative approach, Lookman’s goalscoring is vital in order to challenge the other top clubs for the UCL spots.
Gerard Deulofeu
For some time Deulofeu ranks among the very top creators in Serie A. His great technique and vision allow him to create danger in many different situations. In this season, he has perhaps reached new heights ranking first in the league for xA (4.09, 0.31 P90), opxA (3.49, 0.26 P90), xTPass (2.14, 0.16 P90) and xTCarry (1.29, 0.10 P90). Consequently, he ranks first in Serie A for xT and second in the top 5 leagues (only behind Lionel Messi). He also ranks 2nd overall for xOVA (6.0, 0.45 P90) and in the top 10 for xOVA P90, to be expected given his aforementioned abilities in chance creation. The Spaniard has also gotten on the end of many chances with 5.43 npxG accumulated so far. However, he hasn’t been clinical considering he has scored just 2 goals. If he can improve his finishing and realign himself with his xG tally he could start to get the praise his performances suggest he actually desrves. His efforts have been pivotal for Udinese’s surprising start to the season.

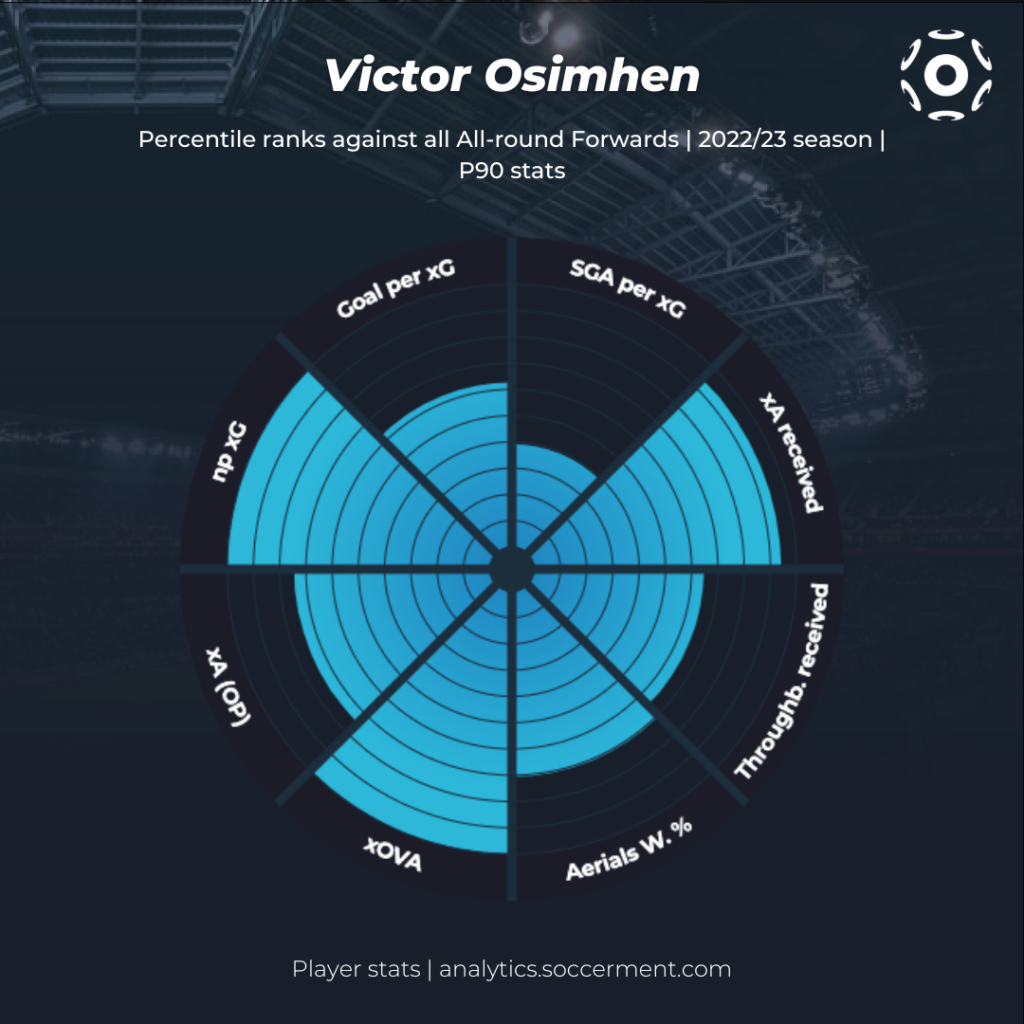
Victor Osimhen
The Nigerian striker has been in scintillating form ever since coming back from his injury. Despite having played only 904 minutes he comfortably leads the xG charts (8.73, 0.87 P90). His ability to attack the space behind the defensive line and in winning aerial duels has allowed Napoli to consistently surprise their opponents. This is why Osimhen ranks among the very best not just for npxG but also for xOVA (4.61, 0.46 P90). His first 2 seasons in Naples have been conditioned by several injuries, however, Osimhen looks now to be in great shape and seems to have taken in Spalletti’s advice, who considers him a key player for his team.
Conclusions
In this review, we look at the state of Serie A at the World Cup break, through the lens of advanced metrics, investigating both performance and playing styles.
Comparing points gained with the underlying performance, we find that Napoli is deservedly first, while Roma is registering the largest underperformance, mostly due to inefficient finishing up front (18 goals and 27.8 xG). These two sides are the ones which improved the most compared to last season according to our xG model, almost exclusively in attack for Napoli and in defense for Roma.
In terms of playing style, the most marked change with respect to last season is the one of Atalanta, who, after having established a whole tactical school based on aggressive, man-to-man high pressing, are adopting a lower defensive block and milder pressing behavior, with very good results so far. Moreover, the Bergamaschi also went from having the highest fraction of goals coming from open play to having one of the lowest values in the league.
As for individual performances, we find that Victor Osimhen is deservedly at the top of the scoring chart, and is the strongerst candidate to the Capocannoniere title this year, if he can keep up the fitness levels which have eluded him in previous seasons. Kvaratskhelia and Dia are strongly overperforming their xG, which will be hard to sustain throughout the season. The Georgian winger stands out in most attacking metrics, both for finishing (xG), direct chance creation (xA) and indirect chance creation (xT), justifying the hype that surrounds the stellar start of his Serie A career. Atalanta’s Lookman is another Serie A rookie who is having a great start of his Italian career, ranking in the top three for chance creation (opxA and xOVA) and with great numbers in terms of xT and xG as well, to support his seven goals scored. Finally, Udinese’s Deulofeu continues his top-level performances across all attacking metrics (1st for xA, xOVA, xT pass and xT carry), confirming his status as one of the most underrated creative players in the top 5 European leagues.
For any question or comment, please do not hesitate to contact us: research@soccerment.com.
Did you know that…
…we developed a smart device able to track the performances of any football player automatically? It is called XSEED and tracks both the athletic and technical performance:
- Distance covered;
- Maximum speed;
- Accelerations / Decelerations;
- Number of touches;
- Passes;
- Shots & shot power;
- Crosses;
- Soon: Expected Goals & Expected Assists