
Goalkeepers save 69% of the opponents’ shots on target, on average. The save ratios differ greatly depending on whether the shots are taken inside or outside the box (60% and 85%, respectively). This suggests that, to be relevant, the save ratio needs to be considered along with the quality of the shots faced by the goalkeepers. To do that, we use an Expected Goals model. In the top 5 leagues, the best mix of shot-stopping ability and ball distribution skills currently seems to be displayed by Alisson (LIV), Donnarumma (MIL) and Benítez (NCE).

Intro: Analysing goalkeepers
Evaluating goalkeepers has historically been harder than assessing outfield players. The main reason relates to the scarcity of the events in which the goalkeepers are the leading actors: in a football match, the average number of shots on target is around 8-9, which means 4 to 5 shots on target to be faced by one of the two “goalies”, per match. The problem of the events’ scarcity is exacerbated by two factors: i) the public’s attention is mainly on the player taking the shot; ii) until very recently, there was no record of goalkeeper actions.
In the past few years, thanks to the growing amount and granularity of football data, the contribution of analytics started to change the framework and the top goalkeepers are now seen almost as decisive as the top forwards. The recent transfer-fees paid for the likes of Alisson (from Roma to Liverpool for £66.9m) and Kepa (from Athletic Bilbao to Chelsea for £71.6m) are there to prove it.
The mainstream media, which increasingly rely on stats for commenting football matches, often talk about the goalkeepers’ “clean sheets” (i.e. matches without conceding a goal) and about the “save ratio” (percentage of saves, out of the total shots faced). These numbers do offer some insights. However, the information provided is often incomplete and/or could even be misleading.
In this analysis, we try to provide some simple tools to better evaluate goalkeepers. What we do is to put shot-quality into the equation, as we use an Expected Goal model.
Before getting there, we start with a brief description of the context in which the goalkeepers operate.
How big is a football goal?
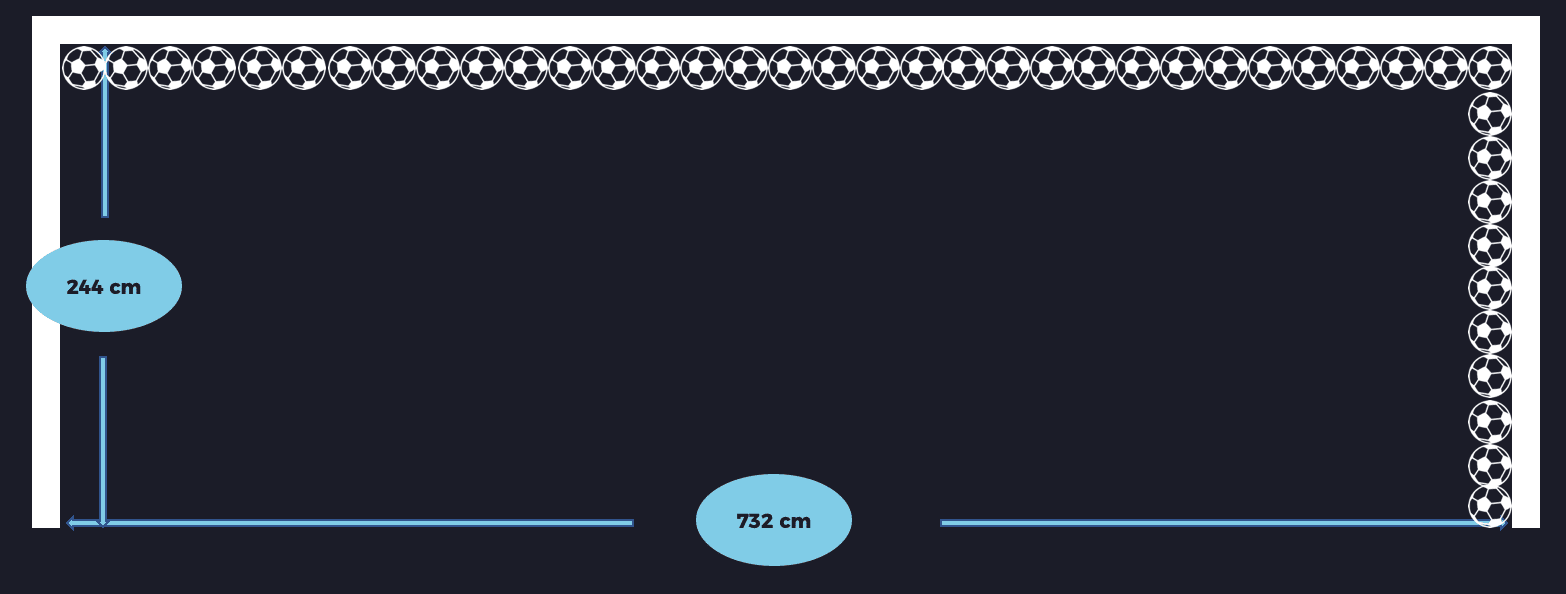
Goals consist of two upright posts placed equidistant from the corner flagposts, joined at the top by a horizontal crossbar. The inner edges of the posts must be 7.32 metres apart, and the lower edge of the crossbar must be 2.44 metres above the ground. The nets are usually placed behind the goal, though are not required by the Laws of the Game.
Goalposts and crossbars must be white, and made of wood, metal or other approved material. Rules regarding the shape of goalposts and crossbars are somewhat more lenient, but they must conform to a shape that does not pose a threat to players. Since the beginning of football there have always been goalposts, but the crossbar wasn’t invented until 1875, before which a string between the goalposts was used.
How many footballs fit in a goal? A size 5 football must have a circumference of 68 to 70 cm, which means that, on average, the diameter is about 22 cm. Therefore, slightly more than 360 footballs would fit into a goal (11 rows and 33 columns), as shown in Exhibit 1 above.
A goalkeeper covers 24% of the goal’s area
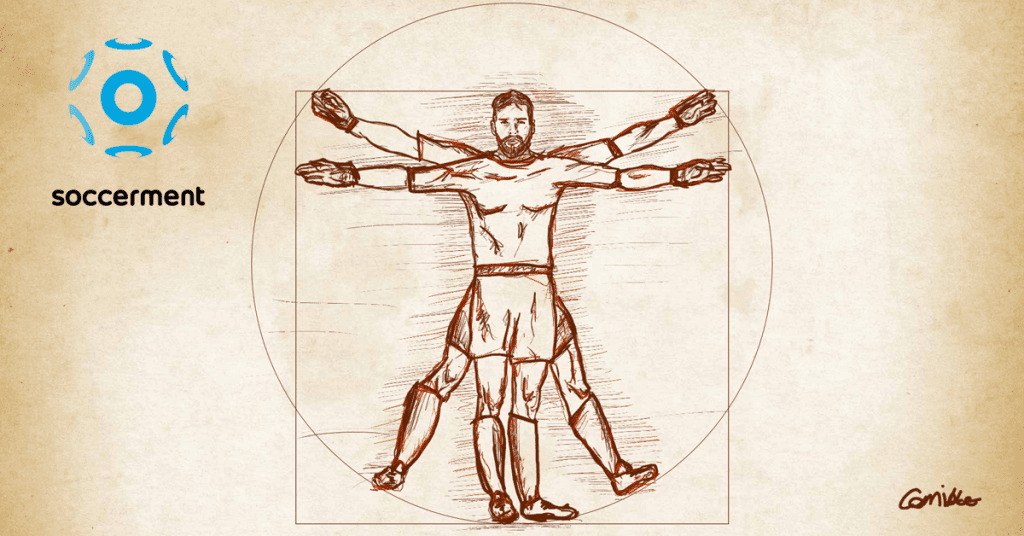
The area of a football goal is 17.7 square metres. What is the area naturally covered by the average goalkeeper, just by standing? For this purpose, we borrow the Vitruvian Man, the famous drawing made by Leonardo da Vinci around 1490:
“In the human body the central point is naturally the navel. For if a man be placed flat on his back, with his hands and feet extended, and a pair of compasses centred at his navel, the fingers and toes of his two hands and feet will touch the circumference of a circle described therefrom. And just as the human body yields a circular outline, so too a square figure may be found from it. For if we measure the distance from the soles of the feet to the top of the head, and then apply that measure to the outstretched arms, the breadth will be found to be the same as the height, as in the case of plane surfaces which are perfectly square”.
Given the height, we can calculate what is the area of the circle of the Vitruvian “Goalie”: in the Top 5 leagues, the goalkeepers have an average height of 190 cm. Therefore, their “Vitruvian circle” displays an area of 4.3 square metres, i.e. their body covers 24% of the goal’s area. This implies that 45% of the saves (69% average save ratio minus 24%) derive from positioning, agility, reflexes and the other skills required for an efficient shot-stopping.
A question for the reader: is it just a coincidence that, historically, the penalty conversion rate is 76% (100% – 24%)?
Two of the simplest ways to evaluate a GK
The easiest way to evaluate a defence and a goalkeeper is obviously to look at the number of the goals conceded. A few goals: good; many goals: bad. Easy, right? The main drawback of this “methodology” is the impossibility of distinguishing between the merits (or mistakes) of the defence and the goalkeeper.
One level above that, there is the number of clean sheets, a metric which has gained a lot of traction in the past few years. In order to specifically evaluate the performance of goalkeepers, we add a variable: the number of shots on target (‘SOT’) conceded to the opponent.
In Exhibit 2 below, we show the correlation between the SOT against (x-axis) and the number of clean sheets, all expressed on a per-90-minutes basis, to allow comparability. We filtered out the goalkeepers having played less than 1000 minutes.
The top-left corner is populated by the goalkeepers who play within rock-solid defences and/or within dominating teams: they concede a few shots on target and, consequently, they end up displaying a high number of clean sheets at the end of the season. In the bottom-right corner, viceversa, there are those goalkeepers playing within worse-than-average defences, conceding many shots on target to their opponents. They obviously finish the league with a small amount of clean sheets.
The two quadrants that interest us here are the ones on the top-right corner and on the bottom-left corner of the chart. In the green box, we have the outperformers: the goalkeepers who, despite receiving an above-average amount of shots on target (>4.36 P90), are able to accomplish an above-average number of clean sheets (>0.28 P90). At the other edge of the spectrum, in the red box, there are the underperformers.

Among the outperformers, we highlight the Swiss Yann Sommer (30 year-old), who plays in the Bundesliga with Borussia M’gladbach. Sommer has played 2160 minutes so far, recording 10 clean sheets in total (0.42 P90), while he had to face 4.67 shots on target P90, saving 73.2% of them. These stats grant him a Soccerment Performance Rating (‘SPR’) of 62, the third-highest for a goalkeeper, in our database.
The number of saves, out of the total shots on target against, is what we call the save ratio. It is a useful metric when evaluating a goalkeeper, but needs to be read carefully: not all shots were born equal. Thus, not all saves have the same level of complexity.
Evaluating goalkeepers using the Expected Goals
The save ratio, as aforementioned, is a useful but incomplete tool to evaluate the performance of goalkeepers.
A team might concede high-quality chances to their opponents, making it hard for goalkeepers to save the resulting shots (the goalkeeper would display a low save ratio). On the contrary, a well-organised defence, which creates density in the box, could leave to their opponents mostly low-quality chances, such as shots from outside the penalty area (the goalkeeper would show a high save ratio).
Expected Goals help us solving this problem, adding the quality of the conceded chances to the equation.
What we do is looking at the average xG (‘Expected Goal’) per shots on target against. Note that we don’t look at all the shots taken by the opponents, but only the ones that the goalkeepers actually had to face. We compare that number to the save ratio.
Normally, a higher xG per SOTA (shots on target against) results into a lower save ratio and viceversa. The reason is clear: a higher-than-average xG per SOTA corresponds to a shot on target taken by a more favourable position, thus being more difficult for the goalkeeper to save it.
There are, however, positive and negative outliers, which are displayed in the green and red quadrants of the Exhibit 3 below.
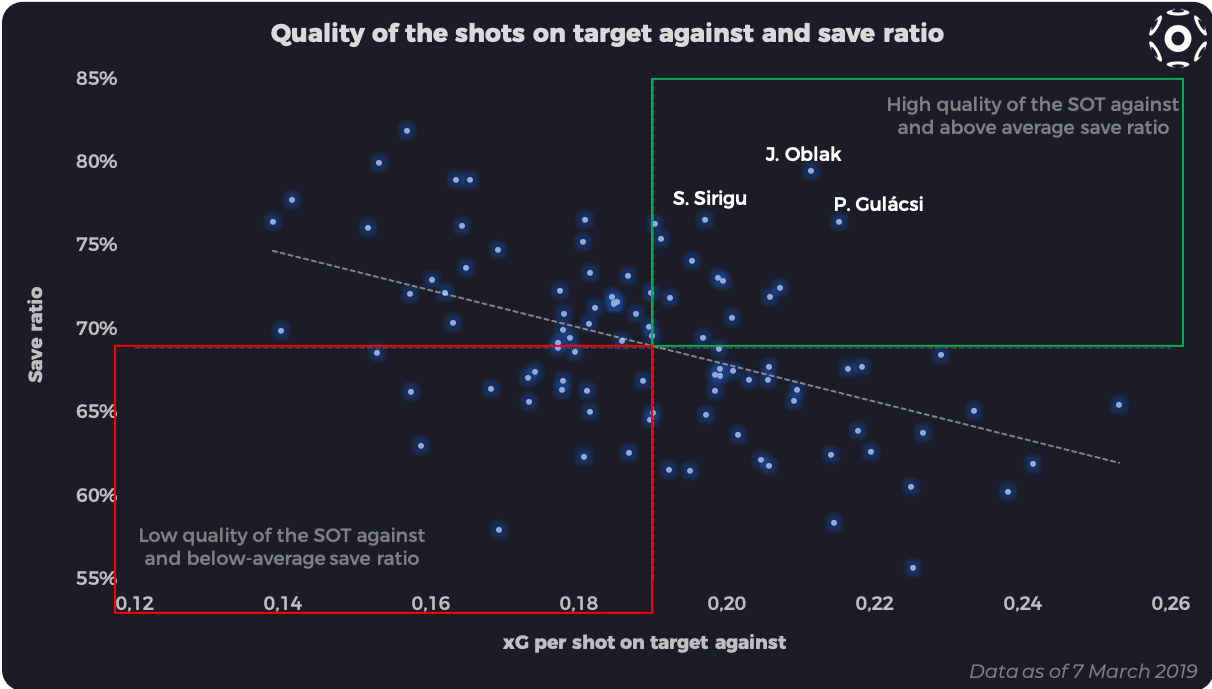
Atletico Madrid’s Jan Oblak comes up as the main outperformer. He displays a save ratio of c.80% despite an xG per SOTA of 0.21 (vs 0.188 average). However, we also highlight Torino’s Salvatore Sirigu and RB Leipzig’s Péter Gulácsi.
We could go up by another level of sophistication, though, by looking at the xG-adjusted save ratio, i.e. the ratio of the xG-weighted saves on the xG-weighted shots on target against. We reserve the numbers to our Conclusions, namely to the Exhibit 5 below. This displays that ratio together with pass accuracy, a metric which – for goalkeepers – mainly indicates how often the player is involved in the build-up, a feature which is becoming increasingly important for those teams willing to start their build-up from the back.
The increasing importance of the distribution abilities
The goalkeepers are more and more often involved with their teams’ build-up phase. A good foot-work has therefore become part of the main technical abilities in a goalkeeper’s skillset.
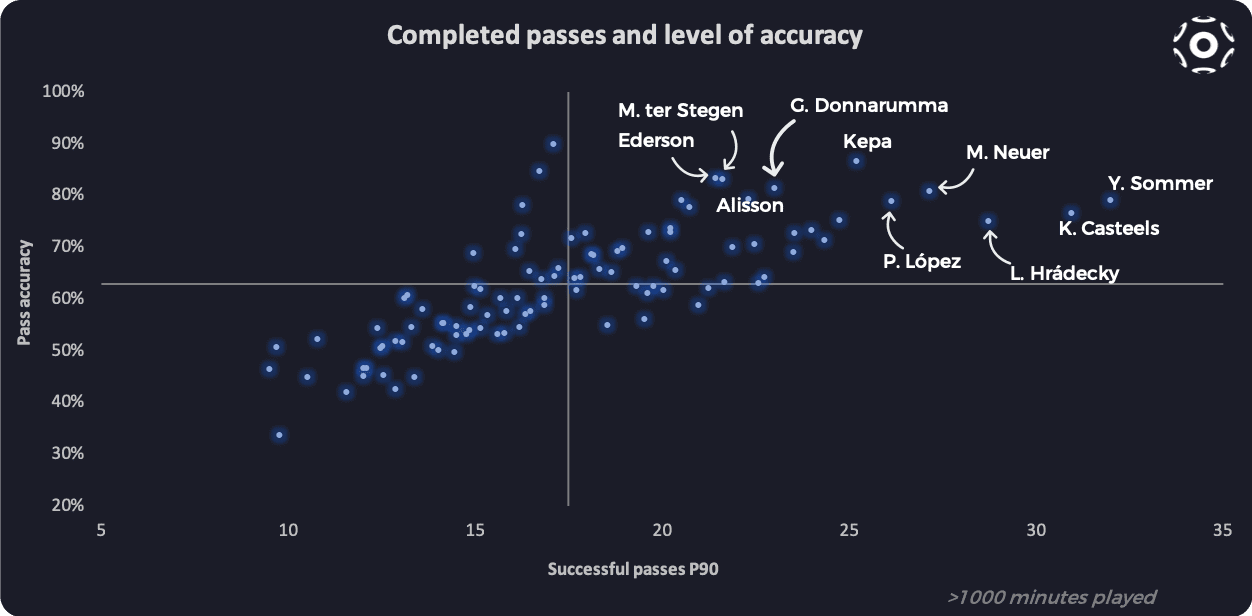
In Exhibit 4 below, we show the goalkeepers in the top 5 leagues who are, at the same time, more involved and more accurate at passing the ball to their teammates.
Apart from “the usual suspects”, i.e. Neuer, ter Stegen, Ederson and Alisson, the chart highlights AC Milan’s Donnarumma, Chelsea’s Kepa, Yann Sommer (again) and the former Belgian wonderkid Koen Casteels (Wolsfburg).
Conclusions
The save ratio per se doesn’t offer much insights. It needs to be put in context, specifically with the quality of the shots faced by the goalkeepers.
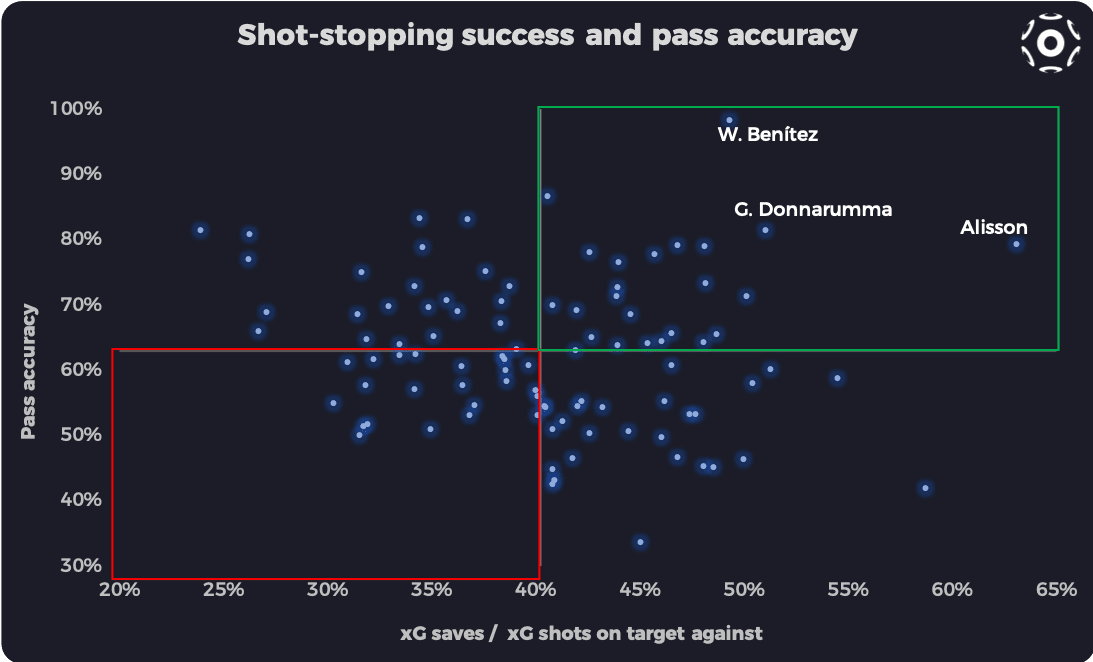
As aforementioned, here below (Exhibit 5) we display an xG-adjusted version of the save ratio. We show it in one chart together with the pass accuracy levels of the goalkeepers of the top 5 leagues.
In our view, the shot-stopping ability of a goalkeeper can no longer be considered without the ability to participate in the team’s build-up.
As we did with the previous charts, we divide it in four quadrants. The green one comprises the goalkeepers displaying above-average shot-stopping abilities, expressed by the xG-weighted save ratio and above-average passing abilities.
In this box, we highlight three names: Walter Benítez (25, Nice), Gianluigi Donnarumma (20, AC Milan) and Alisson (26, Liverpool).
According to the xG-model, Alisson has saved shots carrying 7.14 Expected Goals, out of the total shots he faced, which carried 11.3 Expected Goals. Liverpool, also thanks to Alisson’s direct involvement with shot-stopping, has conceded 6.7 fewer goals than the xG model would have predicted.
Best way to stay in touch? Like our Facebook page or follow us on Twitter.
For any query, suggestion or comment, you could send us an email: research@soccerment.com.
If you like our “iconic” images, you should check out this Instagram account: iconic_cool_people.