

In this second post of our trilogy on ball possession, we expand the analysis we started in the first part, digging into the build-up habits of the top European teams. We propose the ratio of passes on total touches, as an indicator of “good football”. Napoli are topping the tables on this measure. Man City are the European team doing the most ball touches in the opposition’s third, confirming that Guardiola does not aim at “possession for the sake of it”.

Positional Play and ball possession
The cover image of this post is dedicated to Pep Guardiola and Maurizio Sarri, who are currently two of the top evangelists of Positional Play, which has the control of the ball as one of its main characteristics and targets.
Positional Play (“Juego de Posición”, in Spanish) is mainly related to Johan Cruijff, although it was first developed at Ajax by the Englishman Jack Reynolds and then by Rinus Michels, who exported the “totaalvoetbal” to Barcelona.
As the name ‘Positional Play’ suggests, it is mainly based on the recognition of positional references, by which a team is able to constantly maintain structures that make orderly processes possible.
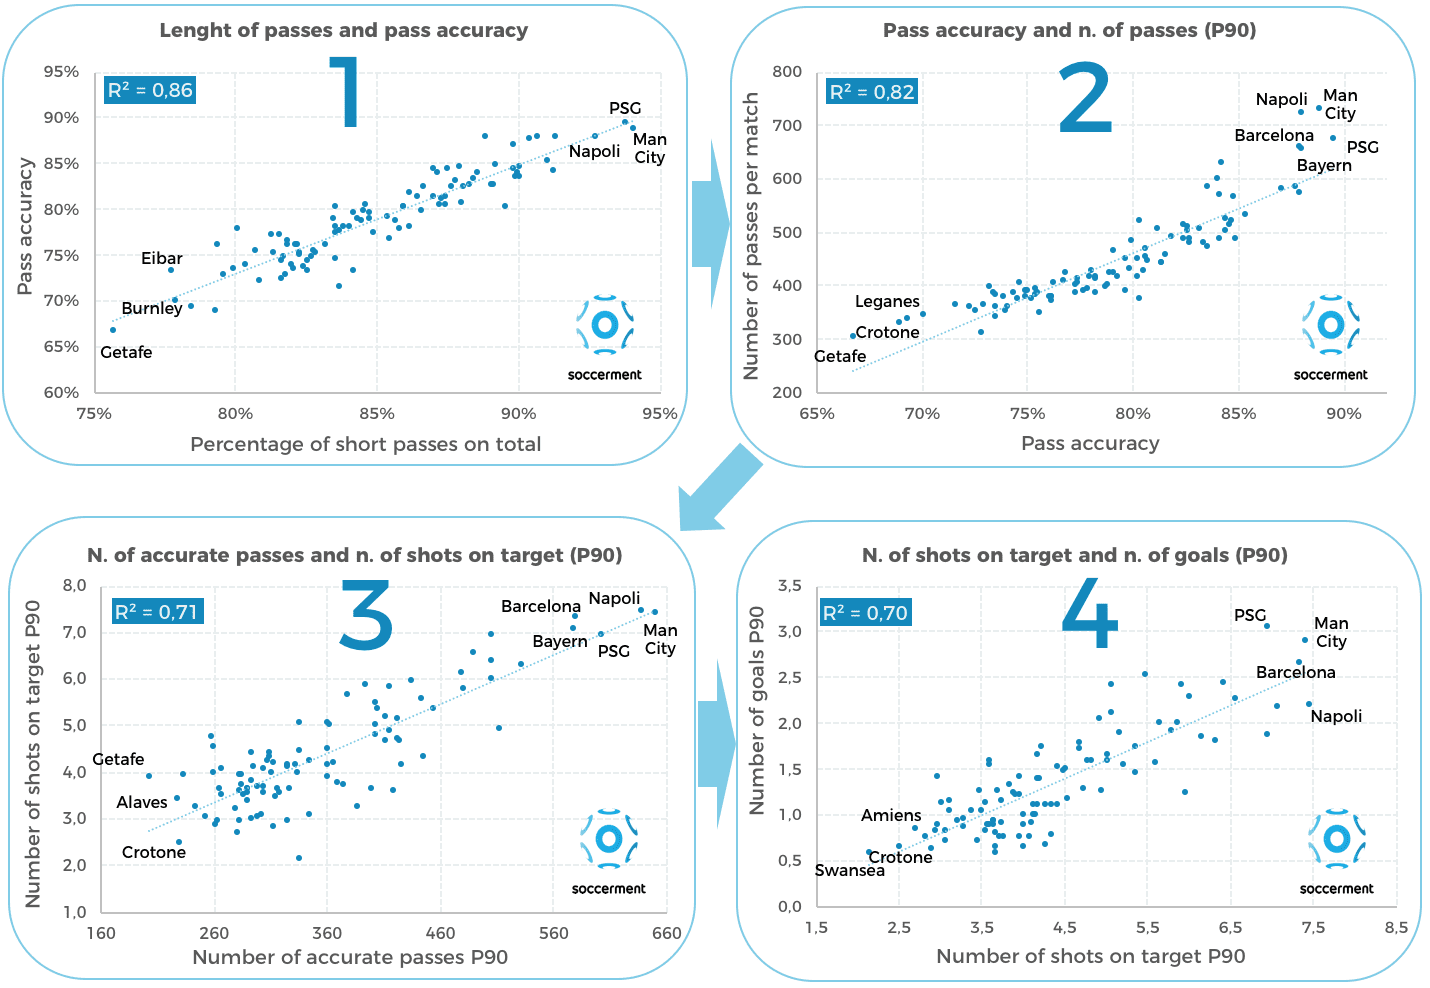
As we anticipated in our first post on ball possession, a good positioning (in the data, reflected in the percentage of short passes* on total) plays a big role on pass accuracy, which is correlated with the number of passes a team is able to accomplish.
We also showed that the number of passes is positively correlated with the number of shots on target and, ultimately, with the number of goals. We retrieve here below the “possession-to-goal chain“. It is composed of four correlations, linked to each other, which should show that, over a season or so, a team’s ability to produce a fluid build-up positively influences their results. It seems to validate the recent focus that many European clubs have put on ball control.
*Note: According to Opta, short passes means shorter than 25 yards (<22.9 metres).
Passes on ball touches: an indicator of “good football”?
Defining what ‘good football’ is and what is not, is clearly a subjective exercise. As they say, “beauty is in the eye of the beholder”.
However, a fluent build-up is normally appreciated and accepted as “good football”. Further, as we saw in the first part of our trilogy on ball possession, being able to pass the ball precisely and fast is an effective tool: the more a team moves the ball, retaining possession, the higher their chances to disorganise the opponents’ lines and exploit attacking opportunities.
One way to increase such efficiency, is to move the ball fast. To do so, being able to pass it with as few touches as possible, is key.
We looked at how many touches it takes, to the teams of the five European major leagues, to pass the ball. On average, in Europe, the number of passes represents around 30% of total touches. Basically, for every 3.3 ball touches, there is one pass.
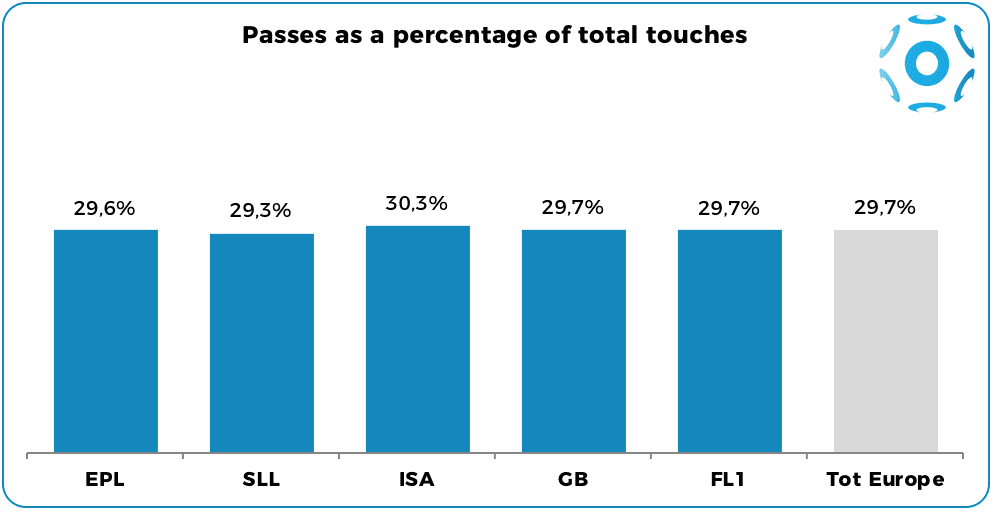
From the chart above, we see that the Italian Serie A displays a (slightly) higher ratio of passes on total touches (30.3% vs 29.7% average). The differences between the leagues are kind of minimal, anyway. Interestingly though, the Spanish La Liga, where ‘tiki-taka‘ was born, shows the lowest ratio.
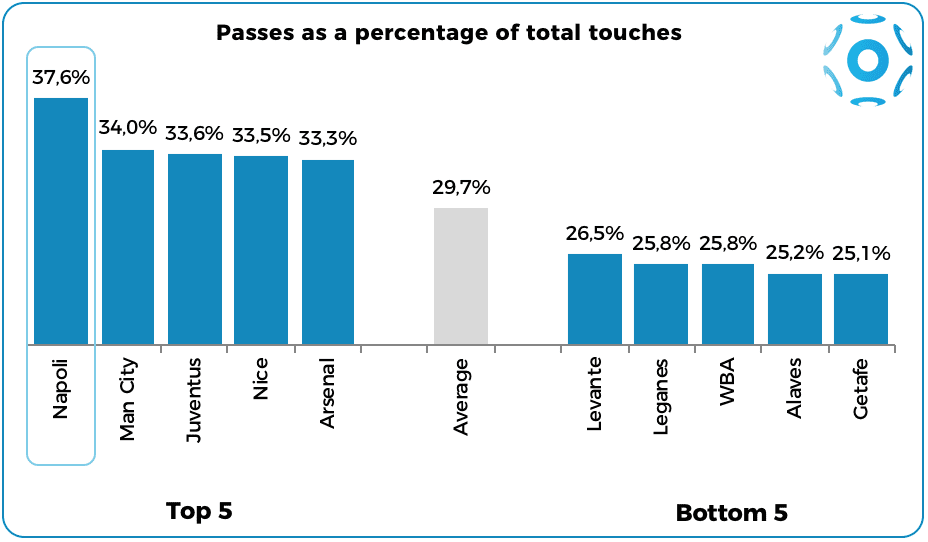
In chart 3 below, we show the 5 teams displaying the highest ratio of passes on total touches in Europe, as well as the 5 teams with the lowest ratio.
It is surprising to see the country of tiki-taka not being represented, not even by Barcelona, in the top 5 teams on this measure. On the contrary, there are four Spanish teams (Levante, Leganes, Alaves and Getafe) showing among the lowest ratios.
Most notably, on this measure, Napoli is in a totally different league compared to any other team in Europe. They pass the ball every 2.65 touches (passes represent 37.6% of total ball touches).
Is Napoli’s football particularly appealing? We believe it really catches the eye. Is it effective? Well, Maurizio Sarri’s Napoli are among the teams collecting most points per match in Europe, scoring the most and conceding the least, so it seems it is quite effective as well.
Talking about Napoli, Pep Guardiola said: “They are perhaps the best side I’ve faced in my career… I am in love with Napoli, with the way they make short passes and they didn’t give us time to think in the opening 20 minutes. We didn’t have the courage to play”.
Here below, we insert the Vimeo video of one of the most iconic goals scored by Napoli this season (2017/18): all eleven players touch the ball before Hamsik scores against Cagliari in the Italian Serie A.
Napoli touched the ball 39 times in total, including 19 passes and the final shot by Marek Hamsik. The ratio of passes on total touches stood at 48.7%. Impressive.
It is WHERE you touch the ball that really matters
A team playing piggy-in-the-middle in its own third would finish a match completing many passes, but scoring no goals and, probably, conceding some. This tells us that the number of passes, by itself, cannot really identify how successful a team is.
More important than the number of passes, or ball touches in a match, is therefore where on the pitch a team touches the ball. On top, we argue that the speed at which the ball is moved between the opposition’s lines is also key.
Dividing the football pitch with three hypothetical lines, we separate a team’s own third, the middle third and their opposition’s third.
Any team’s aim should be to remain in the opposition’s third most of the times, clearly. So, which are the best teams at doing that?
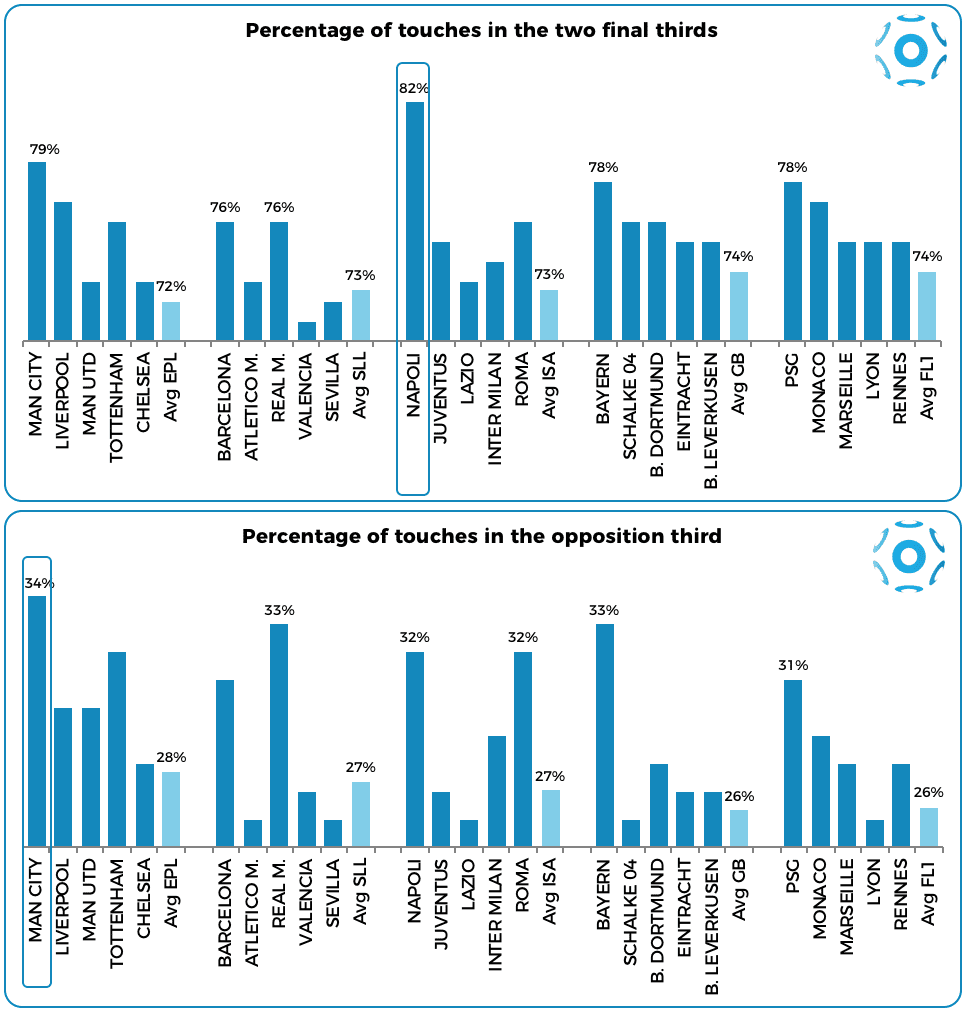
We looked at all the stats related to the European major leagues. In the chart below, we show the data related to percentage of ball touches in the two final thirds (middle third plus opposition third) and the stand-alone percentage of touches in the opposition third. The bars are ordered subject to the teams’ current league ranking. We show the top ranked teams in each league and the league total average. If you wish to have the numbers for a team not appearing there, do not hesitate to ask us (research@soccerment.com).
On the first metric, Napoli again comes up as the top team in Europe. On the second metric, probably unsurprisingly, Manchester City comes on top: Guardiola’s Man City is the team in Europe touching the ball most often in the opposition’s third.
Attacking from the central area or from the wings?
Another interesting feature we analyzed is where the attacks normally come from. The data provided by Opta and showed by WhoScored.com, offer some insights on the patterns that the team usually keep for their build-ups. We will develop this analysis through a video in part 3 of this trilogy, which we will publish in the next few weeks.
There are teams normally attacking from the right wing, others from the left wing. Others, instead, use the central area of the pitch more often than their competitors.
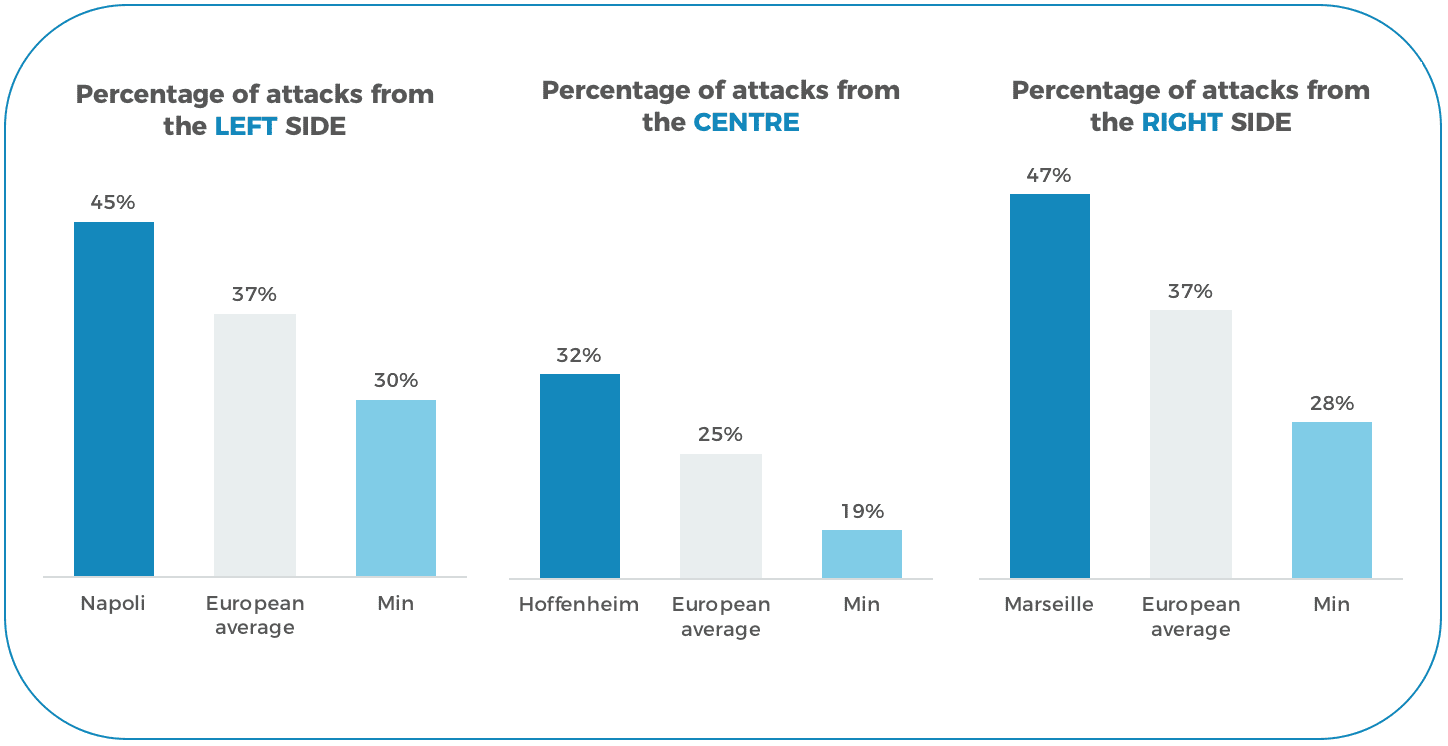
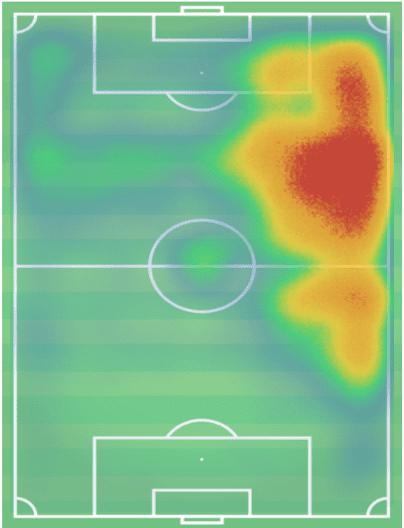
Napoli attack from the left flank
Two European teams stand out for a much higher-than-average percentage of attacks from the left wing. Both teams play in the Italian Serie A: Napoli and Lazio, displaying a 45% and 44% percentage of attacks coming from this side, respectively.
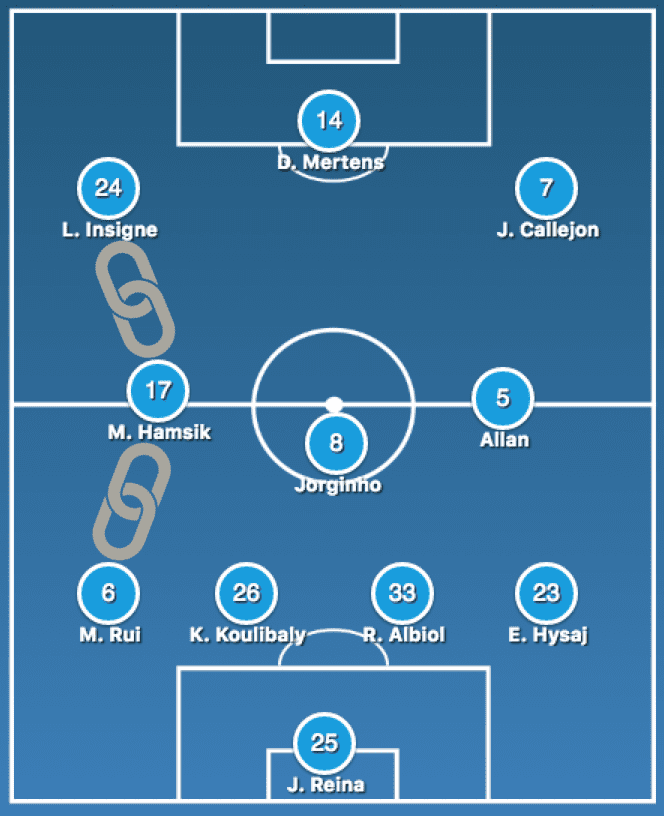
Napoli, which plays with a 4-3-3 formation, has indeed the habit of working the ball with the left-chain (Mario Rui – Hamsik – Insigne). From the data, we see that Napoli’s left chain normally completes 50% more passes per match than the right-chain (Hysaj – Allan – Callejon): 225 passes vs 147. What normally Napoli does is, indeed, manouvring the ball from the left and look for Callejon’s fast cuts from the right, inspiring Insigne’s throughballs or crosses.
Right-wing driven attacks: Marseille
Marseille, playing in the French Ligue 1, really stands out as the European team attacking the most from the right wing. Marseille use a 4-2-3-1 formation, with the right chain represented by Sakai, Anguissa and Thauvin. They exploit the corridor on “la droite” 47% of the times. Why is that? It has mainly to do with the influence of one player: Florian Thauvin (to whom we will dedicate an ad-hoc post pretty soon).
Thauvin has already scored 16 times and provided 10 assists in the ongoing French Ligue 1. He makes 46 passes per 90 minutes, in line with his right-chain colleague Anguissa and 22% more than the Japanese right back Sakai. In total, Marseille’s right chain makes 128 passes per match, 11% more than the left chain, composed of Amavi, Luiz Gustavo and Ocampos. Moreover, the right chain provides 3.7 key passes per 90 minutes, two more than the left chain (1.7).
Central attacks: Hoffenheim
European teams attack way more from the flanks (37% of the times for each side), clearly because attacking from the central area of the pitch is more difficult: much less available space. That is why central attacks amount for one-quarter of total, on average.
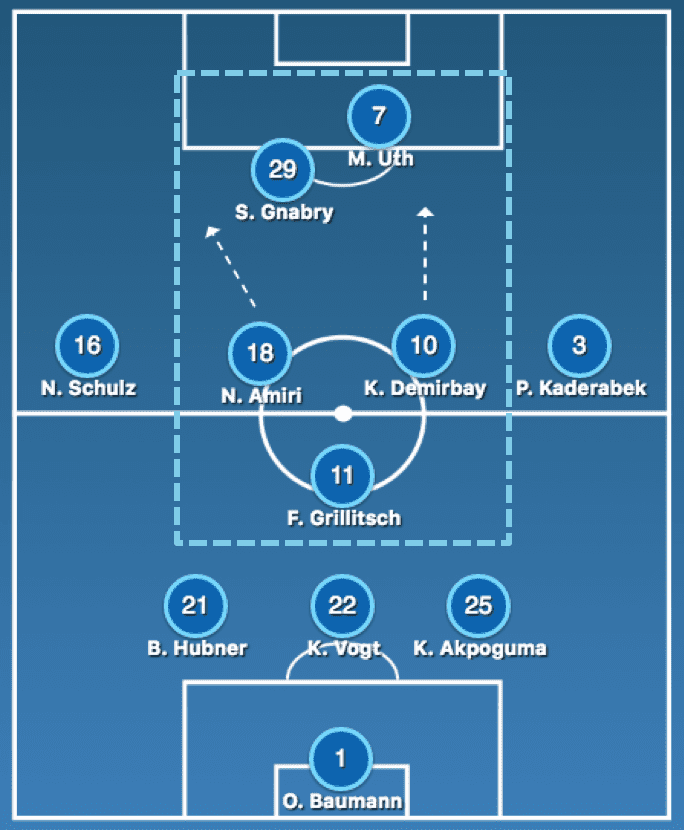
There are a few teams well exceeding the 25% average: Chelsea, Bayern Munich and Mainz 05 attack from the central area around 31% of the times. The team using the central area the most, however, are Hoffenheim, currently seventh in the German Bundesliga, attacking 32% of the times from the centre.
This has to do with their tactical formation and approach: the young Julian Nagelsmann (30 years old, record-breaker in 2016 as the Bundesliga‘s youngest permanent head coach ever) uses a 3-1-4-2, with a high density in the central areas, exploiting fast counter-attacks. Furthermore, Hoffenheim shoot from out of box way more often than the other top German teams: 43% of the shots are taken outside the penalty area vs 35% average for the top six teams in the Bundesliga.
The 15-pass build-up rule
Ball possession, as Pep Guardiola explains in the book “Pep Confidential” (by Martí Perarnau), should not be done just for the sake of it. In the book, which describes the first year he coached Bayern Munich, Guardiola is quoted stressing over and over again how much he dislikes tiki-taka. Ball possession needs to be done with an ultimate objective in mind. He says: “It’s not possession or one-touch passing that matters, but the intention behind it. The percentage of possession a team has or the number of passes that a group or an individual makes is irrelevant in itself. What’s crucial is the reason they are doing these things, what they are aiming to achieve and what the team plans to do when they have the ball. That’s what matters!“.
This concept is underpinned by Manchester City’s stats regarding the area of the pitch they carry ball possession: Man City are, in fact, the team in Europe touching the ball in the final third the most.
In the book, Guardiola also explains the 15-pass build-up rule: “Having the ball is important if you are going for 15 consecutive passes in the middle of the field in order to maintain your shape, whilst at the same time upsetting the opposition’s organisation. How do you disorganise them? With fast, tight, focused passing as part of this 15-move sequence“.
It almost sounds like the perfect description of what Napoli did in the goal against Cagliari. A patient, but fast, buildup made of one-touch or two-touch passes. Napoli’s players seem to know exactly where to find each other, until Cagliari are disorganised. Insigne finds space between the lines and Hamsik finalises it. Goal.
Credit: The data for this post were sourced from Foxsports and WhoScored.com; the line-ups were built with buildlineup.com; the heatmap is sourced from Wyscout.
For any query, comment or suggestion, do not hesitate to send us an email: research@soccerment.com.
Comments
One response to “Ball possession in European football (part 2)”
[…] di giocatori, indagini numeriche, ricostruzioni storiche rispetto all’evoluzione del gioco. In un articolo pubblicato due giorni fa, c’è la spiegazione teorica del paragone diffuso tra il gioco del […]