

Gegenpressing, or counterpressing, is now a well-established strategy in many possession-based teams. To capture this aspect of the game, we introduce a new metric, called Gegenpressing Intensity (GPI), which measures the fraction of times a team immediately attempts to regain the ball after losing possession in attacking areas, rather than falling back. We find that GPI correlates with territorial dominance (Field tilt) and pressing efficiency (BDP). We also find evidence that teams tend to counterpress less aggressively when winning. Looking at league seasonal averages, we see that counterpressing is a rising tactical trend, with GPI going up in the top European leagues during the past six seasons (Premier League e Bundesliga show higher GPI vs other leagues). With the implementation of GPI and its framework in Soccerment’s analytics platform, we provide the first set of counterpressing metrics available in a public space.
SAVE THE DATE | 3rd January 2023 – 18:30 CET | Presenting the new metric GPI (Gegenpressing Intensity) in a LIVE STREAMING EVENT | Reserve your spot (FREE) on Eventbrite at THIS LINK.
New metric: Gegenpressing Intensity
Pressing has become a key strategy for many successful teams in modern football. Measuring this component of the game has always been a challenge within analytics based on event data. We have tried to address this challenge before, introducing BDP (Build-up Disruption Percentage), an innovative metric created in collaboration with Antonio Gagliardi, which quantifies the destructive effect of a team’s pressing indirectly, by comparing the opponent’s pass completion rate with their average (you can find more information on BDP in our explainer blog post).
Continuing our collaboration with Antonio Gagliardi, we have delved deeper into a specific aspect of pressing: gegenpressing, or counterpressing. These terms refer to a team or player’s reaction to losing possession while attacking: counterpressing means immediately pressuring the opponent to recover the ball as fast as possible, as opposed to running back and letting the opponent consolidate possession and initiate a controlled build-up phase. This is now a well-established strategy in many possession-based teams, because, if successful, it provides control of the ball in attacking areas against a disorganised defence, a situation akin to a counter-attack, but starting already in advanced areas.
Methodology: how is GPI calculated?
Our Gegenpressing Intensity (GPI) metric represents the fraction of times a team immediately attempts to regain the ball after losing possession in attacking areas, rather than falling back. To define counterpressing actions, we consider as a trigger all losses of possession in the attacking 40% of the pitch and check for defensive actions performed in the attacking half in the following six seconds.


In this context, we adopt a broad definition of defensive action, with the aim of capturing as many counterpressing situations as possible without off-ball information. We therefore include not only fouls, tackles, interceptions, blocks and clearances, but also other events which signal that the team who just lost the ball is actively trying to recover it: aerial duels, fifty-fifty duels, passes, dribbles and shots. Furthermore, we consider as successful counterpressing those situations where there is a failed pass starting from the pressed team’s half, resulting in possession being regained in the pressing team’s half (e.g., following a long ball), within the time threshold. This allows us to register cases where the counterpressing action in the attacking zone does not result in an explicit on-ball event, and therefore is not captured in event data, but pressures the opponent into clearing the ball with a long or otherwise inaccurate pass. In this case, we count the action differently at the player level, since the player who recovers the ball in their own half is not the player who performed the counterpressing action. If the action results in a ball recovery within six seconds, the counterpressing is considered successful, allowing us to compute an efficiency metric alongside GPI.
The detection algorithm for counterpressing actions has been validated extensively using video, and while we are aware that the lack of off-ball information is a relevant limit to this method, we believe the metric is able to capture enough counterpressing instances to provide valid rankings and insights.
In the following video we show several examples of counterpressing that can be captured within this framework, using the recent World Cup match between Spain and Morocco.
SAVE THE DATE | 3rd January 2023 – 18:30 CET | Presenting the new metric GPI (Gegenpressing Intensity) in a LIVE STREAMING EVENT | Reserve your spot (FREE) on Eventbrite at THIS LINK.
Team, league and player results
The teams scoring highest on GPI
In the following bar chart we show the top 20 teams in the top 5 European leagues for GPI from season 2017/18 to 2022/23. As expected, we find teams which are known for their aggressive counterpressing, such as Manchester City, Bayern Munich and Liverpool. The Reds, often regarded as the first team to turn gegenpressing into a winning strategy under Klopp, make the most appearances, figuring in the top 20 in five out of the last six seasons.

We can also look at gegenpressing efficiency, i.e. the fraction of lost balls that the team is able to successfully recover within six seconds (GPI on the other hand considers regain attempts within six seconds, regardless of the result).
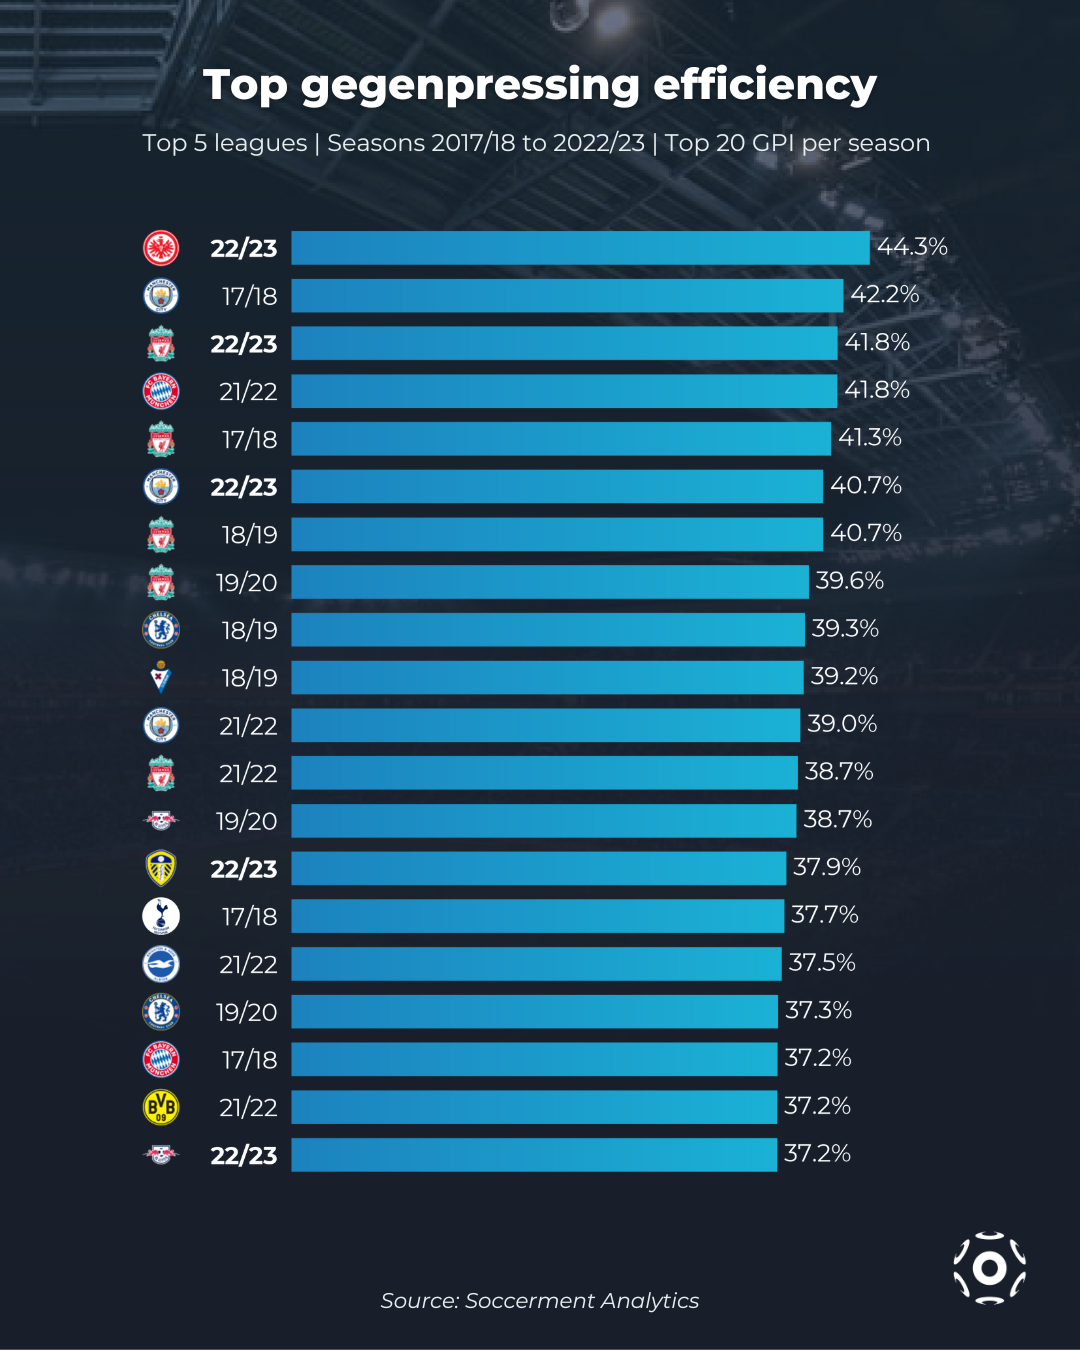
We can see that the top teams in the two rankings are quite similar: indeed there is a strong correlation between the two metrics (r=0.87), meaning the most aggressive counterpressing teams are also the most successful in recovering the ball using this strategy.

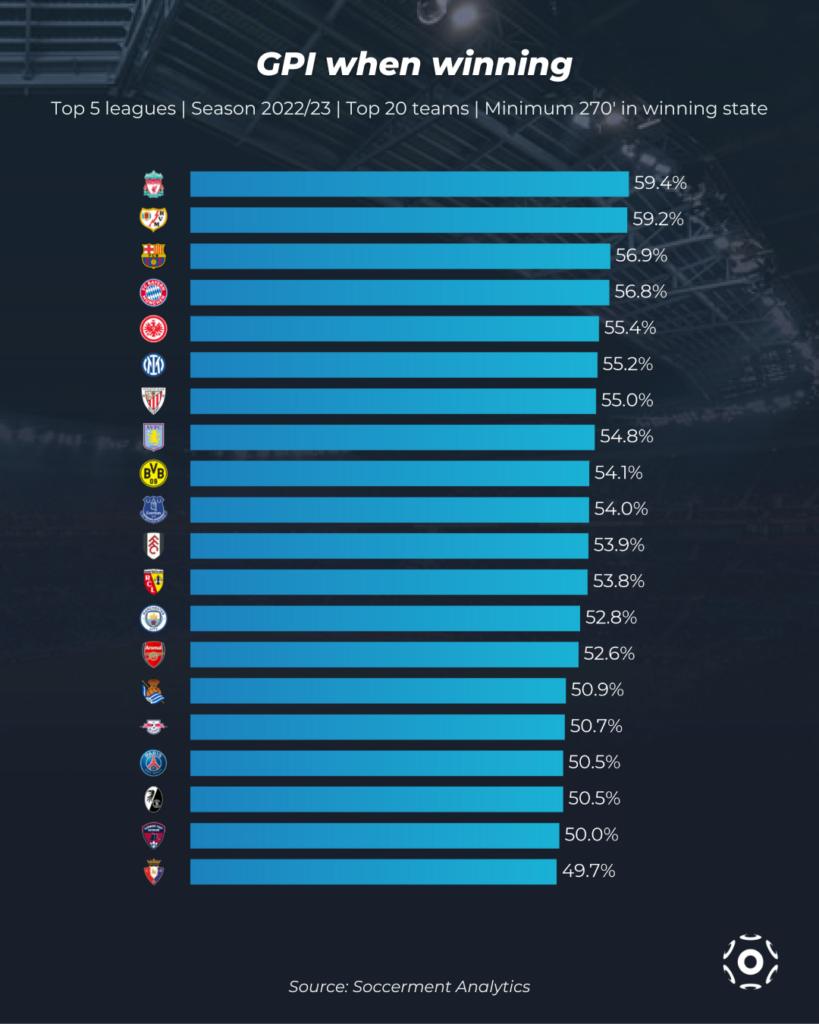
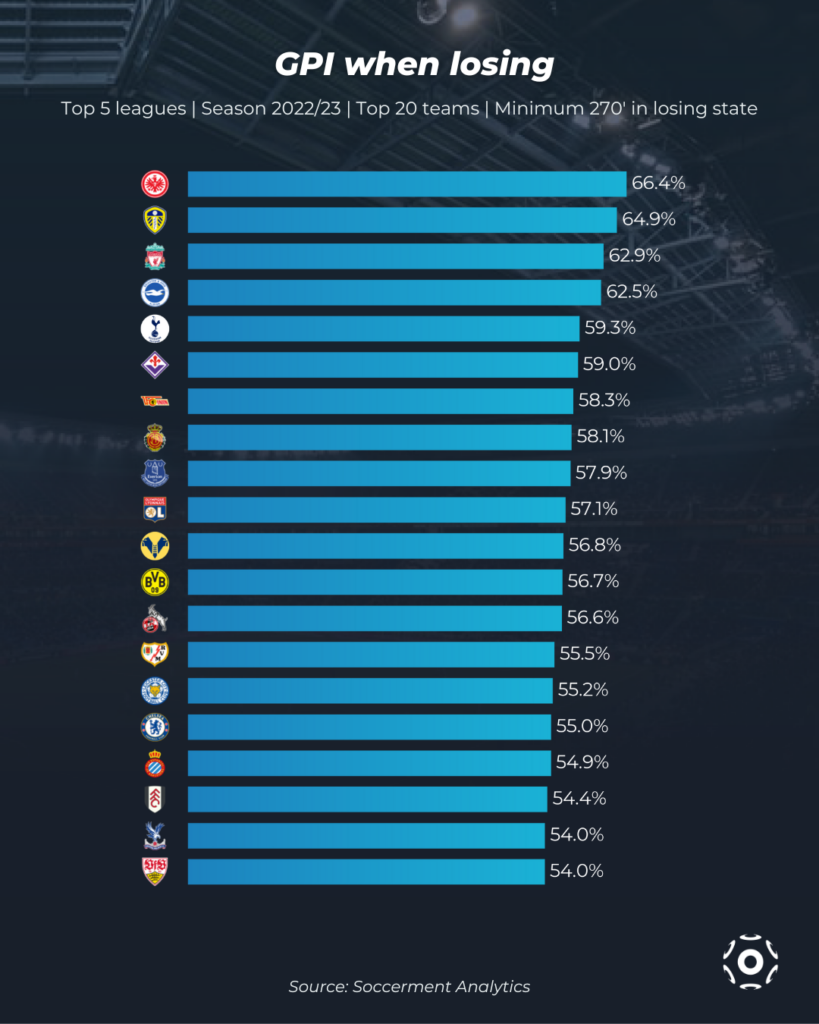
GPI and game state
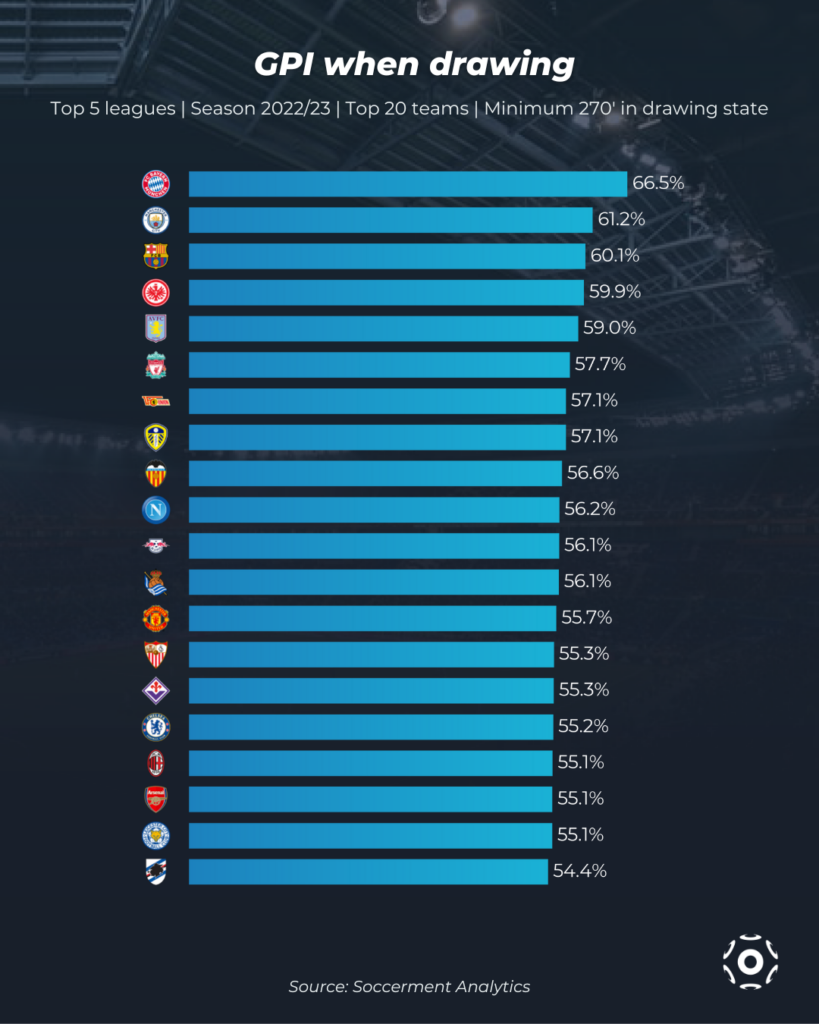
Like most other metrics, GPI can be significantly influenced by game state, i.e. the scoreline. We can see this by splitting our data and looking at counterpressing situations when drawing, winning or losing. The distribution of seasonal GPI values by gamestate shows that teams tend to be less aggressive when winning, and more aggressive when losing.

SAVE THE DATE | 3rd January 2023 – 18:30 CET | Presenting the new metric GPI (Gegenpressing Intensity) in a LIVE STREAMING EVENT | Reserve your spot (FREE) on Eventbrite at THIS LINK.
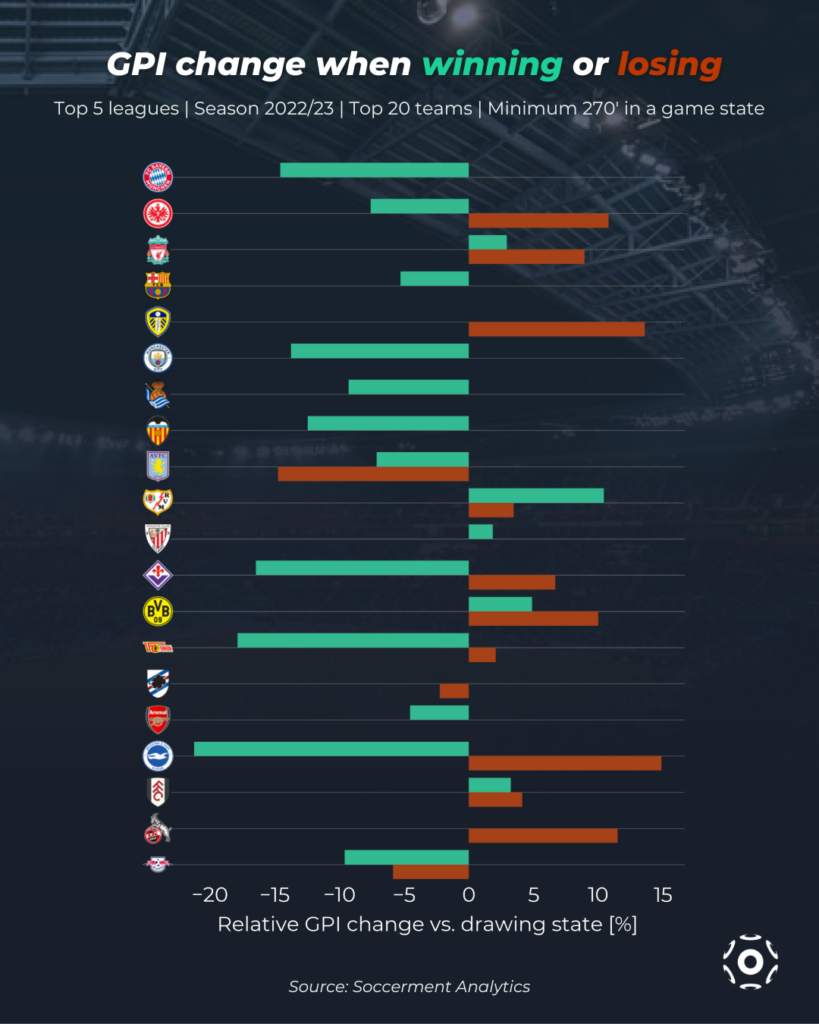
If we look at separate top 20 team rankings for the current season by game state, we see that while generally teams that appear at the top of the ranking for general GPI remain in the list, there are significant changes. If we take GPI in the drawing state as a baseline, we can see how teams react to a change in game state by computing a percentage change of GPI in winning or losing situations compared to this baseline. Again, we see that most teams are less aggressive when winning and more aggressive when losing, but there are some interesting exceptions.
Premier League and Bundesliga well ahead on GPI
Looking at league-level GPI across the seasons, we see that counterpressing is a rising tactical trend in all leagues, with the Premier League and La Liga registering the highest values, and the Bundesliga with the most marked increase in the past six seasons (+25.7%). This explains why most of the team performances in the top 20 list shown above are from relatively recent seasons.

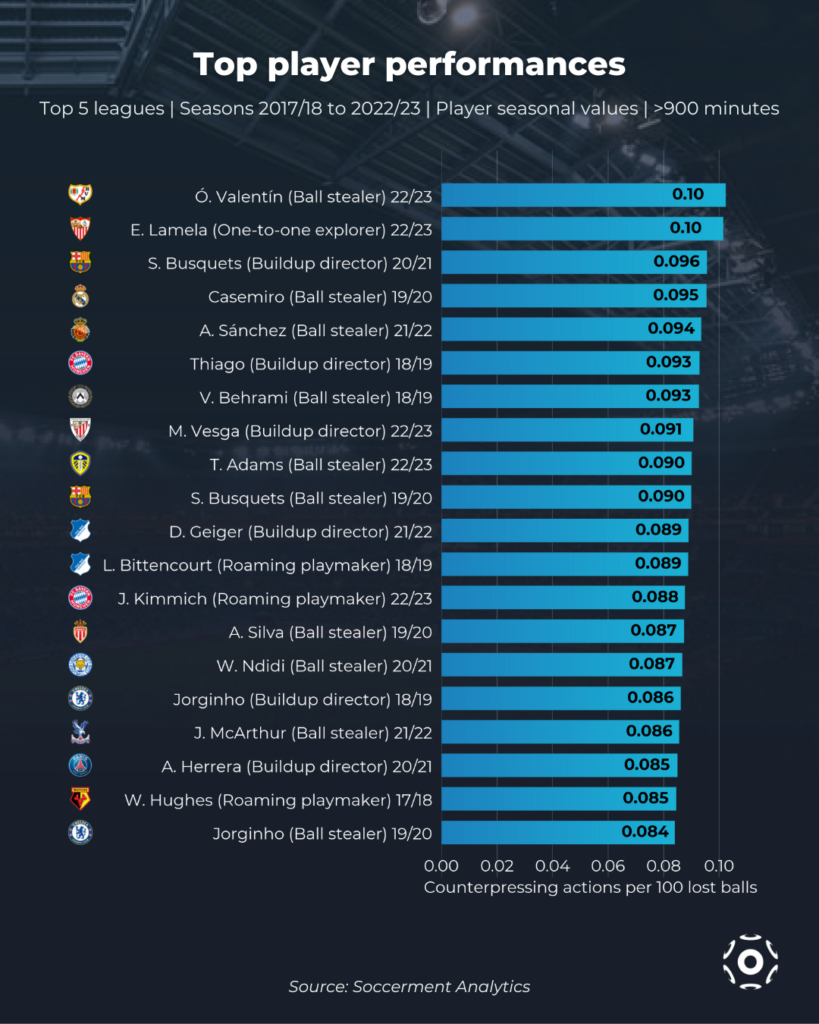
We can also look at the volume of counterpressing actions performed by individual players, normalized by the number of balls lost by the team in the attacking 40% of the pitch while the player was on the pitch. If we collect the top 20 seasonal performances in the past six seasons, and contextualize the result using the player functions from our clustering model, we see that Ball stealers and Buildup directors are the most involved in counterpressing actions. This makes sense, since these players typically operate in central midfield and provide a significant defensive contribution, particularly in the case of Ball stealers. Many of these players are from teams who figure in the corresponding top 20 teams ranking, but it is also interesting to see others who emerge as top counterpressing performers in teams who may employ it less frequently.
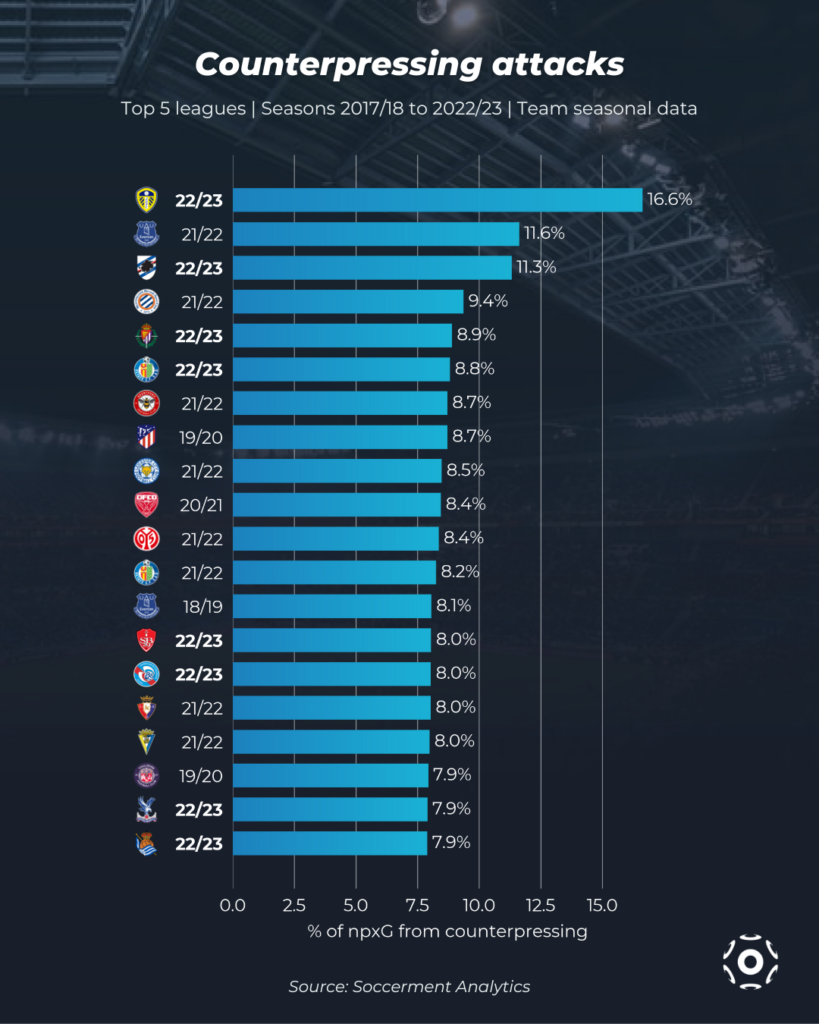
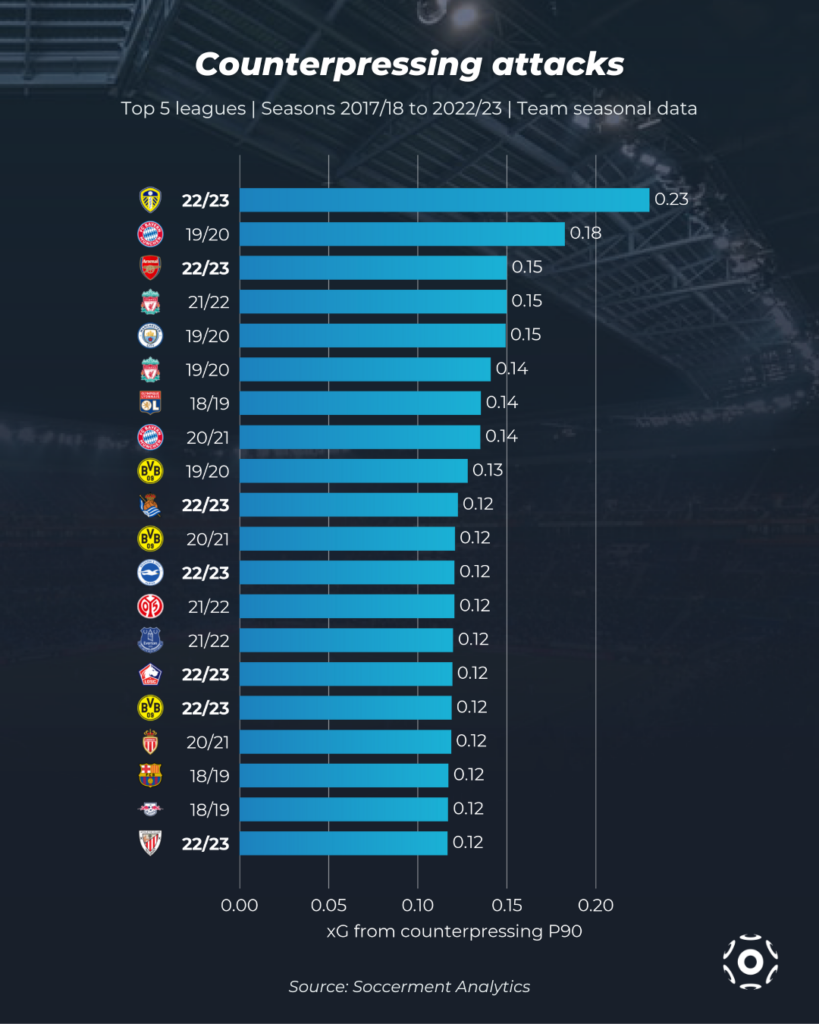
Counterpressing attacking production
We can use this framework to evaluate the attacking production that results from successful counterpressing actions, by computing the xG created within 12 seconds from a counterpressing recovery. Looking at team seasonal data from the past six seasons, 2022/23 Leeds has the highest xG per game from counterpressing situations (with the caveat that the season is incomplete, compared to the previous ones), followed by 2019/20 Bayern Munich and current-season Arsenal. Jesse Marsch’s team also tops the chart in terms of percentage of total non-penalty xG that follows counterpressing recoveries, followed by 2021/22 Everton and current-season Sampdoria.
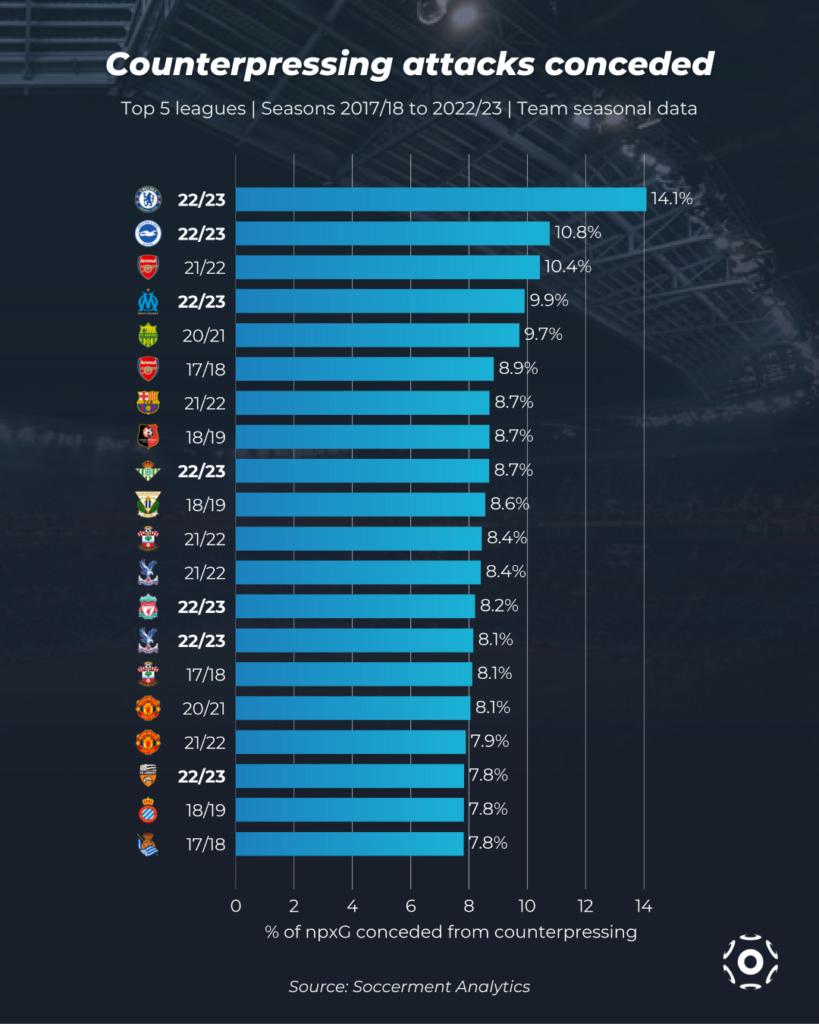
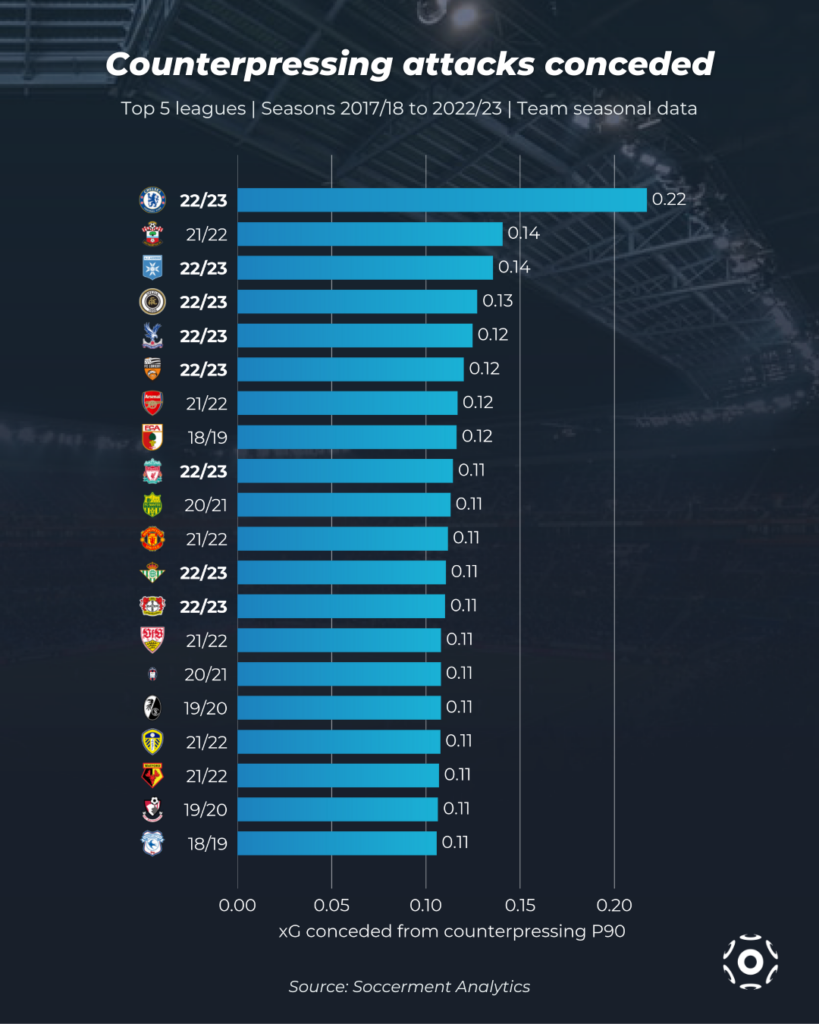
We can also look at defensive performance related to counterpressing, i.e. how many chances a team concedes from these situations, and how big a fraction they make of their total non-penalty xG conceded. 2022/23 Chelsea are first by some margin in both rankings, after a struggling start of the season and a manager change.
Correlations with other metrics
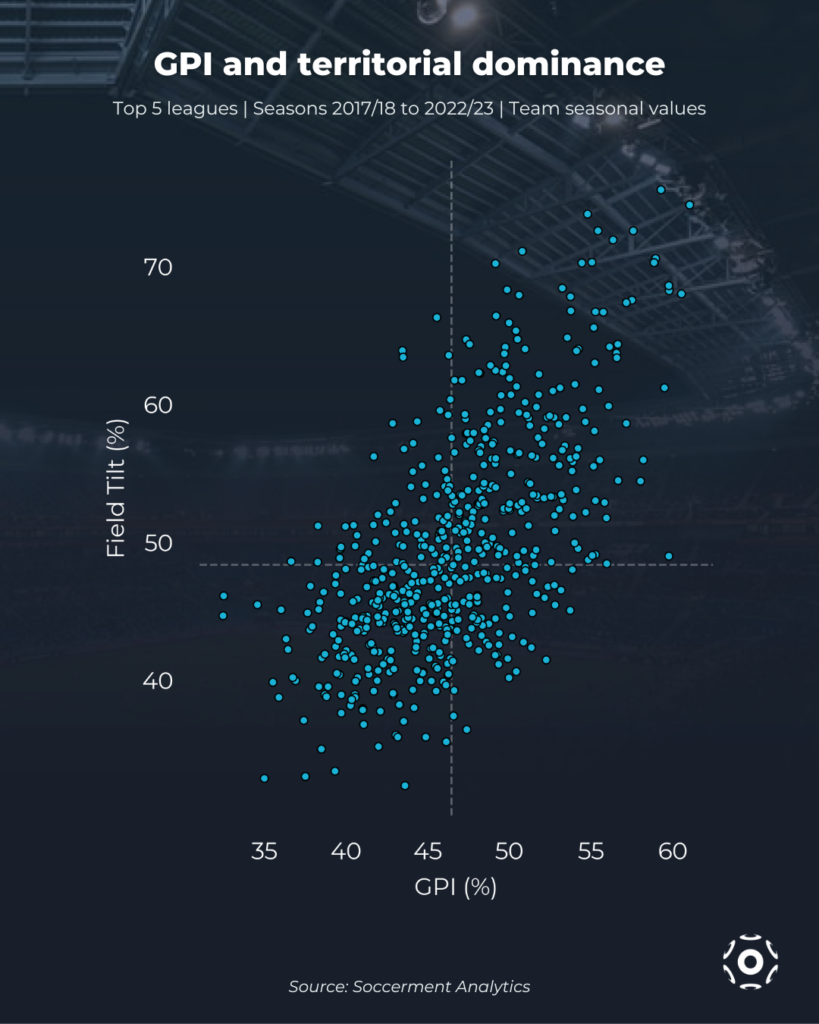
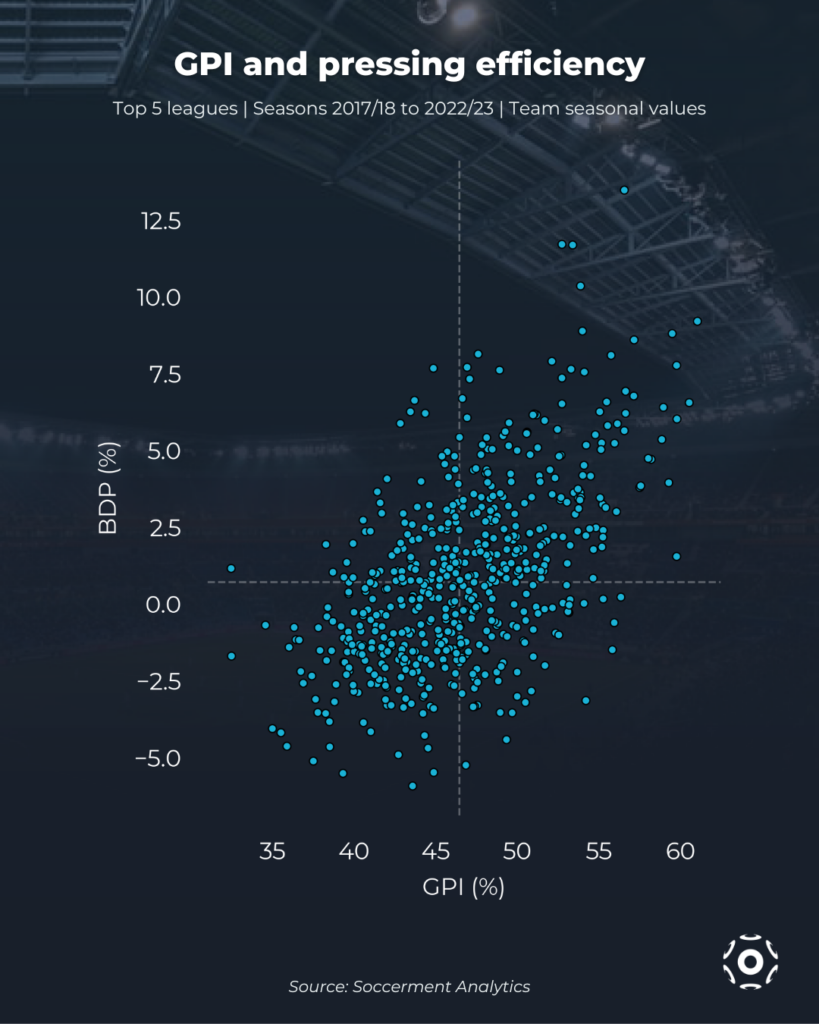
At the team level, we expect GPI to correlate with other indicators, particularly those related to territorial dominance and pressing, as teams which are willing to be aggressive after losing the ball in attacking areas are often teams that try to dominate possession in the final third and be aggressive to regain control of the ball. In terms of territorial dominance, we can look at Field Tilt, a proxy of possession percentage limited to the final third of the pitch. In the following charts we show the seasonal GPI, Field Tilt and BDP team values from the top five European leagues. As expected, there is a significant correlation between GPI and Field Tilt and BDP, with linear correlation coefficients of 0.64 and 0.55, respectively. The fact that the correlation is weaker for BDP compared to Field Tilt can be understood in tactical terms: while in general it is likely that a pressing team will resort to counterpressing, the opposite may not necessarily be the case, i.e. a team might choose to counterpress after losing the ball, but decide not to press aggressively against the opponent’s structured build-up phase.
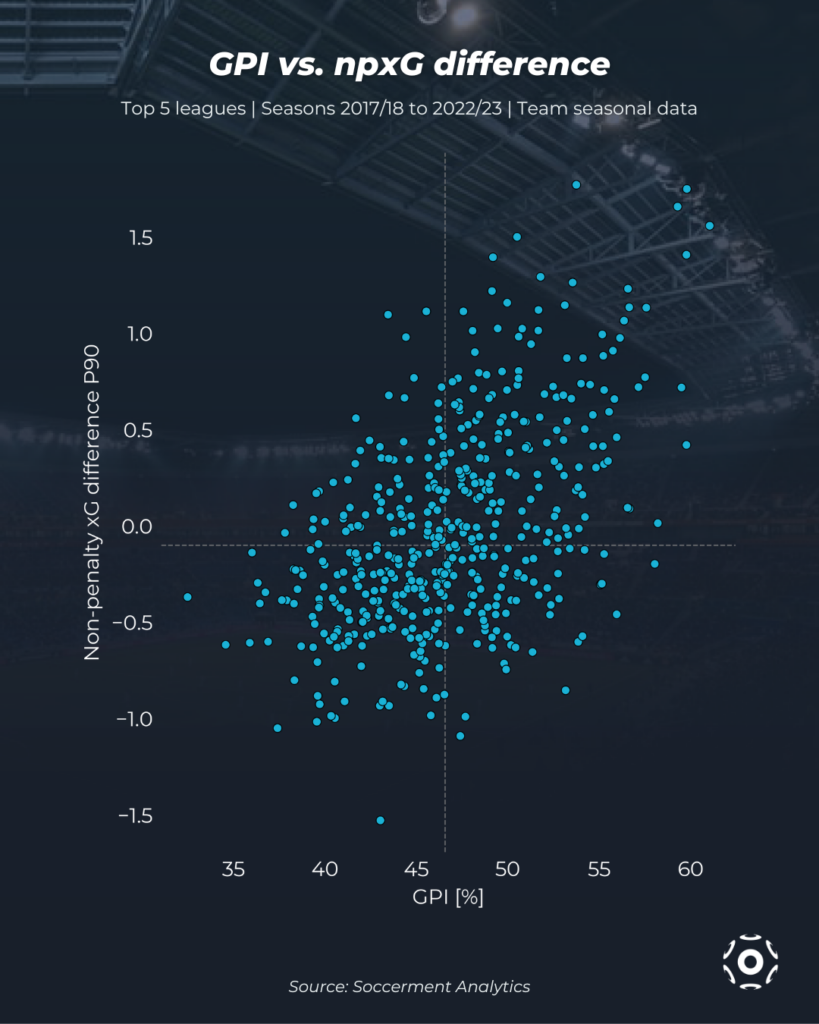
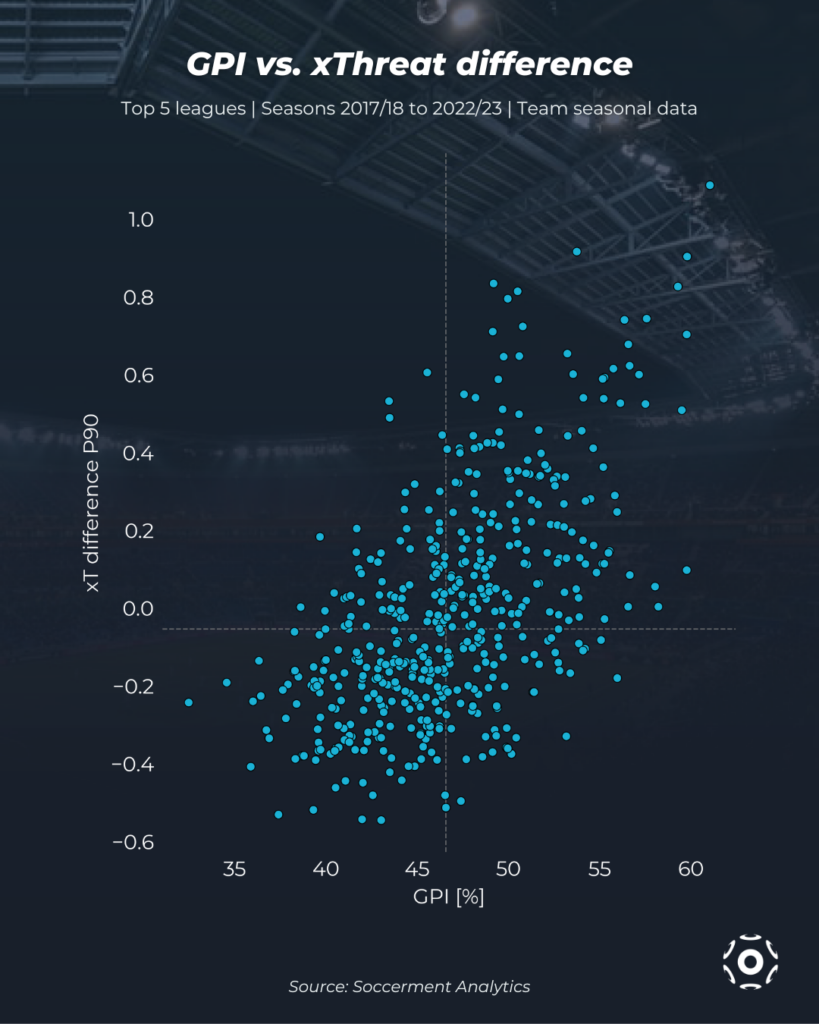
It can also be of interest to compare GPI with general performance indicators such as non-penalty xG difference and xT difference, which indicate when a team is able to consistently produce more chances and more attacking threat than their opponent, respectively.
Conclusions
In this article we have introduced Soccerment’s new Gegenpressing Intensity (GPI) metric, which measures players’ and teams’ aptitude for counterpressing when losing the ball in attacking situations. This provides us with an insightful tool to measure a key component of pressing strategies in many modern tactical setups.
We find that Bayern Munich, Eintracht Frankfurt and Liverpool are the most aggressive counterpressing teams in the top 5 European leagues in 2022/23.
We investigated the relationship between GPI and game state, and found that, as expected, teams tend to be less aggressive when winning and more aggressive when losing, with notable exceptions.
We also found that GPI significantly correlates with territorial dominance (measured with Field Tilt) and pressing efficiency (measured by BDP).
SAVE THE DATE | 3rd January 2023 – 18:30 CET | Presenting the new metric GPI (Gegenpressing Intensity) in a LIVE STREAMING EVENT | Reserve your spot (FREE) on Eventbrite at THIS LINK.
For any question or comment, please do not hesitate to contact us: research@soccerment.com.
Leave a Reply