

One of the main goals of data analytics in football is to inform performance analysts and other decision-makers in the most objective and unbiased way possible. As football is a low-scoring sport with crucial events that are subject to a high degree of randomness, metrics such as goals scored and assists are often insufficient to capture the underlying performance of players and teams. Taking advantage of detailed event data describing every on-the-ball action occurring on the pitch, we can apply the tools of machine learning to create more objective performance metrics that describe players’ underlying offensive production.

Introduction
In a low-scoring sport like football, it is easy for our evaluations of players’ performance to be biased by rare occurrences of valuable events such as goals. We are all familiar with cases of a player scoring a few goals in a row and immediately gathering a lot of attention from fans and the media, only to be forgotten a few weeks later following a dry spell. Discourse around football performance is often very volatile, with twists and turns in judgements occurring at a hectic pace, based on results determined by rare, somewhat random events.
It is therefore easy to see why someone in a managing position in football, such as a coach or a sporting director, would need to inform their decision-making with performance metrics that are as objective and robust as possible. For example, when deciding on a new striker to sign, a manager would very much hope to avoid signing a so-called “one-season wonder“, a player who performed exceptionally and surprisingly well in the previous season, only to see their level plummet in the longer term. Does the player score many goals because they consistently get themselves in threatening situations? Or do they mostly attempt unlikely shots, of which a higher number than average just happened to find the back of the net thanks to a good dose of luck (of which there is no shortage in football)?
Football analytics looks to alleviate these problems (here’s our eBook about the growing importance of football analytics), taking advantage of detailed event data by providing positional and contextual information for all on-the-ball actions in a match. We can apply machine learning methods to these large datasets, with their millions of data points, to derive statistical models that turn binary outcomes of rare events such as goals and assists into probabilities, which, when interpreted and combined correctly, provide more objective measures of performance.
In this report we introduce Soccerment's advanced performance metrics.
- Expected Goals (xG): quantifying shot quality by assigning goal probabilities to shots
- Expected Assists (xA): crediting creativity by assigning assist probabilities to passes
- Expected Offensive Value Added (xOVA): isolating players' offensive contribution;
- Expected Goals on Target (xGoT) / Goals prevented: measuring shooting and goalkeeping skill;
- Expected Passes (xPass): identifying above-average passing skill.
In the next few weeks we will progressively integrate these metrics into our analytics platform.
Expected Goals (xG)
What are Expected Goals?
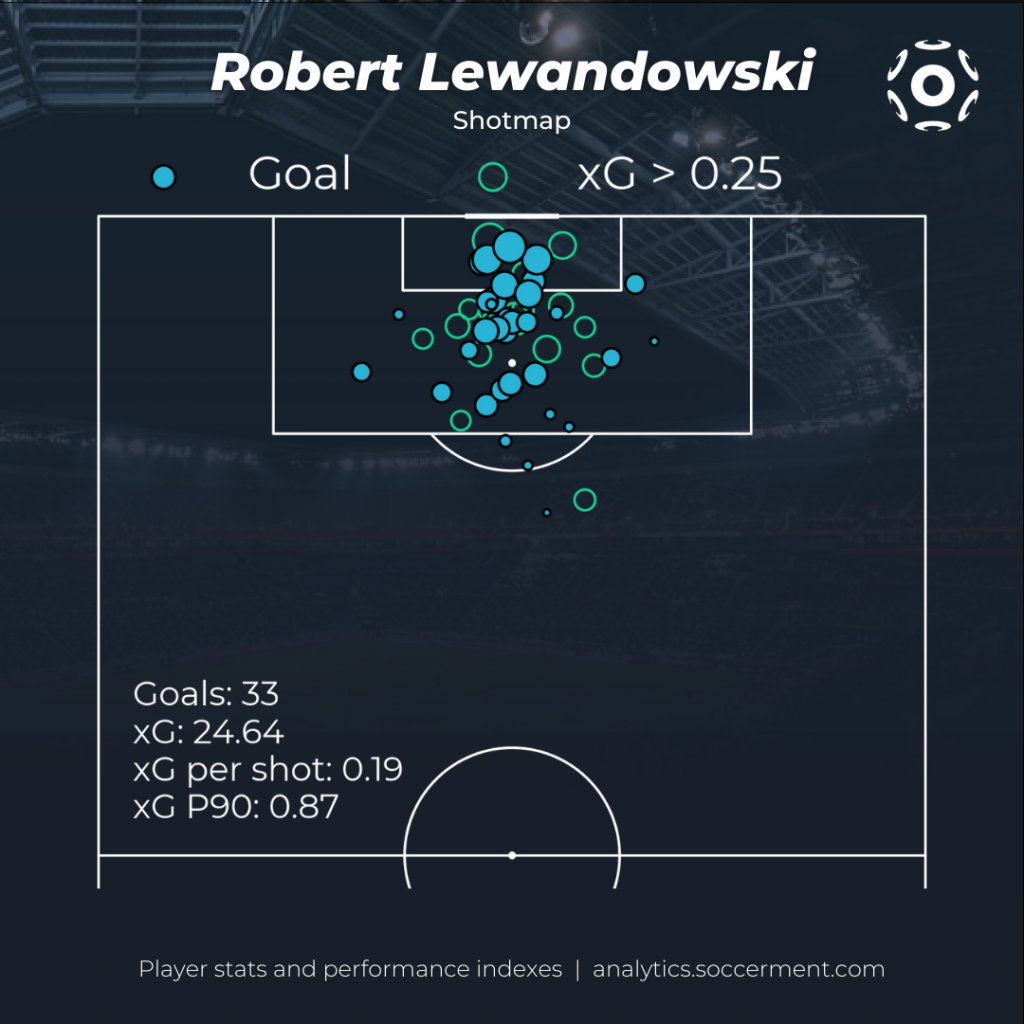
The most used and widely known of these metrics is Expected Goals, most often referred to as xG. Expected goals measures chance quality by assigning to each shot a probability of being converted into a goal, based on the contextual information provided by event data, of which the most important by far is the location of the shot. For example, a typical shot from the central area around the edge of the penalty box would be worth around 0.1 xG. This means that, on average, a player shooting from that position and in a similar situation would be expected to score 10% of the time.
One should take care, however, not to interpret xG as an actual goal prediction of an individual shot. xG should be measured against actual goals as it only achieves significant predictive power only when aggregating a large number of shots, for example over a whole season in a certain league. For individual shots, xG should be read as a measure of chance quality. For example, a team that consistently produces more xG than their opponents may fail to bring home three points in individual matches or even a string of matches, but their underlying performance measured by xG means that in the long run, they should be expected to obtain good results.
In terms of individual players, the average xG per shot indicates how selective the player is in their decision making when it comes to shots. A lower-than-average xG per shot indicates a player who takes many long-distance shots. Conversely, a high xG per shot is typical of a striker who takes most of their shots inside the penalty area.
Soccerment's Expected Goals model
Soccerment's xG is calculated by applying a logistic regression model to hundreds of thousands of shots, with contextual information provided by detailed Opta event data. As mentioned above, the most important feature in the model is shot location, which we encode as goal distance and goal angle (the angle at which the shooter is to the goal). Other important factors include the type of assist (e.g. through ball, cross, etc.), the game state, the shot body part (e.g., right or left foot), and the pattern of play (e.g., open play, set piece, etc.). Penalties are a special case in that they are an extremely simple event occurring under fixed conditions, so that the xG value is a constant set at the average conversion rate, which is 0.78 in our data set.
Expected Assists (xA)
What are Expected Assists?
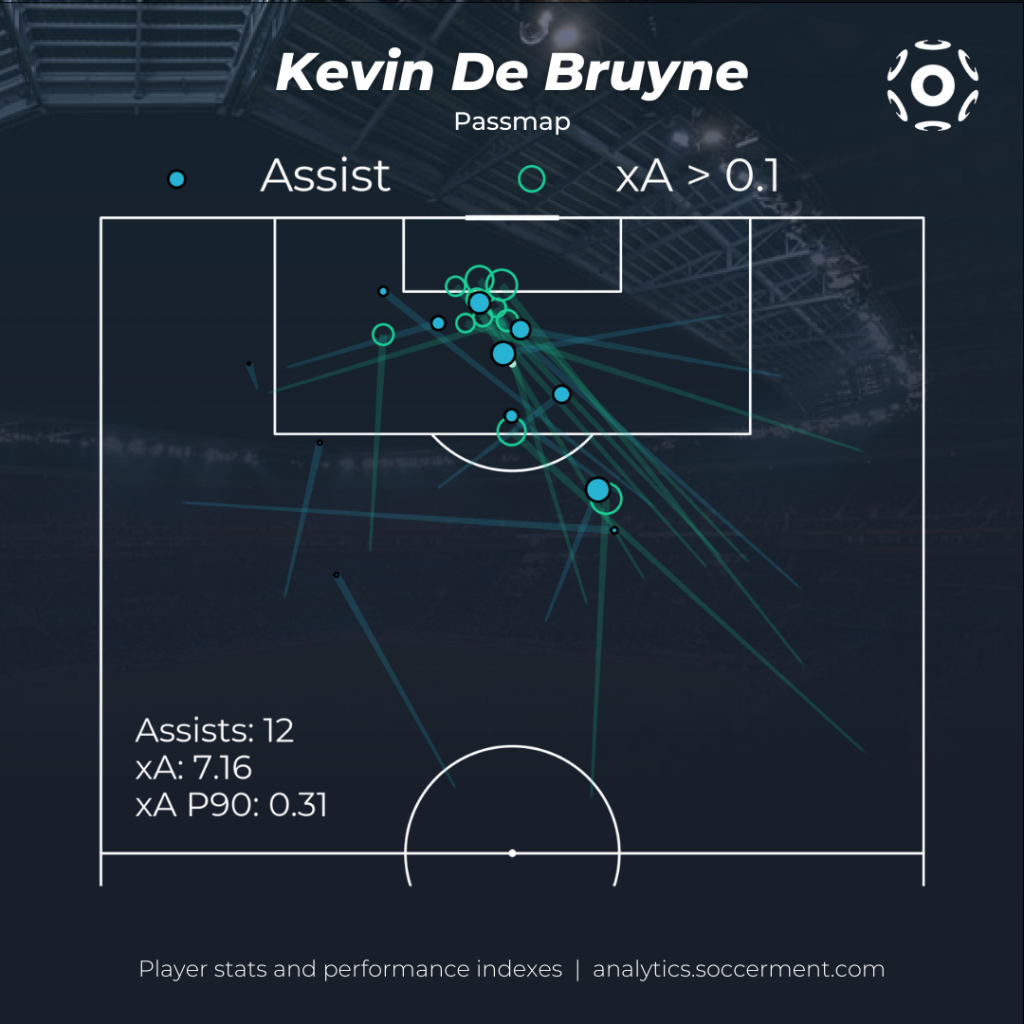
Expected Assists, which we refer to as xA, measure the probability of each pass becoming a goal assist, i.e. for the player receiving the pass to score a goal. The objective of this metric is to credit creative players able to successfully set up valuable goal-scoring chances for their team mates.
Soccerment's Expected Assists model
Unlike xG, for which the basic concept and objective of the metric is understood in the same terms across the football analytics community, there are two main schools of thought when it comes to calculating xA, which may be described as "shot-centric" or "pass-centric".
In the first one, the xA is assigned only to passes leading to shots, by simply crediting the xG value of the shot to the player who provided the preceding pass, and therefore does not require further calculations. This is the method followed by most analytics providers. In the second case, a separate model is focused on all completed passes, calculating a probability of each of them becoming a goal assist, regardless of whether the receiving player takes a shot or not.
We believe the latter approach gives a fairer attribution of credit to creative players, by separating their passing output from the decision making and skill of the receiving team mate, and simply focusing on whether they successfully and consistently deliver the ball in dangerous positions and situations. On the other hand, it also prevents undue credit from being assigned to the passing player for low-threat passes that are followed by a difficult individual action by the receiving player resulting in a high-xG chance. A striking example of this can be seen in the case of Romelu Lukaku's goal in Milan's Derby last season (which Inter Milan won 0-3).
Perisic plays a long ball from Inter's defensive third, which is picked up in the midfield circle by Lukaku, who then proceeds to smash through AC Milan's defence and score, with a shot valued at 0.11 xG. Almost all analytics providers would assign Perisic 0.11 xA from this pass, however it is quite clear that credit for creating this chance should be assigned almost entirely to Lukaku. On the contrary, Soccerment's xA model, given the non-threatening nature of the pass itself, assigns it an xA value of 0.001, which we believe better reflects the spirit of the metric.
Our xA model is, like the xG model, a logistic regression trained on millions of completed passes from Opta event data, using positional and contextual information.
Expected Offensive Value Added (xOVA)
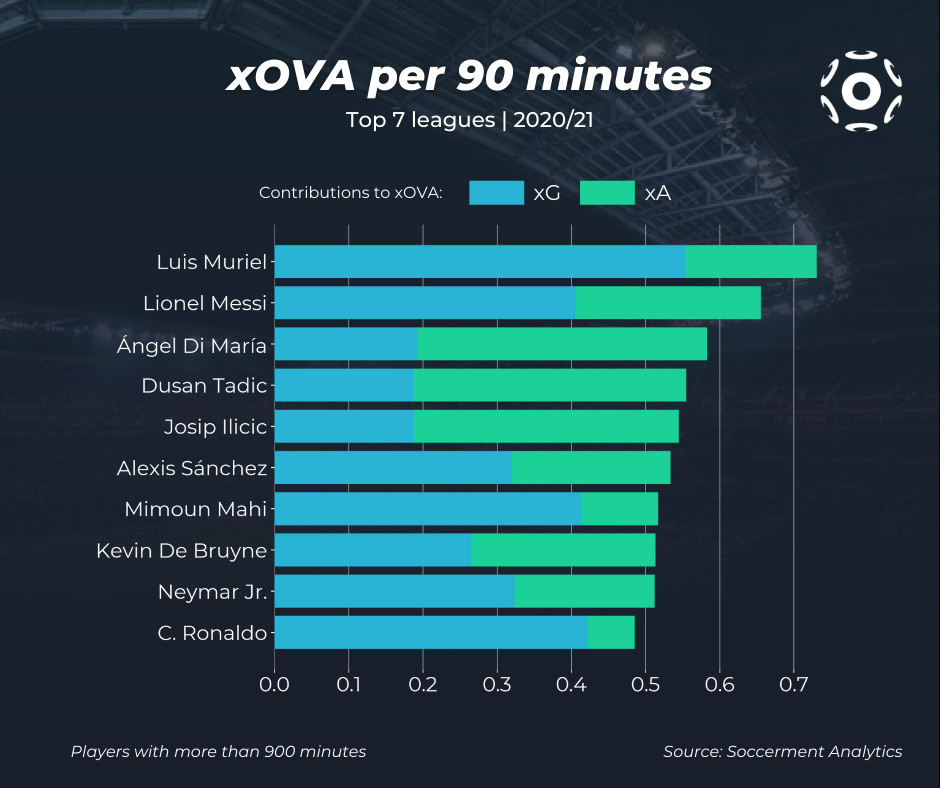
We are able to measure the total offensive output of all footballers, evaluating both their shooting and their creative passes, by combining xG and xA. In order to fully measure the player's individual contribution, we can then subtract from this total the xA they received, thus measuring the offensive value that the player adds with respect to that received from their teammates. We call this new metric Expected Offensive Value Added, or xOVA:
xOVA = (non-penalty xG + xA) - xA received
In our view, this rather simple metric offers a solid overview of a player's ability to "positively transform" the possession, i.e. to increase the team's chances of scoring a goal. After all, after receiving a pass, a player can do a number of things, including run with the ball, or just lose it; however, the players' intended ultimate outcome will be either to shoot or pass the ball to a better-positioned teammate. The quality of the selection of those shots and passes is reflected in the sum of Expected Goals and Expected Assists.
We need to stress two important points: a) xOVA measures chance creation through shots and passes, not the actual outcome of those chances; and b) this metric can only be calculated with a "pass-centric" approach to Expected Assists, with "shot-centric" xA it won't work, which is one of the reasons we chose the former.
Looking at last season's data from the top 7 European leagues, we find that the top offensive contributor on a P90 basis was Atalanta's Luis Muriel, with 0.73 xOVA from 0.81 non-penalty xG, 0.26 xA provided and 0.35 xA received.
Expected Goals on Target (xGoT) and goals prevented
What are Expected Goals on Target?
The xG model described above represents the pre-shot goal probability, i.e. it does not take into account where the ball ends up as a result of the shot. The xG value is the same whether the ball is shot square in the middle into the arms of the goalkeeper, or whether it is placed perfectly in the top corner. By construction, xG represents the goal probability assuming average shot placement skill.
In order to evaluate the finishing skills of a striker, we can take advantage of the shot-goal mouth coordinates that are included in the detailed Opta data for on-target shots to calculate a post-shot goal probability, which we refer to as Expected Goals on Target, or xGoT. Similar to xG, this metric is calculated from a logistic regression on the tens of thousands on-target shots in our data set, however the predicting features are simpler: the original xG value, which encodes the positional and contextual information, and the two goal mouth coordinates (horizontal and vertical).
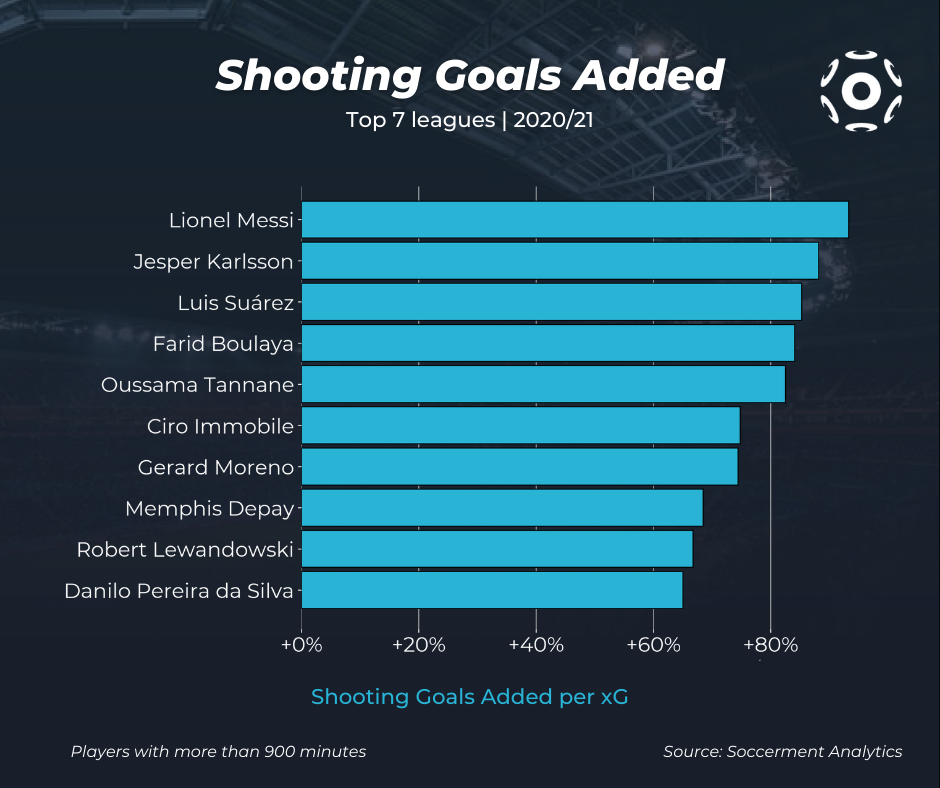
The difference between xGoT and xG measures the finishing skills of the shooter, in that it represents how much the player's shooting increases the goal probability with respect to the initial xG. This metric is called Shooting Goals Added, or SGA. We should note a caveat when interpreting this metric: the goal mouth coordinates are only available for on-target shots and blocked shots are not included, so the model does not encompass all the shots that were originally directed towards the goal mouth, but only the ones that made it there, ending either in a save or a goal.
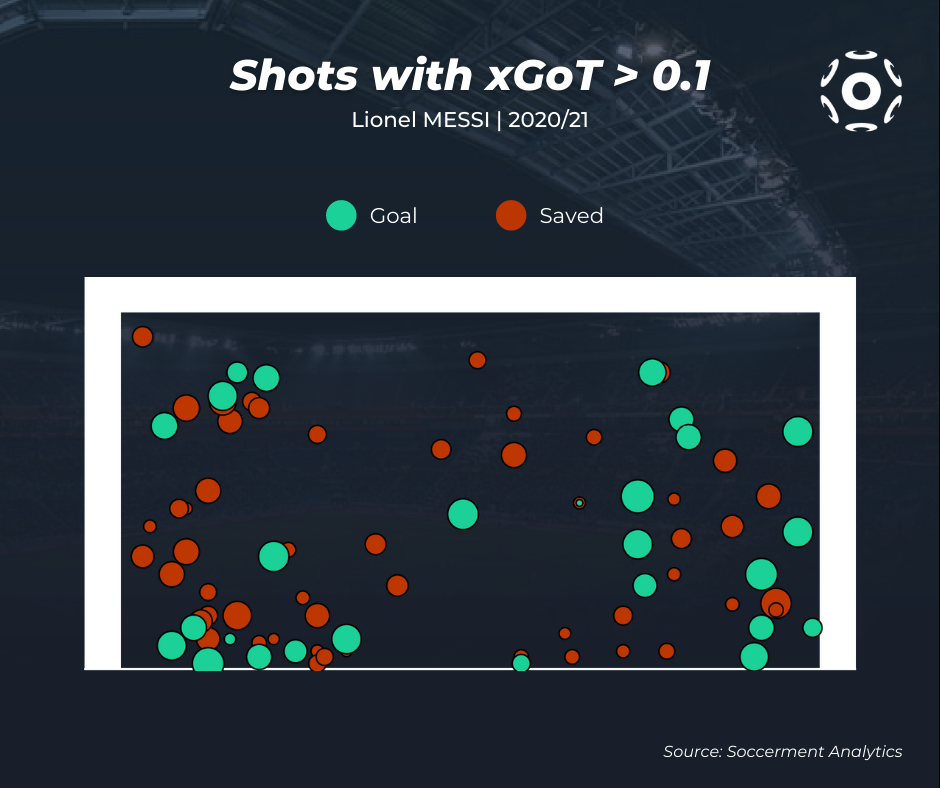
We can see which are the players who increase their goal probability the most thanks to their shooting skills by comparing their SGA per xG. Unsurprisingly, Lionel Messi comes out on top for the 2020/21 season, when looking at players with a minimum of 50 on-target shots, with Lazio's Ciro Immobile also featuring in the top 10.
Evaluating goalkeepers: goals prevented
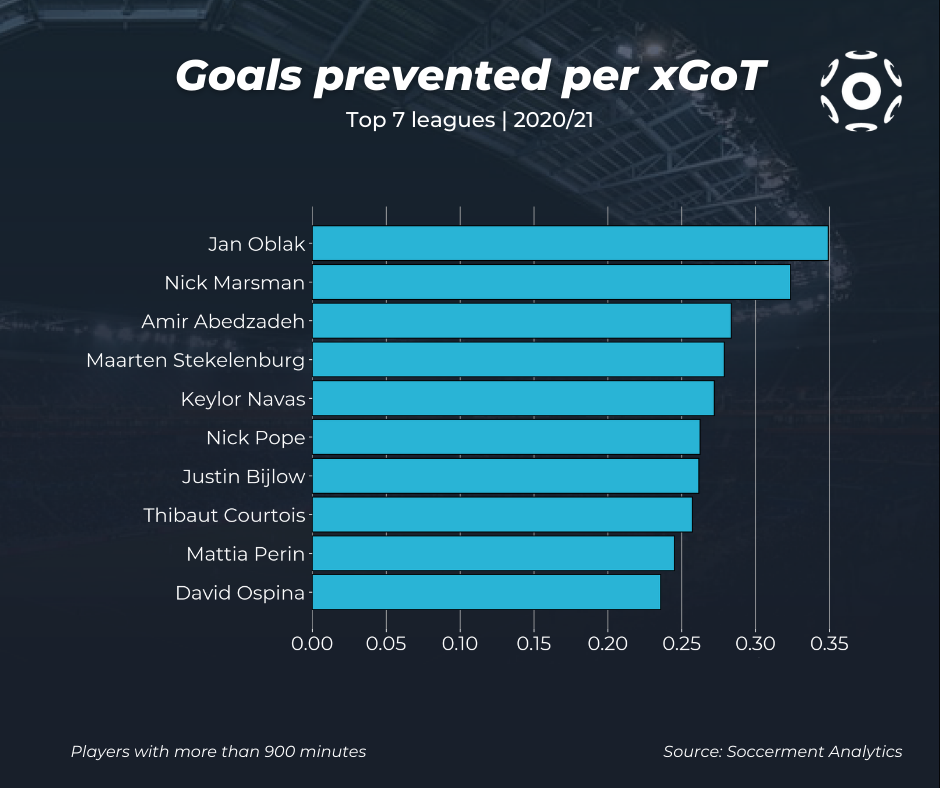
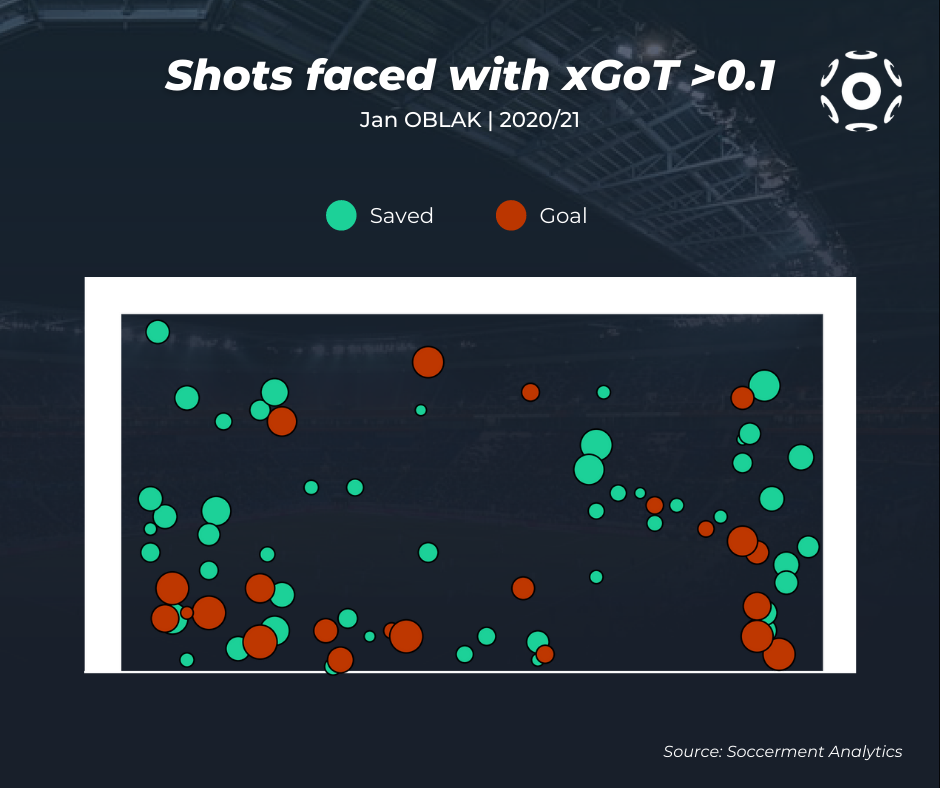
xGoT have another very useful application in measuring perhaps the single most important goalkeeping skill: shot-stopping. If a goalkeeper is conceding fewer goals than what would be expected from the total xGoT they faced, it means they are effective at stopping shots that are directed in difficult-to-save positions within the goal mouth and/or coming from very dangerous shooting positions (i.e., with high initial xG). The difference between xGoT faced and goals conceded is therefore referred to as goals prevented.
This metric shows that Jan Oblak is by far the best shot-stopper in elite football, both in absolute terms, with 34.87 goals prevented (since season 2017/18) compared to second-best Hugo Lloris with 26.59, and also after normalisation, with 0.28 goals prevented per xGoT faced (0.35 in season 2020/21).
Expected Passes (xPass)
What are Expected Passes?
Using the passes data set which powers the xA model, we also construct a model of pass completion probability, which we refer to as Expected Passes or xPass. The model is (you guessed it) a logistic regression trained on millions of passes, using positional and contextual information analogous to the xA model, but taking as the target label not whether a pass is a goal assist, but simply if it was completed or not.
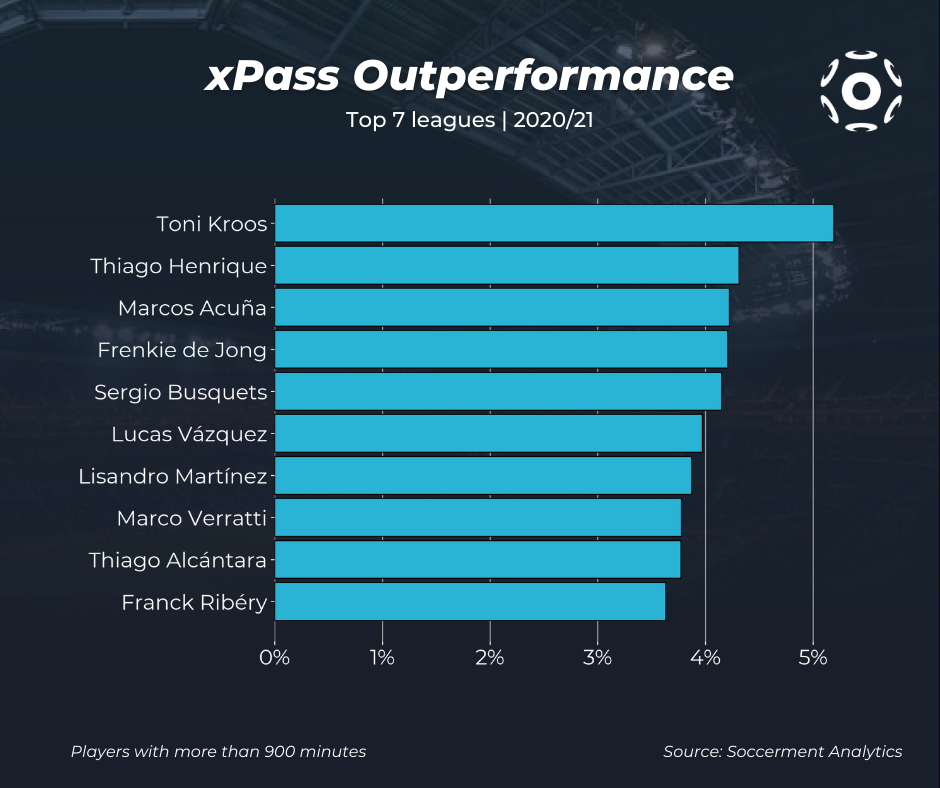
This metric can tell us whether a player is consistently executing riskier, high-reward passes with a higher success rate than average, which would result in a positive difference between passes completed and total xPass. In 2020/21, the top midfielder in this metric was Real Madrid's Toni Kroos, with a percentage xPass overperformance of 5.19%. The top 10 list includes PSG's Marco Verratti, a key player in Italy's recent success at EURO 2020, and the player with the most completed passes (93.72) on a P90 basis in the past season.
For any comment, request or query, please write us to research@soccerment.com.
Comments
One response to “Soccerment's Advanced Metrics”
[…] Assist (xA), è opportuno fare una distinzione fra modelli di Expected Goal Assisted (Statsbomb) e modelli di Expected Assist (Soccerment, Opta). Infatti il modello degli Expected Assist è focalizzato su tutti i passaggi, […]