
Over the past two decades, the influence of data analytics has been growing in every aspect of our lives: in businesses of every kind, but also in healthcare, media and sports. Until a few years ago, football was thought to be immune from this trend. Now, the early adopters in the major football leagues are thriving thanks to the competitive advantage that investments in data analytics are beginning to provide them: Liverpool, AZ Alkmaar and Brentford are just a few in the fast-growing list of successful case studies. In our view, the clubs that aren’t planning to jump on the analytics bandwagon run the risk of being left behind.
A brief history of football analytics
The origins of football analytics: Charles Reep and the problem of interpreting data

Football analytics is not as young a discipline as we often think. The first proponent was an accountant in the British Royal Air Force named Charles Reep, who, after World War II, started collecting and analysing data about football matches, using a pencil and paper.
Reep concluded that most goals were scored from fewer than three passes, and therefore that it was important to get the ball forward as soon as possible. His theory became known as the long ball, and would have great influence on English football for many years, especially in the Eighties. Reep worked at Brentford, Wolverhampton and Sheffield Wednesday, but also collaborated with Wimbledon, Watford and the Norwegian National team, always advocating a direct attacking style of play.
Reep’s conclusions were, however, proven inaccurate. Jonathan Wilson (author of ‘Inverting the Pyramid‘), has pointed out how Reep’s analysis showed that 91.5% of moves in the games he studied had 3 passes or fewer and that logically, this would mean that 91.5% of all goals should come from moves with 3 passes or fewer.
What Charles Reep was doing right was data collection. What he did wrong were the conclusions he reached after analysing the database he put together with so much passion. At the end of the day, he was an accountant, not a data scientist.
This is a clear example of how data alone isn’t enough to gain a competitive edge, what’s even more important is the ability to interpret it. This is becoming more and more obvious nowadays, as databases continue to grow and the role of data scientists becomes increasingly important.
The football establishment, rather than taking the good, initial part of Reep’s work (gathering data) and focusing on improving how the data is interpreted, instead dismissed the experiment and the concept behind it, i.e. that with data it is possible to better understand the game and gain a competitive edge.
Data alone isn’t enough: you need analytics
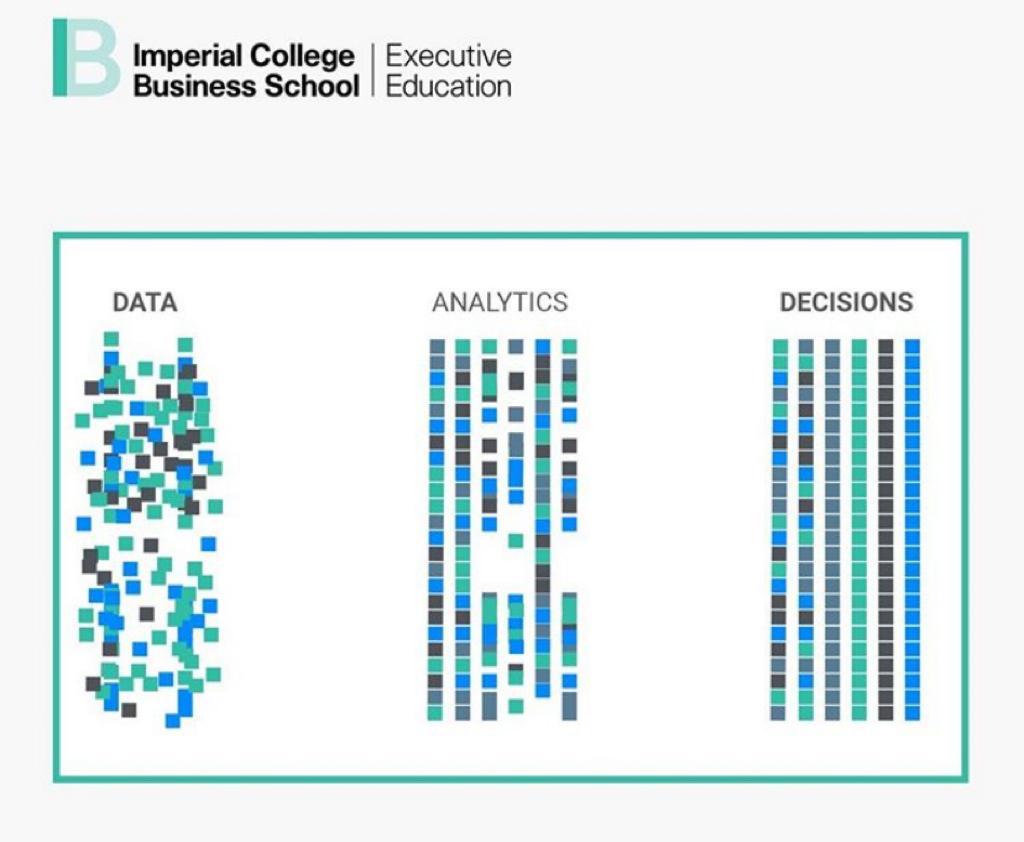
The problem of being able to interpret the data is still with us. For example, if football clubs are flooded with huge streams of numbers, but lack the internal know-how to interpret them and extract actionable information, data becomes almost pointless. It’s like giving all the prices, ratios and indicators on stocks, currencies and commodities to a person who doesn’t know about financial markets: the data itself doesn’t make that person an infallible trader. To make good decisions, football teams need data, of course, but they also need analytics to make sense of it. The following is a good representation of the concept, by Imperial College London.
Sports analytics’ rise after Moneyball

The publication in 2003 of ‘Moneyball: The Art of Winning an Unfair Game‘ was sports analytics’ real introduction to a wider audience. Written by Michael Lewis, the book focuses on the Oakland Athletics baseball team and its general manager, Billy Beane. The book – and eight years later the movie Moneyball, starring Brad Pitt and Jonah Hill – was instrumental in popularising the concept of sabermetrics (the statistical analysis of baseball) and sport analytics.
According to the book, before sabermetrics were introduced to baseball, teams were dependent on the skills of their scouts to find and evaluate players. Lewis argues that the Oakland A’s’ front office took advantage of more analytical gauges of player performance in order find players and build a team that could outsmart and better compete against richer competitors in Major League Baseball. The team became famous for winning 20 consecutive games between August 13 and September 4, 2002.
After Oakland Athletics had led the way, all other MLB teams took note and soon followed. In a few years other US sports, like basketball and American football, started to become more and more data-driven.
Football managers, initially, remained sceptical. Most people thought that, unlike American sports, football would be impossible to analyse using data.
But a few stubborn people disagreed. And they went on to start a data revolution in the Beautiful Game. One of them was Billy Beane himself, who is deeply interested in football. In this post, we described how he became advisor to the Dutch club AZ Alkmaar, in 2015.
The most recent developments, the successful case studies of Liverpool, AZ Alkmaar, FC Midtjylland and Brentford, show that not only is it possible to analyse football, but those who do it properly gain an important competitive edge.
Applications of data analytics in football
The advancements that we have seen in the industry in the past five years will be dwarfed by what will happen in the next five.
In the past few years, the exponential speed of improvement in the technologies supporting the collection, storage and analysis of data has gone hand-in-hand with an exponential increase in the human capital invested in sports analytics. This has seen the quantity and quality of the datasets explode. In our view, however, the advancements that we have seen in the industry in the past five years will be dwarfed by what will happen in the next five.
As the datasets have grown and improved, the number of potential applications of data analytics to the game has multiplied, making “football analytics” a quite generic concept. Below, we try to summarise the main fields of application.
Scouting
Smart scouting: three reasons
In our view, data analytics is a very powerful scouting tool, for three main reasons:
- Savings. Searching for players in large and detailed databases allows clubs to save incredible amounts of time and money. After applying the desired filters, the scout can restrict the area of interest to a selected number of players and start seeing videos of this group. In our hypothetical scouting funnel, conceptualised in the picture below, thanks to the videos the scout can further filter the number of players to go and watch live. We believe that databases cannot replace scouts, but rather that they can complement their talent identification skills.
- Silicon has more memory than you or I. Do you remember all the actions, all the shots, all the crosses and dribbles by your favourite team in the past season? Of courses not. And the same would be true even if we restrict the analysis to your favourite player. On the contrary, while a computer doesn’t have a favourite team or player, it can remember everything that has occurred in past seasons. This is invaluable for scouts, who are often misled by the over- or under-performance of a player in a specific game, or even over a more extended period.
- Limiting pre-conceptions. Skimming through databases often gives rise to counter-intuitive results. In some cases, these might be false positives. In other cases, they deliver proper “eureka moments”: your eyes didn’t capture that particular skill from that particular player, but the next time you watch him, everything becomes clear.

When it comes to smart scouting and player trading, there are three clubs that stand out, with data at the heart of their scouting routines. Two of them are owned by the same man: Matthew Benham.
Smart scouting: Brentford

Their success in the transfer market allows Brentford to successfully compete in the English Championship, despite having a salary budget which is 60% lower than the league average.
Matthew Benham (on the left in the picture above, portrayed with his friend and colleague Rasmus Ankersen) is an ex-City trader who founded the betting-consultancy, Smartodds, a privately-owned company that provides statistical research and sports modelling services to customers like professional gamblers.
In June 2012 Benham became the majority owner of Brentford FC, which was then fighting for promotion from League One. In July 2014 he became the owner of Danish club FC Midtjylland.
The English club Brentford and the Danish FC Midtjylland have one thing in common, apart from their ownership: they are able to punch above their weight, i.e. they have figured out how to compete with much smaller budgets than their peers. The way they do this is a relatively simple concept, but one that it is very hard to actually pull off: maximise returns in the transfer market.
Below, as an example, is a table we took from the book “The Expected Goals Philosophy“, written by James Tippett, a former “watcher” at Smartodds. A watcher is responsible for tracking the stats of football matches, the same stats that feed the algorithms of Smartodds, Brentford and FC Midtjylland.
| Player | Purchasing fee (£ m) | Selling fee (£ m) | Profit (£ m) |
|---|---|---|---|
| N. Maupay | 1.8 | 20 | 18.2 |
| A. Gray | 0.5 | 12 | 11.5 |
| S. Hogan | 0.75 | 12 | 11.25 |
| C. Mepham | 0 | 11 | 11 |
| E. Konsa | 2.5 | 12 | 9.5 |
| R. Woods | 1 | 6.5 | 5.5 |
| N. Yennaris | 0.2 | 5 | 4.8 |
| Jota | 1.5 | 6 | 4.5 |
| J. Tarkowski | 0.3 | 4.5 | 4.2 |
| J. Egan | 0.4 | 4 | 3.6 |
| D. Bentley | 0.45 | 4 | 3.55 |
| R. Sawyers | 0.3 | 2.9 | 2.6 |
| M. Odubajo | 1 | 3.5 | 2.5 |
| M. Colin | 0.9 | 3 | 2.1 |
| F. Jozefzoon | 0.9 | 2.8 | 1.9 |
| Total | 12.5 | 109.2 | 96.7 |
The table above represents Brentford’s most profitable player transfers. It includes the fee that Brentford paid for them, the fee received upon selling them, and the gross capital gains from the operation. As shown, Brentford paid £12.5 million for that list of players and received £109.2 million when they were transferred out, for a gross capital gain of £96.7 million.
According to the book, their success in the transfer market allows Brentford to successfully compete in the English Championship, despite having a salary budget of less than £15m, 60% lower than the league average (£39m).
Smart scouting: Liverpool

FC Liverpool employs a four-man research team, which really is football analytics’s dream team. Football clubs, when keen on data analysis, normally have at most one person with their background. Having four of them is more than unprecedented, it is revolutionary.
In 2010 Liverpool was acquired by American company Fenway Sports Group, owners of the baseball team Boston Red Sox since 2002. Very keen on sabermetrics, the Red Sox tried to hire Billy Beane but he turned the offer down, preferring to stay at Oakland Athletics. So the Red Sox instead turned to another of the pioneers of sabermetrics, Bill James, as Special Advisor to the club. The term “sabermetrics” was coined by Bill James himself, deriving it from the acronym SABR, which stands for the “Society for American Baseball Research“, founded in 1971.
The Red Sox hadn’t won the World Series for 84 years, seemingly doomed by the so-called “Curse of the Bambino“. In 2004, two years after Fenway got involved, the Red Sox were able to break the curse and became one of the most dominant baseball teams ever, winning the World Series again in 2007, 2013 and 2018.
At Liverpool, Fenway Sports Group decided to replicate the scheme, investing money in data analytics. They soon hired Damien Comolli as Director of Football Strategy. Comolli had a reputation for uncovering hidden gems through data: while at Tottenham, for instance, he signed Luka Modric and Dimitar Berbatov.
At Liverpool, despite signing Luis Suarez and Jordan Henderson, things didn’t go according to plan for Comolli, who left the club in the spring of 2012. Before leaving Liverpool though, he did make one important signing, a man who went on to become pivotal to the club’s recent successes. For once, we are not talking about a playing star, but a data analyst: Michael Edwards, pictured above.
Brought in by Comolli as head of performance and analysis, Michael Edwards was appointed Liverpool’s first-ever sporting director in November 2016.
Edwards works along with the head of recruitment Dave Fallows, the chief scout Barry Hunter, and a four-man research team headed up by Cambridge graduate Ian Graham (PhD in Physics) and including William Spearman (PhD in Physics and ex-CERN), Tim Waskett (PhD in Astronomy) and Dafydd Steele (Statistical researcher). This group really is football analytics’s dream team. Football clubs, when keen on data analysis, normally have at most one person with such a background. Having four of them is more than unprecedented, it is revolutionary.
The ability to crunch and make sense of the performance data has allowed Liverpool to scout for the players that best fit Jürgen Klopp’s playing style. Another important characteristic of Liverpool’s set up is that there are clear synergies between the technical coaches, headed by Klopp, and the data scientists, a relationship that is fostered by mutual trust and respect.
In our view, the higher quality and quantity of its data allowed Liverpool to make more informed offers in the transfer market than peers because the club, unlike its competitors, had much more information regarding players and therefore could apply a lower discount-risk to its valuations.
The purchases of Mohamed Salah, Alisson and Virgil van Dijk all seemed too expensive at the time. Instead, the players’ valuations have significantly increased since Liverpool bought them. In the table below we include all of Liverpool’s most important signings (purchasing fees above €10m) since 2016/17 (the first full season with Edwards as Sporting Director) and compare the purchasing fee with the current valuation (post-COVID) or selling fee. Bear in mind that we are not including free transfers like Joel Matip or signings below €10m such as Andrew Robertson.
| Player | Purchasing fee (€ m) | Current valuation (€ m) | Valuation change (€ m) |
|---|---|---|---|
| S. Mané | 41.2 | 120 | +79 |
| G. Wijnaldum | 27.5 | 50 | +22 |
| V. van Dijk | 84.7 | 90 | +5.3 |
| M. Salah | 42.0 | 150 | +108 |
| A. Oxlade-Chamberlain | 38.0 | 35 | -3.0 |
| Alisson | 62.5 | 72 | +9.5 |
| N. Keïta | 60.0 | 60 | – |
| Fabinho | 45.0 | 50 | +5.0 |
| X. Shaqiri | 14.7 | 25 | +10 |
| Total | 415.6 | 652 | +236 |
Smart scouting: the secret formula
So, what is the secret formula that Brentford and Liverpool are using? We believe that it comes down to two main factors, which together form an underlying philosophy: the quest for rationality.
The proceedings from player transfers give a football club the opportunity to reinvest the money in either undervalued talents or players who better suit the club’s playing style. The Holy Grail of scouting is achieving both objectives at the same time. And Liverpool don’t seem far from it.
- Data analytics: Brentford and FC Midtjylland use data and algorithms from Smartodds which, according to Tippett, are based on the concept of Expected Goals (although calculated in a particular way – see the paragraph on Expected Goals below for more details); FC Liverpool have formed a dream team of data scientists to better gather and analyse data;
- Selling the over-performers: Not being afraid of selling a player is key to both Brentford’s and Liverpool’s financial approach. In the transfer market, football clubs often forget long-term, rational considerations and make their fans’ short-term emotions the main driver of their decisions. For a club’s long-term financial success, it is key to remain as rationale as possible and, in our view, there aren’t many better options than data analysis. Like Matthew Benham’s Brentford, Liverpool aren’t afraid of selling important players (Suarez, Coutinho and Sterling to name but a few), because the proceedings give them the opportunity to reinvest the money in either undervalued talents or players who better suit the club’s playing style. The Holy Grail of scouting is achieving both objectives at the same time. And Liverpool don’t seem far from it.
Performance analysis
Big data analysis helps us to discover counter-intuitive facts about football, upon which we can build an innovative and winning strategy.
Football clubs, along with the media and even fans, can, with the support of data, easily understand how a team or player has performed over the course of a match or season.
Even the most basic stats, like the number of shots, shots on target, and ball possession, can offer a guide, albeit an incomplete one, of how two teams have performed and if their performance was in line with the result of the match.
If we then improve the granularity of the stats and include selected performance indicators, the dataset gradually begins to give a more defined and complete picture of what has happened on the pitch, which enables a detailed analysis of the game. Such granularity can offer a coach more information on how the team has performed and even whether or not it complied with the pre-match instructions.
Performance analysis normally comprises video and data. It is becoming increasingly common to have coaches who, in post-match comments to their players, explain to them what they did wrong or could improve with the help of video and statistics. At the end of the day, showing objective facts is a more efficient and persuasive way to state a point.
Moreover, big data analysis helps us to discover counter-intuitive facts about football, upon which we can build an innovative and winning strategy. For instance, it is becoming increasingly clear that old-school crossing isn’t a very effective strategy. We have published an ad-hoc analysis of this, the link to which is below.
Expected Goals (xG)
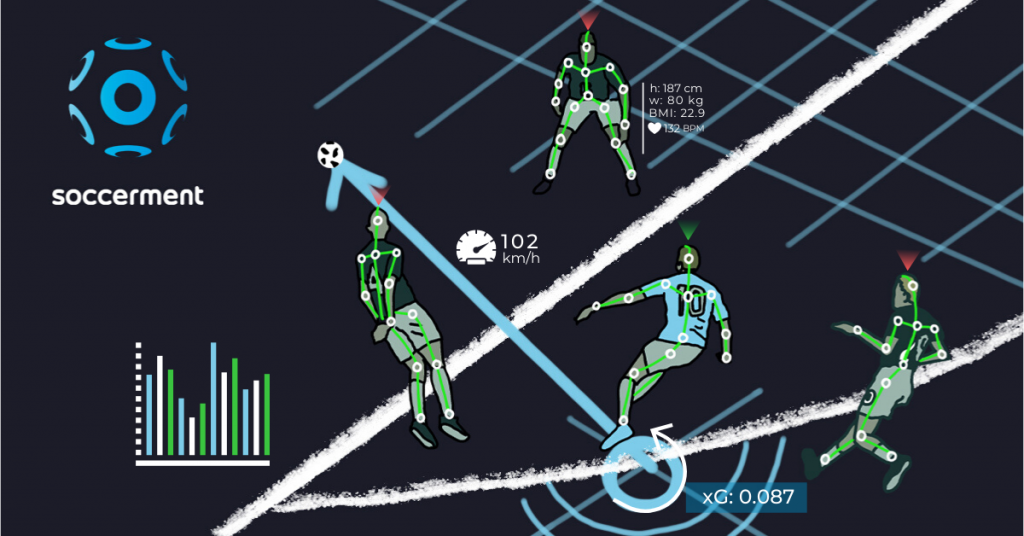
Expected goals is one of the most revolutionary, and at the same time simple, advanced metrics in football. An “Expected Goal” (or “xG”) represents the expected value from a shot, i.e. the probability of that shot becoming a goal. Calculating such probability depends on a number of factors, including distance from goal, the angle of the shot, the body part the shot was taken with (head, strong or weak foot), the playing situation (open play, counterattack), and others (whether there were any opponents blocking the space ahead, for example).
The Expected goal (xG) represents the expected value from a shot, i.e. the probability of that shot becoming a goal.
Expected Goals are normally calculated using a “frequentist” approach: a dataset of several thousand shots is categorised according to the aforementioned variables (distance from goal, angle, body part, etc). If one type of shot, which for example occurred 10,000 times in the dataset, is scored 200 times, then that kind of shot is “expected” have an xG of 0.02 (2% probability). Using this methodology, we can determine that a penalty is worth 0.76 Expected Goals, i.e. a penalty has an implied probability of 76% of being scored. It is rare for an Expected Goals model to be built using a Bayesian approach, but sometimes they are. Finally, in a few selected cases, they seem to be built without any statistical grounding at all. According to the book “The Expected Goal Philosophy“, the betting-consultancy Smartodds, owned by Brentford’s Matthew Benham, calculates Expected Goals differently: instead of being based on statistical expected values of the taken shots, they are based on subjective opinions regarding the probability of each attack (not shot) becoming a goal.
The concept of Expected Goals allows analysts to include the quality of the shots in equations that historically had been dominated by the quantity of the shots and some subjective opinions about their value.
How can Expected Goals revolutionise football? In our view, there are two main areas that are clearly open for disruption:
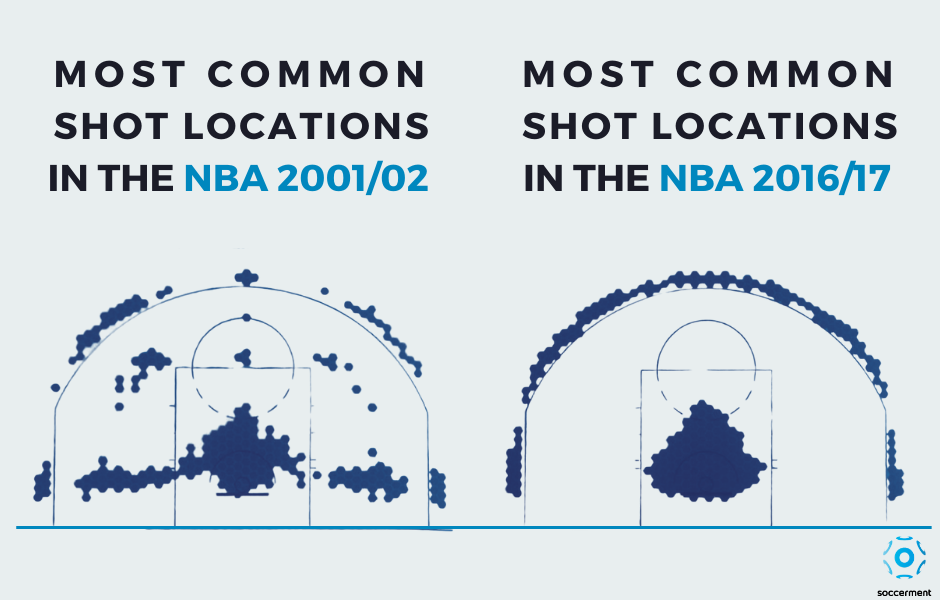
- A deeper and wider analysis of Expected Goals will “force” football coaches to rethink their tactical strategies, especially in one specific area: shot location. In the next 10-15 years we expect to see in football something similar to what has happened in the NBA: a complete overhaul of shooting locations. In the book “Sprawlball: A Visual Tour of the New Era of the NBA”, the most common shot locations in the NBA 2001-02 are compared to the ones of 2016-17 (see picture below). It is noticeable how risk-reward considerations based on analytics have dramatically increased the amount of three-pointers and limited the number of two-pointers outside “the paint”.
- We would expect (and encourage) football clubs to increasingly rely on objective measures such as Expected Goals when it comes to gauging teams’ performances and evaluating how well or badly coaches are doing. It happens all too often that coaches are sacked after poor results despite these not being caused by poor team performance, but rather by bad luck.
Expected Goals, as discussed above, allows us to better quantify and measure performances and separate them from results.
Expected Assists (xA)
Expected Assists are derived from Expected Goals and measure the probability of a created chance (or key pass) being converted into a goal. Very skilled creators whose teammates haven’t been too good at finishing can, with the help of Expected Assists, be recognised for their efforts.
Take for example, Kylian Mbappé (the red dot in the chart below): in the French Ligue 1 he managed 5 assists this season, or 0.3 per 90 minutes. Not a bad return, but far from the highest-ranking players on this metric. However, he has created 10.6 Expected Assists, 0.625 per 90 minutes, one of the highest in Europe.
[infogram id=”_/ebAKtNPZEAh8tdkVTXq0″ prefix=”adG” format=”interactive” title=”Expected Assists”]
Performance indicators

Instead of looking at single variables and metrics, certain clubs, federations and companies have started aggregating them, creating specific performance indicators. One example is the “Indice di Pericolosità” (Danger Index), created for the Italian National Team by Maurizio Viscidi and Antonio Gagliardi (pictured above).
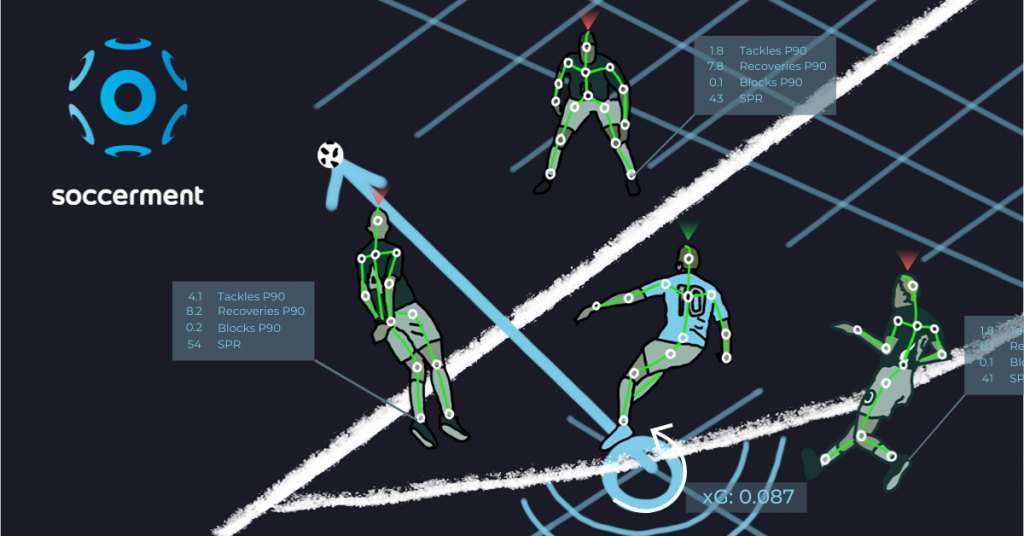
Soccerment Performance Rating (SPR) and Performance Indexes
We have developed our own performance indicator, which we apply to all footballers and teams in our database, called Soccerment Performance Rating (‘SPR’). The SPR is a synthetic measure with which we can value a player’s overall contribution to the team’s performance. All events on the pitch are taken into consideration and weighed using ad-hoc coefficients, which also depend on the players’ roles. The algorithms split the players’ contribution into three phases – defence, buildup and attack – in order to give us a clearer view of the players’ overall approach to the game.
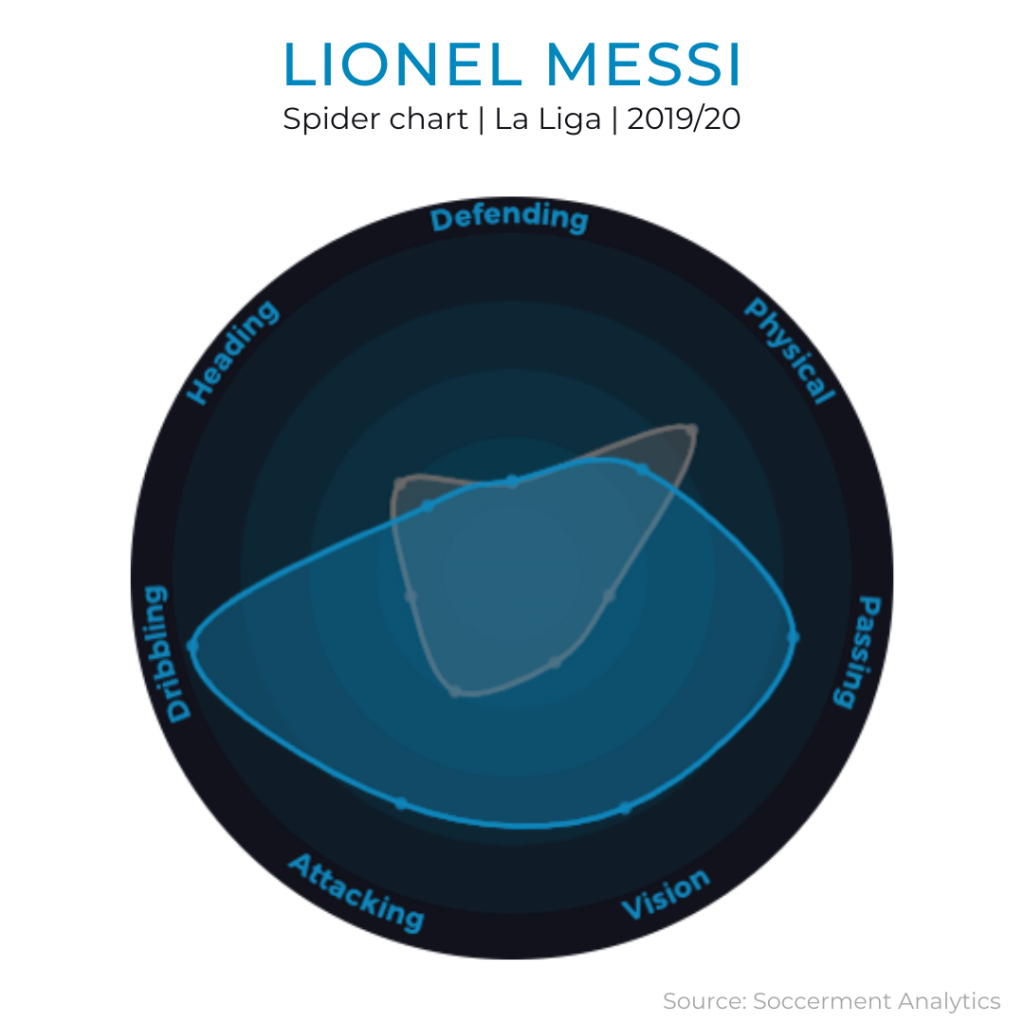
The Performance Indexes, reproduced in our spider charts, offer a synthetic measure of a very specific aspect of player performances. Each performance index takes into account n metrics belonging to a specific technical event. For example, for the “Vision” index, we take into account, among other things, the quantity and quality of chances created, through balls and long balls; while the “Passing” index applies different weights to the players’ passes, depending on the area of the pitch from which they originate, their direction, their accuracy and their length. See Messi’s spider chart below (in blue) as an example: we compare his performance indexes to the average indexes of the forwards in our database (in grey).
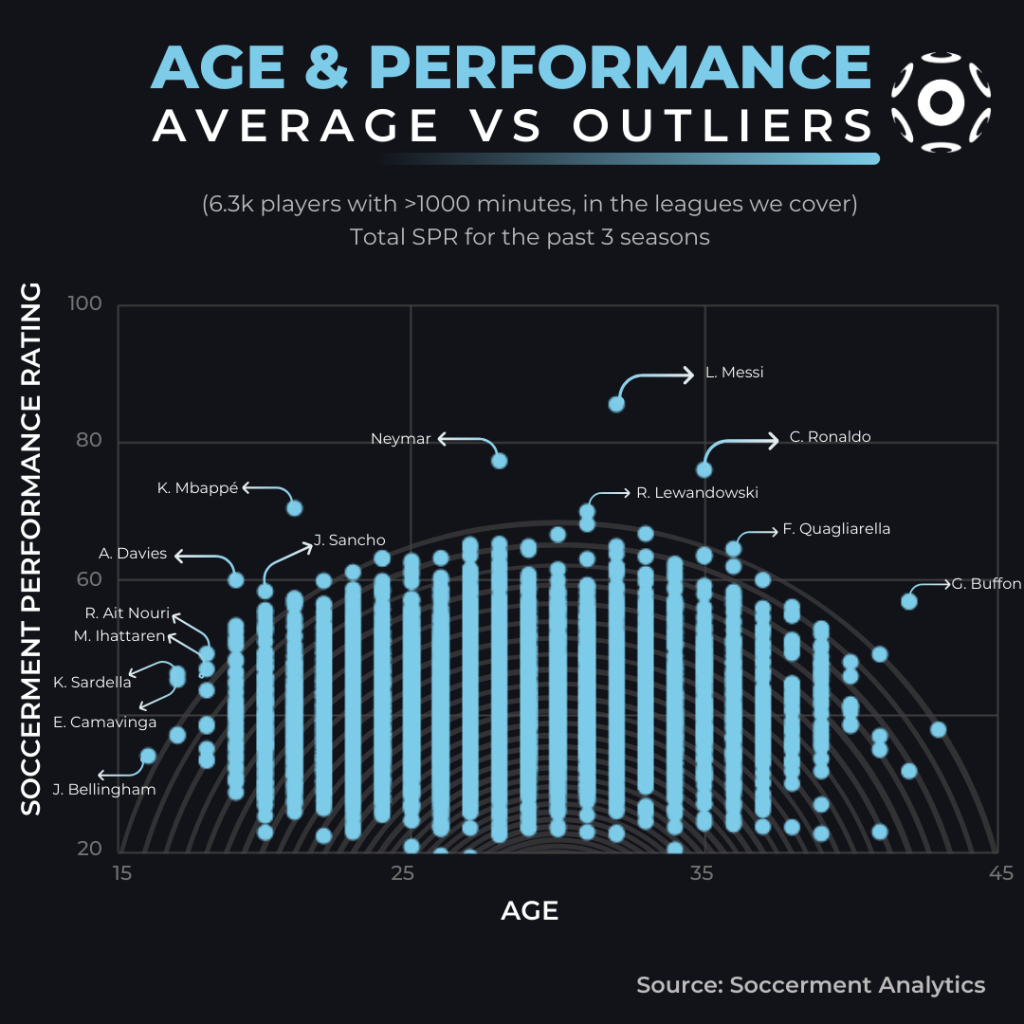
The Performance Indexes and the SPR are powerful scouting tools. The former can clearly identify the best players in one specific, technical aspect of the game; while the latter offers an immediate view on players’ performance level during the season, or even throughout their entire career. Using a performance index like ours it is easier to spot outliers. In the case below, we used it to find the outliers for different age groups. For more information, you could read our post on LinkedIn.
Player development
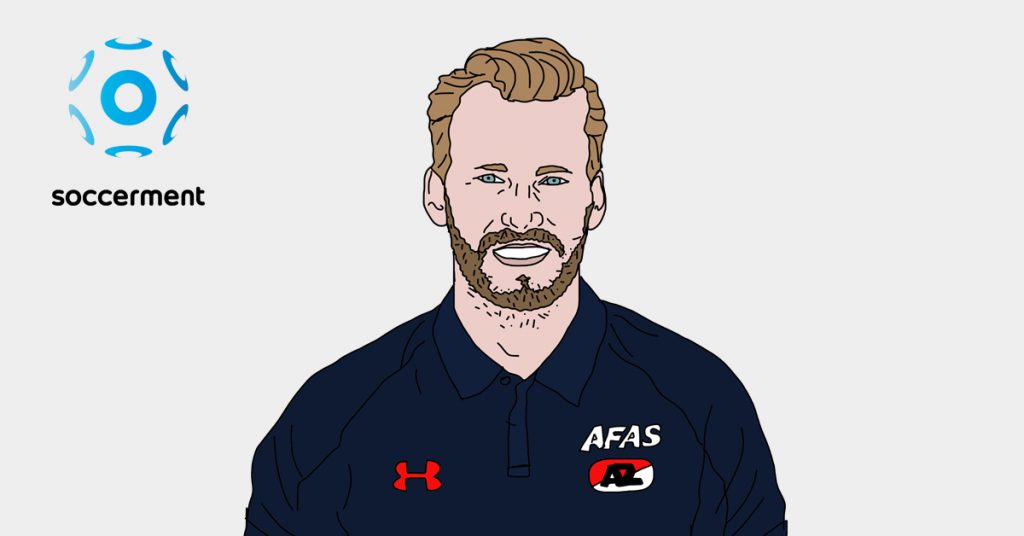
“We don’t buy success, we create it.” (Marijn Beuker)
Data analytics is also growing in importance when it comes to youth development. The reason is simple: having objective and measurable feedback can help both coaches and players speed up the learning processes and create virtuous development cycles. Basically, data analytics becomes a tool to help predict and cultivate players’ potential.
The best example of this is probably the Dutch club AZ Alkmaar.
We have written extensively about how AZ structure their development process through data in the analysis linked here below. In the analysis we also explain how long-term planning requires clear and efficient governance, which is still not too common at football clubs, at any level. Above is pictured Marijn Beuker, AZ Alkmaar’s Director of Sports Development.
At Soccerment we are working on innovative solutions to gather homogeneous and in-depth statistics across youth teams of different ages. For additional information, please send an email to info@soccerment.com. If you would just like to stay up-to-date, click below.
Injury prevention and rehabilitation
The origins: Milan Lab

Milan Lab was founded in 2002 to reduce the risk of AC Milan players getting injured, help injured players recover faster, and improve training methodologies by personalising sessions. It is said that AC Milan’s chairman, Silvio Berlusconi, decided to form Milan Lab and tasked Belgian doctor Jean Pierre Meersseman (pictured above) with the job after Fernando Redondo, recently signed from Real Madrid, ruptured his anterior cruciate ligament during pre-season training.
Milan Lab’s fame grew over the years and began to be seen as one of the drivers of AC Milan’s domination of European football. When the Rossoneri won the Champions League in 2007, for instance, the team’s average age was well above 30 and captain Paolo Maldini was approaching 40 years of age. Milan Lab seemed to be dramatically extending players’ careers. In 2008, Simon Kuper, one of the authors of Soccernomics, referred to Milan Lab as AC Milan’s “secret of youth”, in an article on the Financial Times.
Although the use of technology and data was pivotal to Milan Lab, its detractors say that at the very core of the project was the chiropractic philosophy, which is seen as unorthodox by most of the scientific world.
Today: Data & tech to help on athletic performance and injury prevention

Performance monitoring can bring a clear vision of the framework required to develop and optimise the models used to analyse training loads.
Since the early 2000s there has been an exponential rise in research into how we monitor training loads, allowing sport scientists to base their analyses on strong foundations. Nowadays, any high-level club consistently monitors players’ position, while velocity tracking with GPS allows them to objectively measure the “external load”, i.e. the amount of work performed on the pitch. The variables most frequently used to quantify external load during training sessions and matches are: distance covered in different speed zones (jog, run, sprint), accelerations, heart rate-related variables, and accelerometer metrics (player load, intensity).
External load tracking through GPS can be also used to predict the risk of injury professional players. Recent research has showed that football players’ injuries can often be predicted by looking at the players’ workloads during training and competition. Researchers discovered that the greatest injury risk occurred when players accumulated a very high number of short bursts of speed during training over a three-week period. Players recorded significantly higher meters per minute in the weeks preceding an injury, compared with their seasonal averages (+9.6 and +7.4% for 1- and 4-week blocks, respectively), indicating an increase in training and gameplay intensity in the lead up to injuries. Furthermore, “injury blocks” showed significantly lower average new body load compared with seasonal averages (-15.4 and -9.0% for 1- and 4-week blocks, respectively). Periods of relative under-preparedness could leave players unable to cope with intense bouts of high-intensity effort during competitive matches. This is clearly a topical problem nowadays, as the top football leagues restart after the coronavirus-induced break.
Current research in sports biomechanics supports this trend, showing that athletes’ movement patterns deteriorate in a potentially harmful fashion when repeating intense running and changes of direction. Here is a link to a research paper on this subject, authored by Soccerment’s Head of R&D Matteo Zago (portrayed in the picture above) and published in the European Journal of Sports Science.
In sum, performance monitoring can bring a clear vision of the framework required to develop and optimise the models used to analyse training loads. This will help these models gain better insight into players’ fitness, readiness to perform and fatigue, and improve the quality and efficiency of their assistance to coaching staff.
Football analytics: Books to read
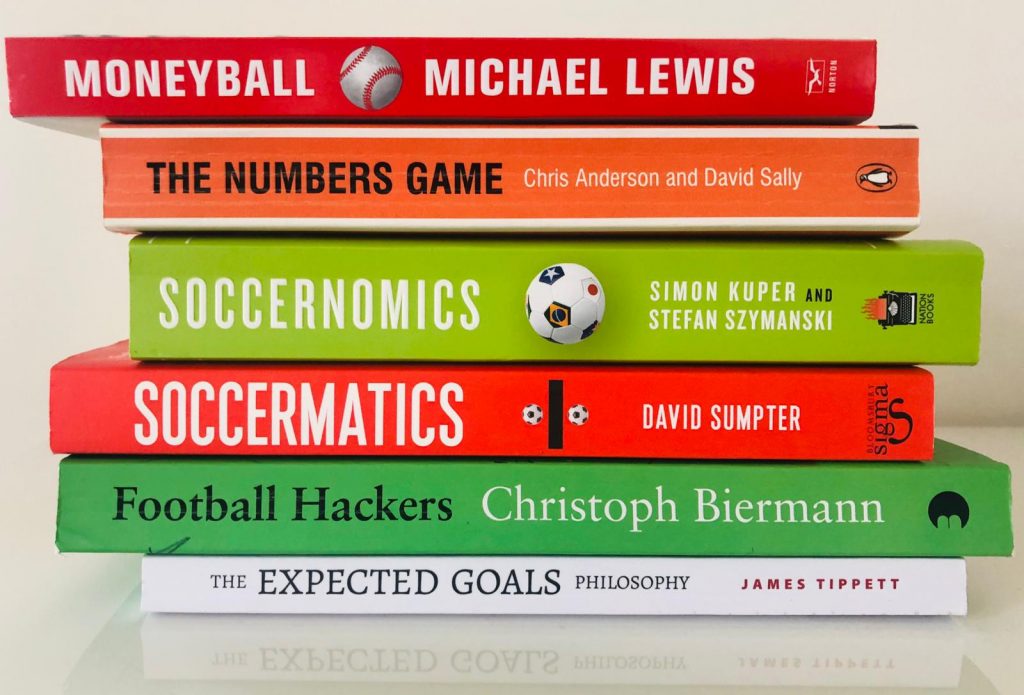
Pictured above is the selection of books we recommend to those looking to increase their knowledge and understanding of data analytics in football.
The best way to start, in our view, is with a book that isn’t even about football: “Moneyball: The Art Of Winning An Unfair Game” (by Michael Lewis), which we have already mentioned in this analysis. The book and its story about the Oakland Athletics baseball team describe the importance of sports analytics.
We would then read “The Numbers Game“, by Chris Anderson and David Sally, to start digging into football data. The book shows that using data in the beautiful game is not only possible but extremely useful, especially when it comes to myth busting.
“Soccernomics” (by Simon Kuper and Stefan Szymanski), “Soccermatics” (by David Sumpter) and “Football Hackers” (by Christoph Biermann) are all solid overviews of how the discipline of football analytics has evolved and begun to flourish. Finally, “The Expected Goals Philosophy” (by James Tippett) narrows the analysis down to Expected Goals and offers some insights into how Brentford and Smartodds are run.
To stay informed about our research and the development of our tools, click on the button below and – if you haven’t done it yet – sign up to Soccerment Analytics. We promise: no spam!
If signing up is a bit too much, would you like to stay in touch? You can “like” our Facebook page and follow us on Instagram and Twitter.
For any query, suggestion or comment, you could send us an email: research@soccerment.com.
Comments
4 responses to “The Growing Importance of Football Analytics”
[…] Transferurile exorbitante din fotbal nu se mai rezumă la sportivi. Printre cele mai mari achiziții ale echipelor de club se numără acum analiștii de date. Statistica are deja un rol în deciziile privind alegerea noilor jucători și antrenori, dar echipe precum Manchester City, Liverpool sau FC Barcelona ridică jocul la un alt nivel: datele sunt colectate chiar în timpul meciului. Ulterior, experții le analizează cu ajutorul programelor software specifice, iar prin diverse strategii și permutări de jucători, îmbunătățesc, în timp real, șansele de câștig ale echipei. Deocamdată, doar cluburile de top au acces la astfel de resurse (soft-uri și experți). Cu timpul, costul programelor de big data analysis va scădea, tot mai multe echipe se vor alătura trendului, posibil chiar și din alte sporturi, iar progresul tehnologic, în special în domeniul inteligenței artificiale, va conduce la decizii de joc din ce în ce mai precise. Cu alte cuvinte, viitorul sporturilor se joacă atât pe teren, cât și în afara lui.Citește mai mult: soccerment.com – The Growing Importance of Football Analytics […]
[…] se joacă atât pe teren, cât și în afara lui.Citește mai mult: soccerment.com – The Growing Importance of Football Analytics Adaugat in Tehno Impact. Salveaza permalink. Pe urmele fake-ului: Rezultatele interogărilor […]
[…] Transferurile exorbitante din fotbal nu se mai rezumă la sportivi. Printre cele mai mari achiziții ale echipelor de club se numără acum analiștii de date. Statistica are deja un rol în deciziile privind alegerea noilor jucători și antrenori, dar echipe precum Manchester City, Liverpool sau FC Barcelona ridică jocul la un alt nivel: datele sunt colectate chiar în timpul meciului. Ulterior, experții le analizează cu ajutorul programelor software specifice, iar prin diverse strategii și permutări de jucători, îmbunătățesc, în timp real, șansele de câștig ale echipei. Deocamdată, doar cluburile de top au acces la astfel de resurse (soft-uri și experți). Cu timpul, costul programelor de big data analysis va scădea, tot mai multe echipe se vor alătura trendului, posibil chiar și din alte sporturi, iar progresul tehnologic, în special în domeniul inteligenței artificiale, va conduce la decizii de joc din ce în ce mai precise. Cu alte cuvinte, viitorul sporturilor se joacă atât pe teren, cât și în afara lui.Citește mai mult: soccerment.com – The Growing Importance of Football Analytics […]
[…] siamo giunti alla conclusione che i motivi principali per i quali i nostri utenti ritengono l’analisi del match fondamentale […]